
Abstract
Stimulation of cultured epithelial cells with scatter factor/hepatocyte growth factor (HGF) results in the detachment of cell-cell junctions and initiation of cell migration. Instead of coordinating collective cell behavior within a tissue, cells become solitary and have few cell-cell interactions. Since epithelial scattering is recapitulated in cancer progression and since HGF signaling drives cancer metastasis in many cases, inhibitors of HGF signaling have been proposed to act as anticancer agents. We previously sought to better understand critical components required for HGF-induced epithelial scattering by performing a forward chemical genetics screen, which resulted in the identification of compounds with no previously reported biological activity that we report here. In efforts to determine the mechanism of these compounds, we find that many compounds have broad antiproliferative effects on cancer cell lines by arrest of cell division in G2/M with minimal induction of apoptosis. This effect is reminiscent of microtubule-targeting agents, and we find that several of these scaffolds directly inhibit microtubule polymerization. Compounds are assessed for their toxicity and pharmacokinetics in vivo. The identification of novel small-molecule inhibitors of microtubule polymerization highlights the role of the microtubule cytoskeleton in HGF-induced epithelial scattering.
Introduction
Hepatocyte growth factor (HGF) binds the c-met receptor tyrosine kinase, 1 driving increased proliferation, migration, and epithelial scattering, 2 as well as enhanced cell survival. 3 Detachment of individual cells from epithelial tissues to yield invasive and solitary mesenchymal cells that can colonize distant tissues occurs in tightly regulated instances throughout development, where it is termed epithelial-mesenchymal transition (EMT). It is thought that HGF signaling drives cancer metastasis in part by triggering EMT, resulting in detachment of cells from the primary tumor, their increased migration and invasion, and colonization of distant sites.
Given the connection of HGF signaling and cancer progression, there has been intense interest in developing therapeutics that inhibit cellular events triggered by HGF signaling. 4 Ligand receptor binding and the enzymatic activity of the c-met receptor tyrosine kinase have been the principal targets of rational therapeutic design, while fewer efforts have targeted downstream components of the HGF signaling network for potential therapeutic intervention. We previously reported efforts to identify components and systems required for epithelial scattering using phenotypic screening of a small-molecule library. 5 We used an assay system that measures MDCK cells’ scattering response to HGF, which is a well-established model system for HGF-induced epithelial scattering. In fact, epithelial scattering was first described using this model system. 6
In our prior publication, we reported a number of screen compounds with known biological activity, including multiple scaffolds that target the microtubule cytoskeleton. 5 The screening assay uses quiescent cells to limit any compound effects on cell growth. We showed that microtubules are required for mobilization of calcium channels to the plasma membrane shortly after HGF stimulation, which explains why microtubule-targeting agents were found in our chemical screen.
Here we report the structures of a number of structurally distinct compounds from our previous phenotypic, cell-based screen for inhibitors of HGF-induced epithelial scattering but with no previously ascribed biological activity. We assess the effects of these compounds in cellular assays, revealing how they affect cell behavior that might be consistent with microtubule targeting. Biochemical assays reveal that a number of compounds directly inhibit microtubule polymerization. Some drug-like properties of these scaffolds are also reported.
Materials and Methods
Chemical Screening
Cell-based assays measuring HGF-induced EMT were used as described. 5 Briefly, MDCK cells, grown in Dulbecco’s modified Eagle’s medium (DMEM) + 10% fetal bovine serum, were seeded on the upper chamber of a 96-well Transwell filter plate and cultured for 24 h to form a confluent monolayer with minimal cell division. Compounds were then added from 100× DMSO stocks to a final screening assay concentration of 5 µM, ensuring that DMSO concentrations did not exceed 1% in the assay. Cells were then stimulated with HGF and cultured for an additional 24 h. At the conclusion of the assay, Transwell filters were fixed with 4% paraformaldehyde on ice for 15 min and stained with crystal violet. After initial visual inspection for plates with biologically active compounds, quantitation of the assay was performed by swabbing the upper surface of the Transwell filter of cells and then measuring light transmission through the filter. Negative control assays without drug treatment and positive control experiments lacking HGF stimulation and drug treatment were used to establish the assay range for each plate. This screening assay was applied to a 50,000-compound chemical library representing drug-like small molecules (ChemBridge, San Diego, CA). To minimize variability between assays, we used an Eppendorf EpMotion 5070 (Eppendorf, Hamburg, Germany) liquid handling robotics system to initiate, treat, and process all screening assays.
Cell Proliferation Assays
Cancer cell proliferation assays were performed by seeding cancer cell lines in the wells of a 96-well plate. After 24 h, a set of control wells was fixed and stained as described below. Other wells were treated with compounds or vehicle, then cultured for 48 h. Cells were fixed by addition of trichloroacetic acid to a final concentration of 20% (v/v), washed with 1% (v/v) acetic acid, air dried, and stained with 0.4% (w/v) sulforhodamine B in 1% acetic acid. After washing with 1% acetic acid, stain was released with a 10-mM Trizma (Sigma, St. Louis, MO) base and assay values were quantified by measuring absorbance at a wavelength of 515 nm. In all cell-based assays, seeding, treatment, and stimulation was performed using an Eppendorf EpMotion 5070 robotics station to maximize reproducibility.
Flow Cytometry
Analysis of cells’ distribution through the cell cycle was performed on MDA-MB-231 cells after 24 h of treatment with the indicated compound at a final concentration of 10 µM DMSO. Cells were trypsinized and fixed in suspension with ice-cold absolute ethanol and subsequent staining with propidium iodide in the presence of Triton X-100 and RNase-free DNase. Analysis of apoptosis in cell populations was performed on MDA-MB-231 cells after 24 h of treatment with the indicated compound at a final concentration of 10 µM or with DMSO. Trypsinized cells were processed for flow cytometry after staining with propidium iodide and FITC–Annexin V using a kit from BD Biosciences (San Jose, CA). Cells were analyzed by flow cytometry using the Attune Acoustic Focusing Cytometer (Applied Biosystems, Foster City, CA, USA).
Microtubule Polymerization Assays
Analysis of microtubule polymerization was performed using the protocol and reagents in the Tubulin Polymerization Assay Kit from Cytoskeleton (Denver, CO, USA). In summary, purified tubulin was maintained in a buffer under nonpolymerizing conditions. Compounds were added to each assay from DMSO stocks and buffer, and then polymerization was initiated by addition of a polymerization buffer. Fluorescence during polymerization was measured in real time using a BioTek (Winooski, VT) Synergy HT plate reader.
Bioanalytical Method Development
To measure compound levels in biological samples, analysis was conducted using a Shimadzu LC20-AD HPLC interfaced to an AB Sciex 4000 QTRAP (Kyoto, Japan) equipped with an electrospray ionization source (ESI) operated in the positive ion mode (Framingham, MA, USA). Separation of the analytes and the internal standard from the plasma matrix was performed with a Thermo Aquasil C18, 100 × 2-mm 5-µm particle column (Thermo Fisher, Waltham, MA) operated at ambient temperature using a gradient elution profile. The mobile phase consisted of 5 mM ammonium acetate with 0.1% formic acid (A) and acetonitrile with 0.1% formic acid (B). The starting composition was 60/40 A:B, which was ramped linearly to 5/95 A:B over 4 min, held for 1 min and then returned to 60/40 A:B, and equilibrated for 2.5 min. A 10-µL injection volume was used with a flow rate of 400 µL. To prepare samples, a 50-µL aliquot of each biological sample was placed into individually labeled 1.5-mL microcentrifuge tubes, and 500 µL of 5 ng/mL terfenadine in acetonitrile was added. Each sample was vortexed well and then centrifuged for 5 min at 13,000 × g. The resulting supernatant was transferred to an autosampler vial for analysis by liquid chromatography–tandem mass spectrometry (LC-MS/MS).
Pharmacological Assays
Maximum tolerable acute toxicity was determined by formulating compound in 5% DMSO, 20% Tween 80, and 75% saline. Doses of 400, 200, and 100 mg/kg were each injected into mice via the intraperitoneal route. Mice were monitored for 2 weeks, including measuring of body weights, to assess signs of toxicity. Pharmacokinetic properties of each compound tested were determined by injecting mice or rabbits via the intraperitoneal route. Blood was withdrawn from three animals at each designated time point following injection. Blood was collected in EDTA-coated polypropylene tubes and plasma was generated by centrifugation at 2000 × g for 15 min at 4 °C. Plasma was frozen on dry ice until processing. The amount of compound in each sample was measured using bioanalytical methods described above.
Plasma and Microsomal Stability
The plasma stability of compound 3 was determined in multiple species of plasma (rat, rabbit, hamster, guinea pig, gerbil, mouse, and human) collected with K2EDTA. Each species of plasma was spiked at 2 µg/mL and incubated at 37 °C for up to 1 h. Samples were taken at 5, 15, 30, and 60 min and analyzed for remaining amount of the parent compound using the above-described method. Metabolic stability of various compounds was determined in human liver microsomes (HLMs) at a 10-µM concentration of the substrate in a total reaction volume of 0.5 mL at 37 °C in a shaking water bath. The reaction mixtures consisted of RapidStart (XenoTech, Kansas City, KS, USA) NADPH regenerating solution consisting of 1.0 mM nicotinamide adenine dinucleotide phosphate (NADP+), 5 mM glucose-6-phosphate, 1 U/mL glucose-6-phosphate dehydrogenase; UGT reaction mix solution A consisting of 2 mM UDPGA; and UGT reaction mix solution B containing 50 mM Tris-HCl (pH 7.5), 8 mM magnesium chloride, and 25 µg/mL alamethicin. The total organic solvent concentration in the reaction mixture was kept at less than 1%. Aliquots of the reaction mixture were quenched with an equal volume of acetonitrile at the start of the reaction (0 min) and after incubation for 5, 15, 30, and 60 min and analyzed as described above.
Results
Compound Structures and Synthesis
As described in a prior publication, 5 we developed a phenotypic screen for inhibitors of HGF-induced epithelial scattering in attempt to find small molecules whose biological activity would elucidate molecular components required for this process. The screen assay accurately measures the potency of a known c-met inhibitor and distinguishes between positive and negative controls with a z′ of 0.48. 5 The screen assay uses MDCK cells, which form an epithelial monolayer on a Transwell filter at a high confluency with minimal cell division. Maximum throughput of this assay is a 96-well plate format, a result of limitations in the Transwell plate format. MDCK monolayers are treated with individual compounds, then stimulated with HGF in the lower culture chamber. HGF treatment normally stimulates epithelial scattering, resulting in individual cells detaching from the monolayer on the upper surface of the filter and actively migrating through the filter. After 24 h, cells on both sides of the filter are stained with crystal violet. Staining on the underside indicates productive HGF stimulation, and staining intensity is a quantitative readout of epithelial scattering. In contrast, reduced staining on both the lower and upper sides of the filter indicates toxicity, an outcome that is easily distinguished from inhibition of productive HGF signaling and whose assay results can be ignored.
We previously deployed this screen against a 50,000-compound library of drug-like molecules and reported seven active scaffolds with known mechanism of action. 5 Additional active compounds, specifically those without a previously reported biological mechanism, are shown in Figure 1 . Multiple analogues with high structural similarity are grouped to represent a subset of scaffolds identified in this screening step, while other scaffolds are represented by single derivatives. Compounds 1 and 2 are quinazolinones, examples of which were synthesized and previously assessed for anti-inflammatory activity 7 but also shown to have antitumor activity.8,9 Biphenylcarboxamide compound 5 was synthesized and assessed for antimicrobial activity. 10 Compound 6 belongs to a class of thienpyrimidones, members of which have been previously reported to have antiviral activity 11 and for 17β-hydroxysteroid dehydrogenase inhibition as antitumor agents. 12 Dihydroquinolines similar to compounds 8 to 10 have been attributed with activity against α-synuclein in a yeast model for Parkinson disease amelioration 13 and for use as anticonvulsant agents. 14 Compounds 11 and 12 are tetrahydroindolone esters that are structurally similar to several molecules that have been previously reported to have antitumor activity through an undefined mechanism,15,16 although microtubule inhibition is observed with some structurally related compounds. 17

Compounds identified in screening and their screening assay potency. The structures of compounds identified in the original phenotypic screen are depicted. Values in parentheses indicate the inhibition of epithelial scattering by each compound in the screening assay.
Given the provenance of the molecules from a chemical library, we made the compounds using the synthetic routes indicated (
Cellular and Biochemical Activity
To better understand the cellular function of the compounds depicted in Figure 1 , we assessed their activity in arresting proliferation of cancer cell lines from the NCI-60 panel. 18 We reasoned that any compounds that target microtubules would prevent cell proliferation in a broad panel of cell lines, which is precisely what we observed for the entire panel of molecules tested ( Fig. 2 ). There was only a single instance of a cell line being totally refractory to one of the compounds (HOP92 cells to compound 1). Most cell lines responded to all the compounds with similar levels of sensitivity, with the EC50 values of each compound falling within an order of magnitude for all compounds tested. The general trend was that cell lines were similarly sensitive to all of the compounds tested; besides cell lines where a single compound had a markedly altered potency than the others, few cell lines showed a high degree of variability in sensitivity to the panel of compounds (HOP92 and UACC257). Interestingly, compound 12 was typically more potent than compound 11, despite compound 11 generating a stronger effect in our screening assay.
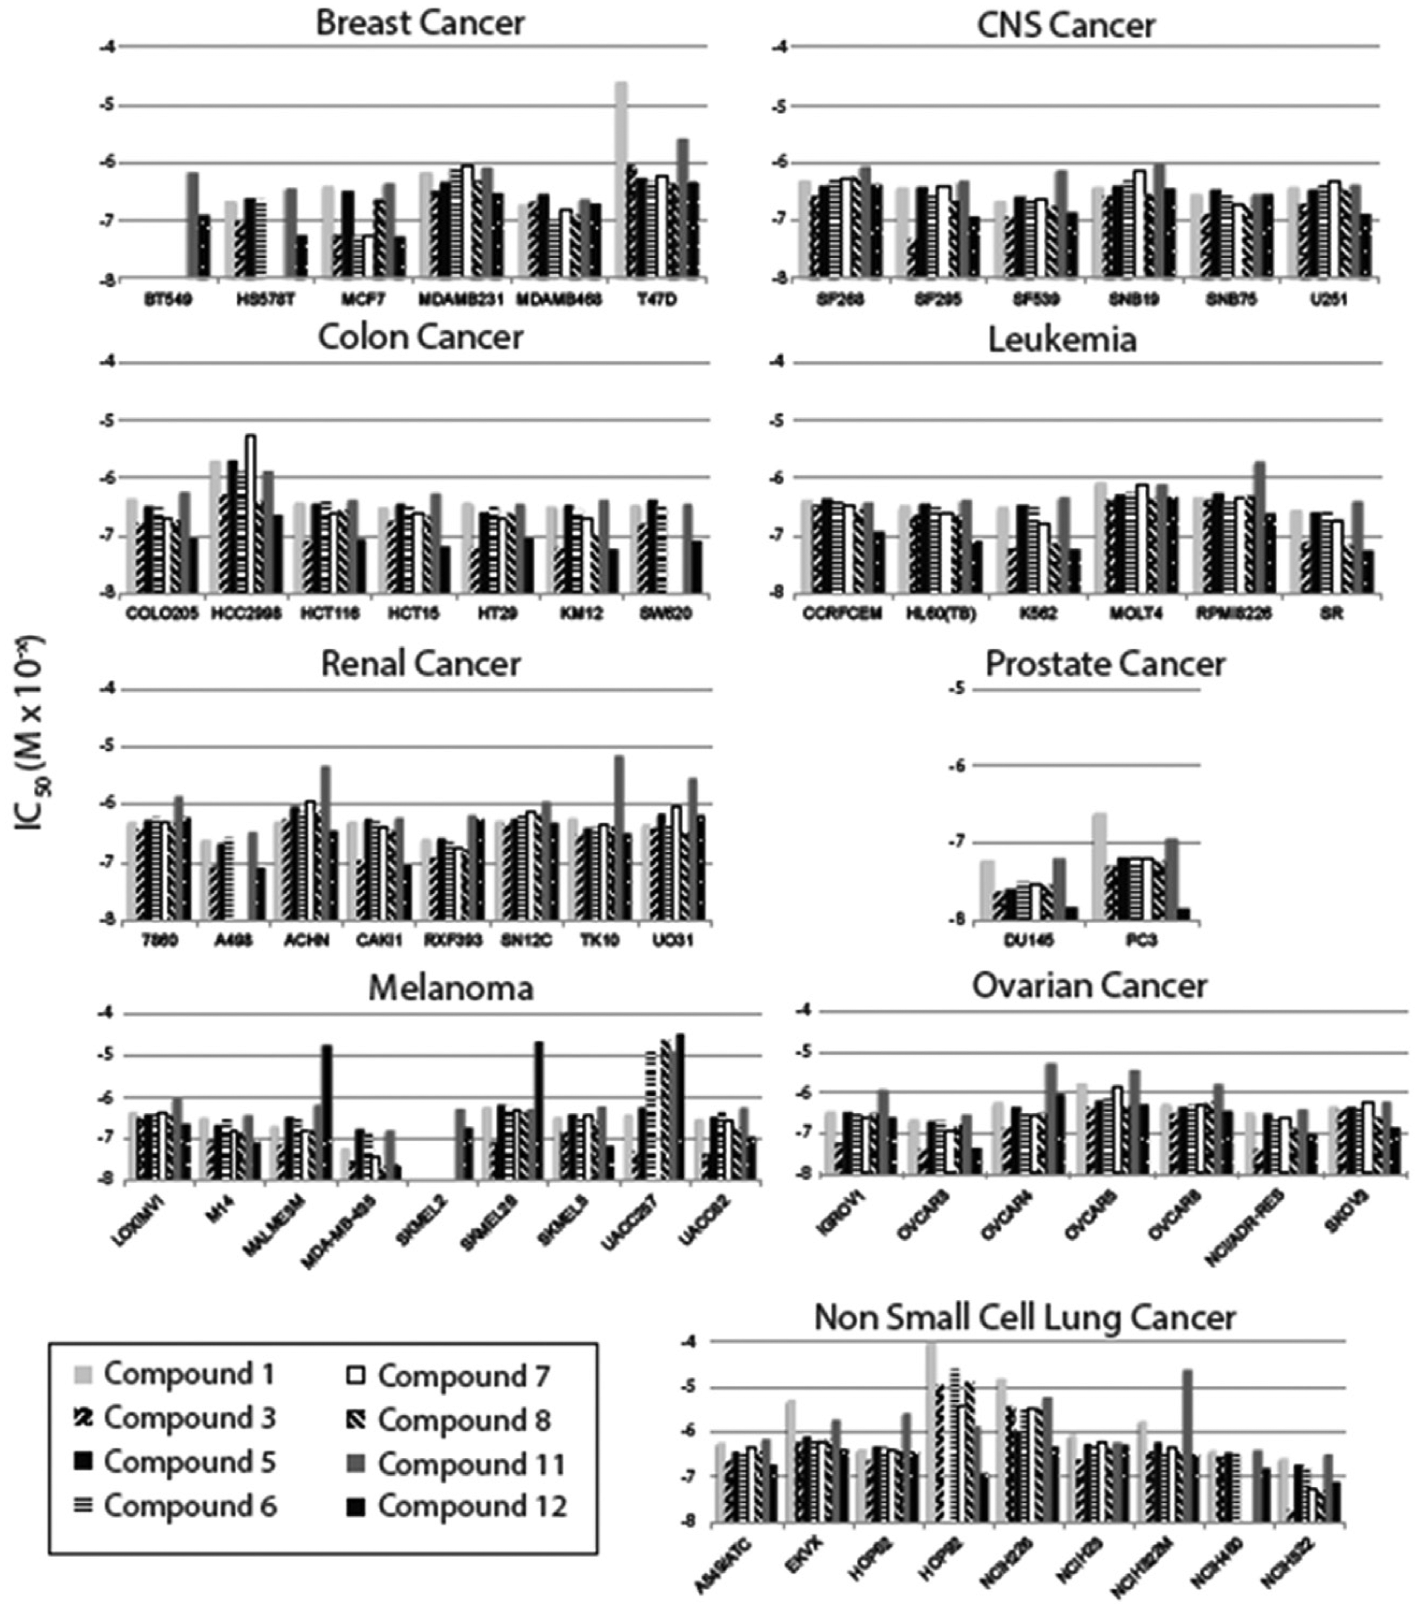
Compounds’ antiproliferative potencies in NCI-60 cancer cell lines. Plots show the EC50 of growth inhibition for each cell line and compound tested. No bar indicates the cell line was not tested for that compound. Cell lines are grouped by cancer type.
We also reasoned that molecules targeting the microtubule cytoskeleton would arrest cell proliferation in anaphase. To test this, we stained the nuclei of compound-treated MDA-MD-231 cells and determined the distribution of cells across G1, S, and G2/M phases of the cell cycle using flow cytometry ( Table 1 ). We found that an accumulation of cells in the G2/M phase was clearly observed for cultures treated with compounds 6, 8, and 11. Treatment with compounds 1, 3, and 7 yielded an increase in the proportion of cells in G2/M relative to G1, but there were also increases in the number of cells in the S phase or what appeared to be cells or cellular debris with minimal DNA staining. Nevertheless, both experimental outcomes are consistent with activity that targets microtubule function. Cells treated with compound 5, in contrast, were predominantly in G1 with a small number of cells in the S phase and no accumulation of cells in G2/M, although there was an increase in cells or cell fragments that stained with less than a full copy of DNA.
Cellular Activity: Cell Cycle Effects and Induction of Apoptosis.
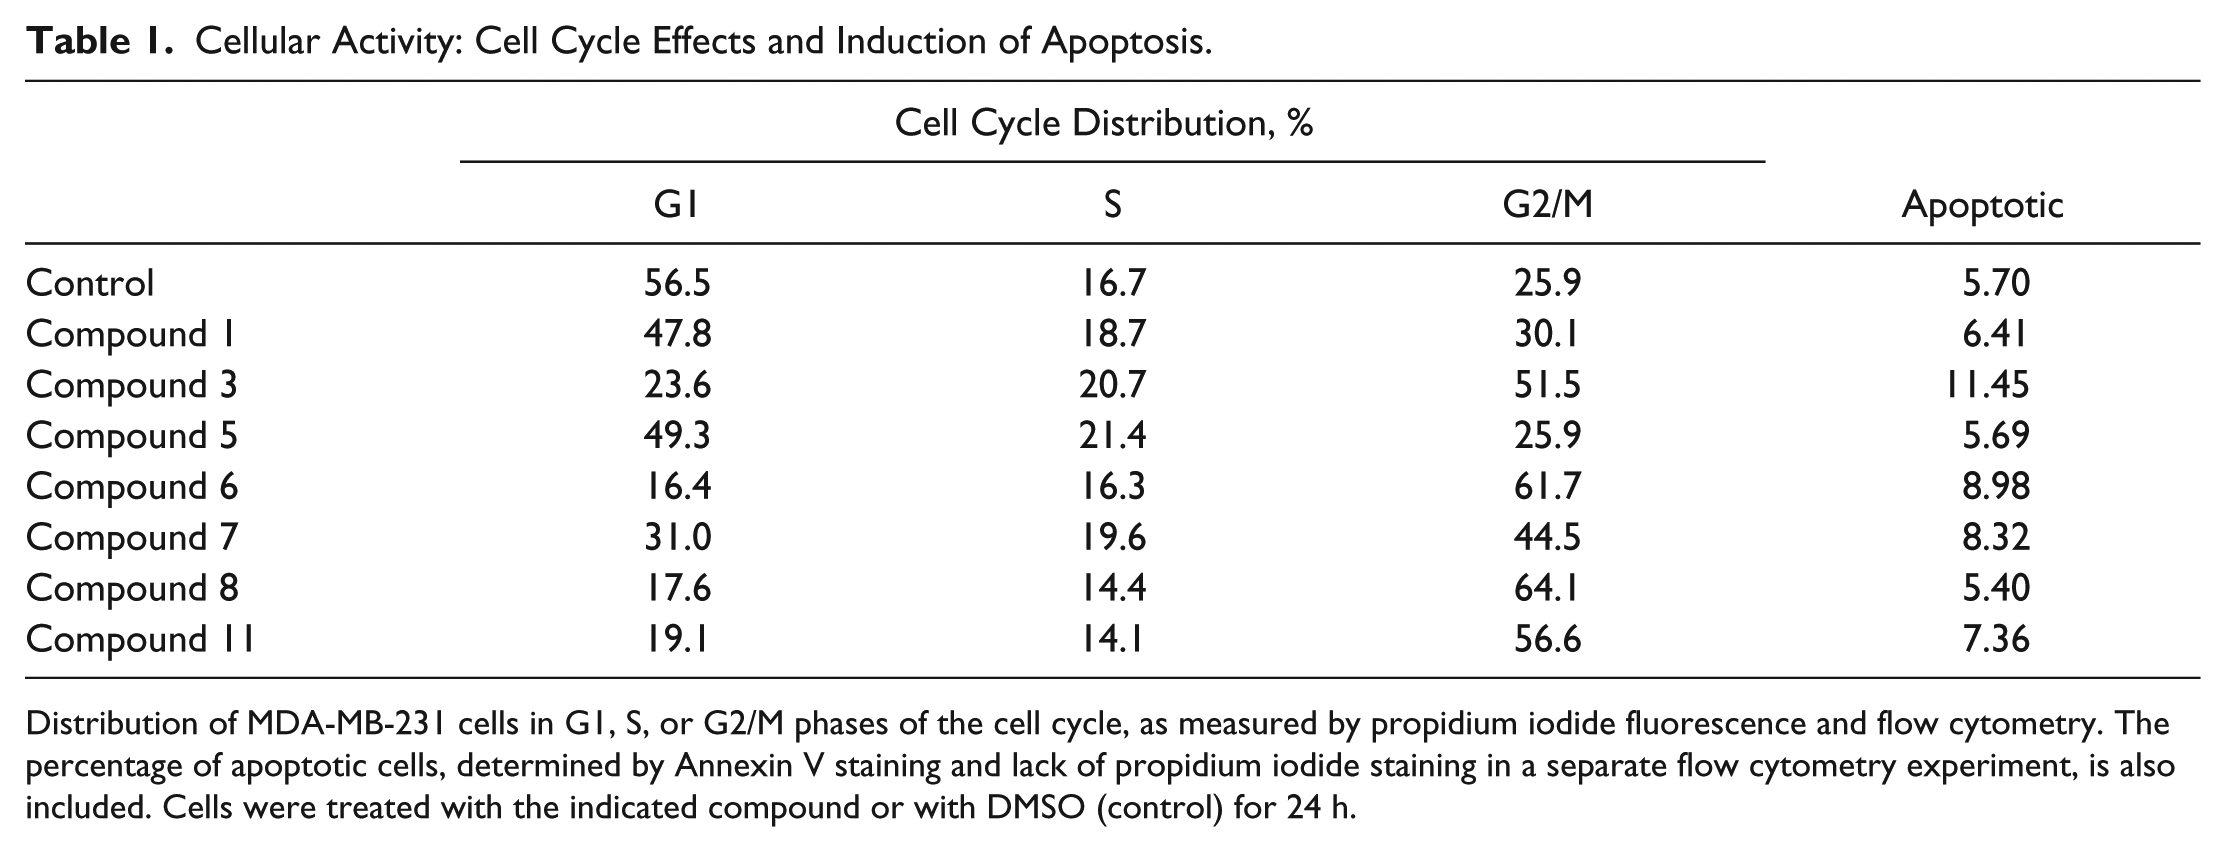
Distribution of MDA-MB-231 cells in G1, S, or G2/M phases of the cell cycle, as measured by propidium iodide fluorescence and flow cytometry. The percentage of apoptotic cells, determined by Annexin V staining and lack of propidium iodide staining in a separate flow cytometry experiment, is also included. Cells were treated with the indicated compound or with DMSO (control) for 24 h.
Since accumulation of cells in the G2/M phase might represent arrest resulting from a DNA damage response or arrest in mitosis, and since we did observe an accumulation of cell or cellular debris that had low DNA staining, we also assessed compounds for activity in inducing apoptosis. Typically, compounds that induce a G2 arrest as a result of a DNA damage response immediately enter apoptosis, whereas cells arrested in mitosis only undergo apoptosis at low levels during early treatment. We treated cultures of cells with analogues of each scaffold for 24 h and then measured apoptosis by flow cytometry of propidium iodide and Annexin V–stained MDA-MB-231 cells ( Table 1 ). Of untreated cells, 5.7% stained for Annexin V but not propidium iodide, indicating that this portion of the population was apoptotic. For all of the compounds tested, we saw only minimal increases in the numbers of apoptotic cells. Compound 3 showed the largest increase in the proportion of apoptotic cells, reaching 11.5% of the population, while the proportion of apoptotic cells in cultures treated with other compounds ranged from 5.4% for compound 8 to 9.0% for compound 6. This suggests that compounds generating G2/M arrest act by mitotic arrest and not by induction of a G2 phase cell cycle arrest that leads to apoptosis.
We finally sought to directly assess compounds for activity in microtubule polymerization assays using purified tubulin, which would assess the specific activity of each compound in preventing polymerization or, less likely, stabilizing microtubules. In control assays, polymerization began after a lag period, reaching a maximal rate and slowing to a plateau. Compounds 6, 7, and 8 had no effect on microtubule polymerization, even at the highest concentration tested. Compounds 1, 3, 5, and 7 reduced microtubule polymerization in a concentration-dependent manner; the maximal rate of polymerization at different concentrations allowed calculation of IC50 values for each compound, and compounds 3, 5, and 11 bore potencies similar to that of vincristine ( Fig. 3 ), a known microtubule targeting agent that is also an approved drug. Given that these polymerization assays used purified tubulin dimers only, these compounds must directly inhibit microtubule polymerization.
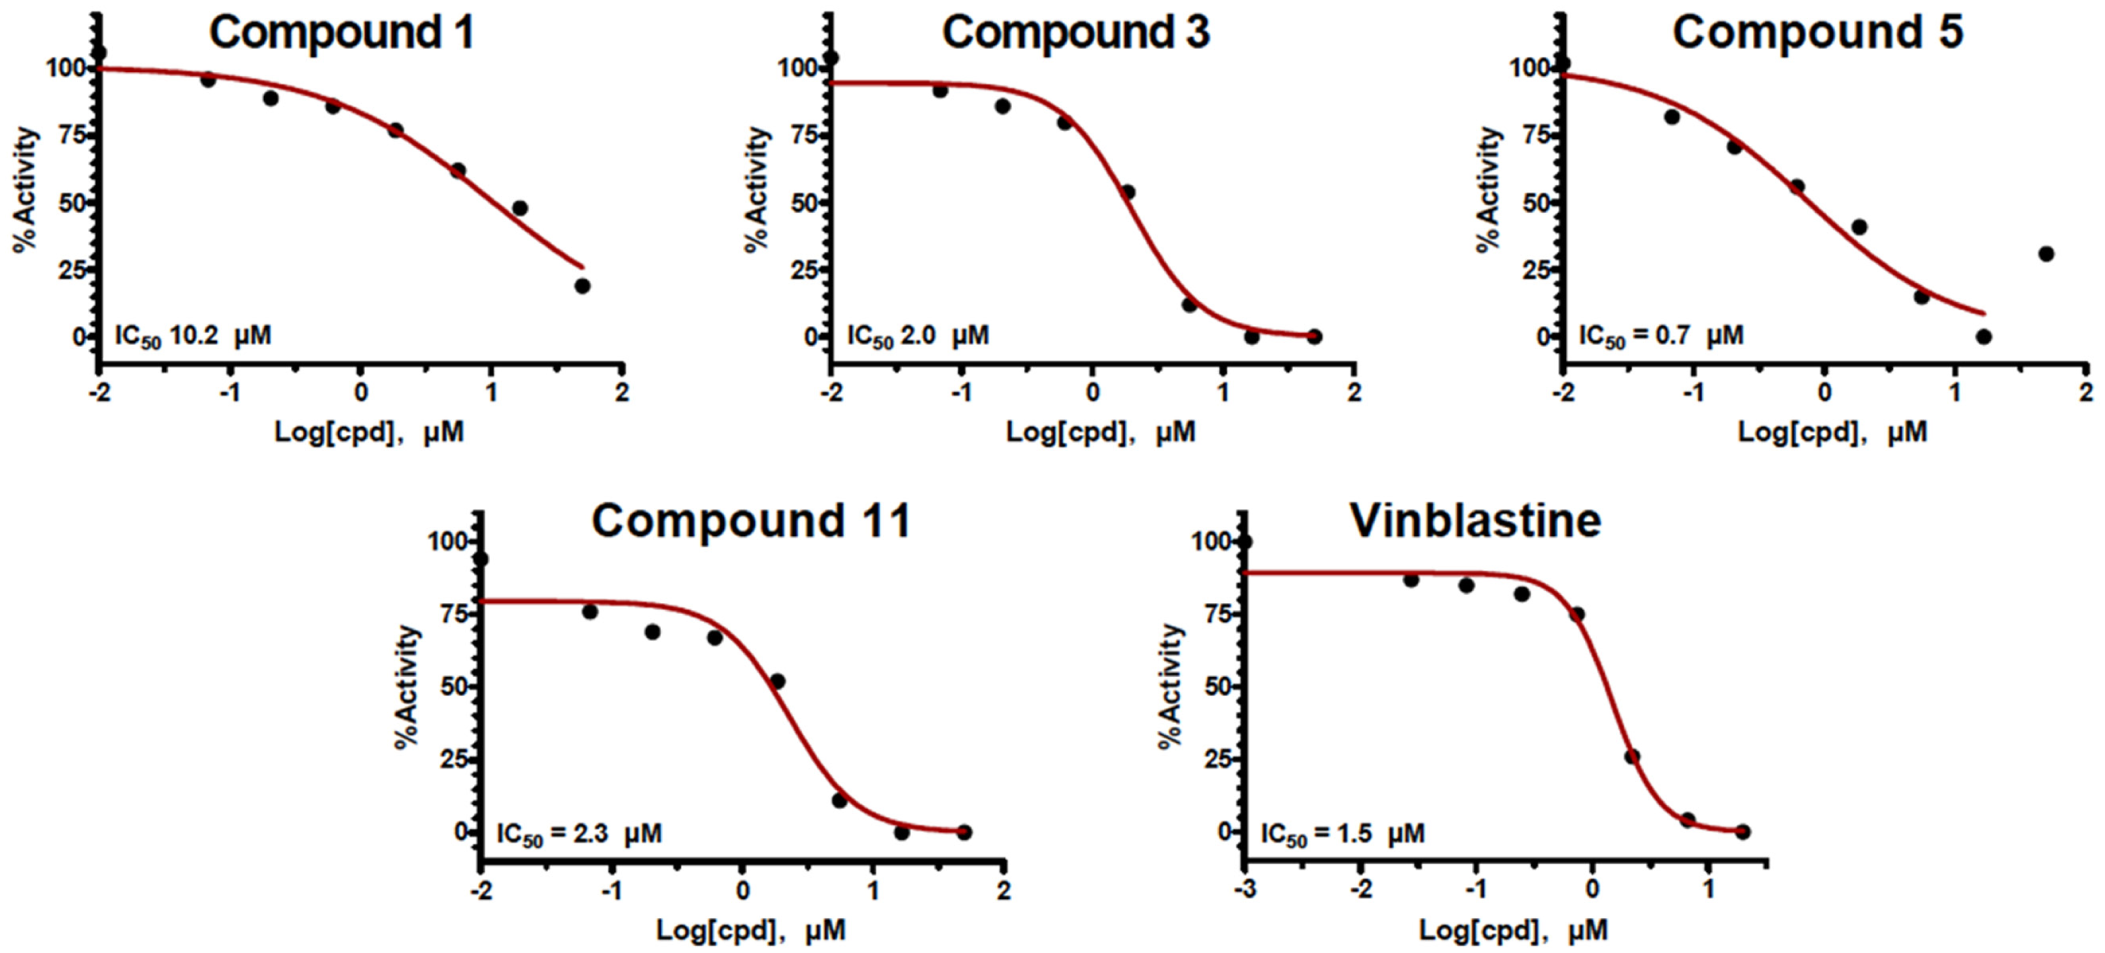
Biochemical activity: inhibition of microtubule polymerization. The maximal rate of microtubule polymerization in biochemical assays for different concentrations of each indicated compound is plotted. IC50 values for each compound are calculated from the fitted data curve (red).
Pharmacology
We next sought to determine the pharmacology of compounds identified in screening. Acute toxicity was determined by administering intraperitoneal injections of this compound to mice at a series of doses. Mice were observed for 2 weeks, including the monitoring of body weight. No toxicity, including significant weight loss, was observed for any of the three compounds tested, even at the highest tested dose of 400 mg/kg.
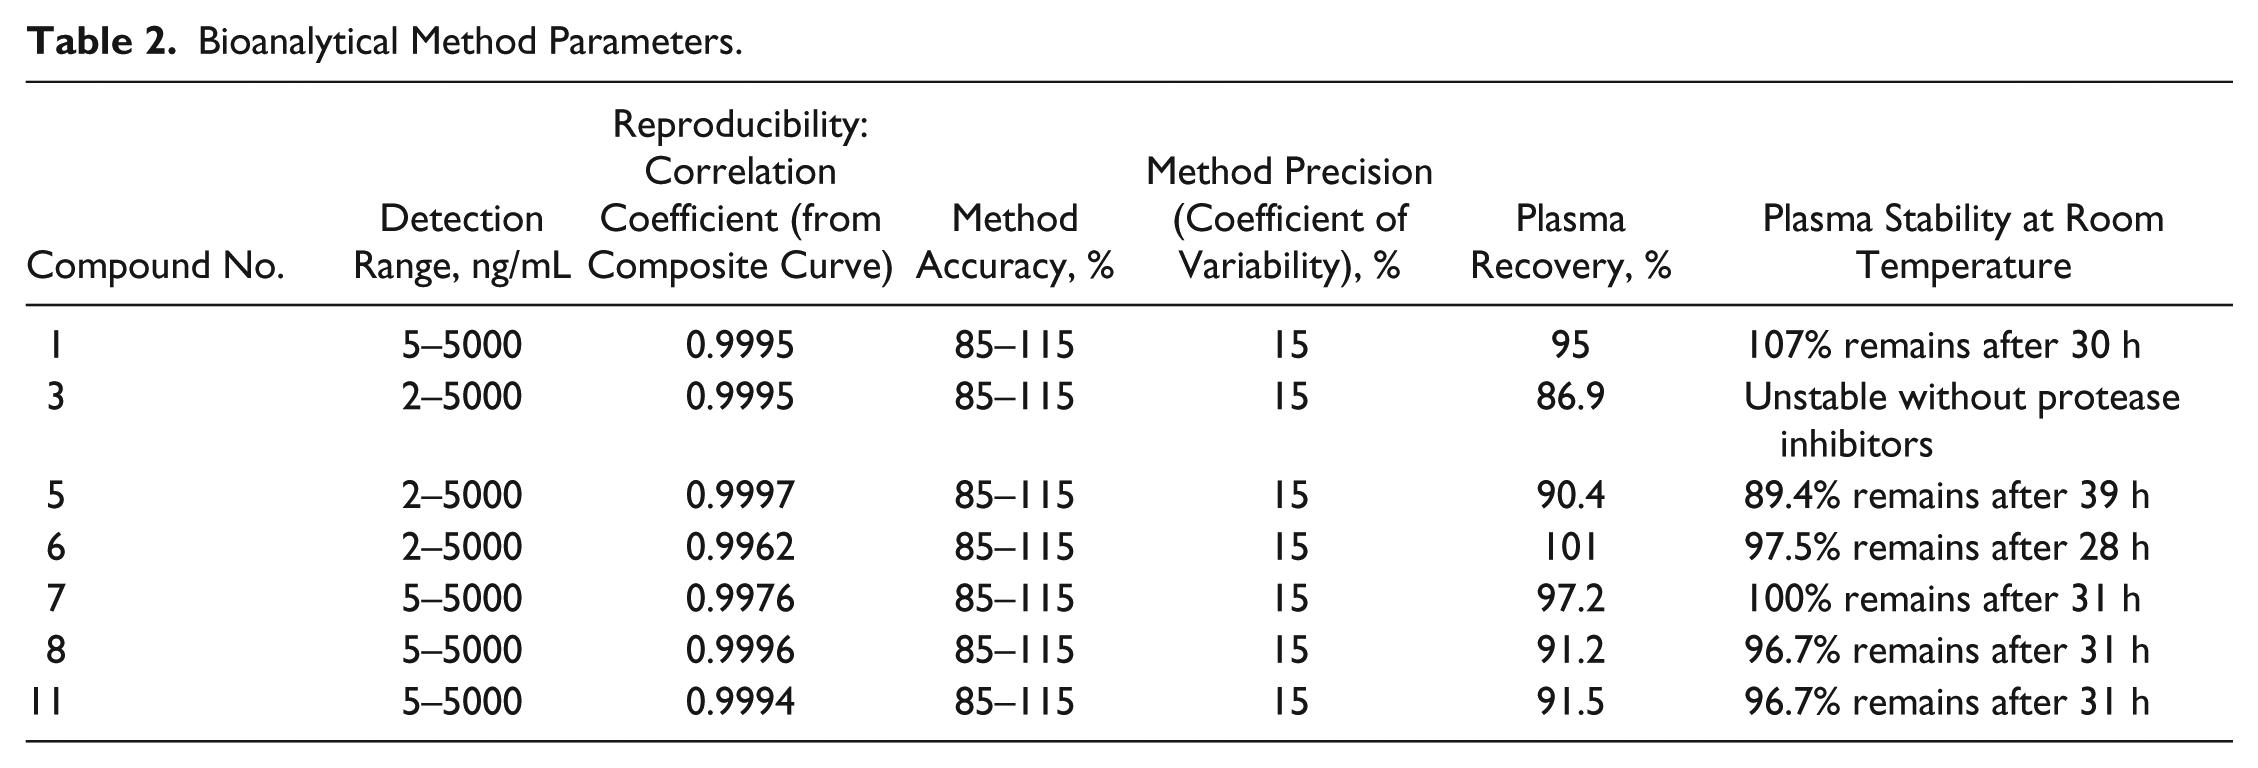
Our next effort was to determine their plasma stability and pharmacokinetic profile. We first developed an extraction method based on protein precipitation with acetonitrile to recover each compound from biological samples. We then developed a bioanalytical method using LC-MS/MS to determine compound concentrations using internal standard quantitation, the parameters of which are listed in Table 2 for each compound. With bioanalytical methods in place, we determined the pharmacokinetic profiles of these compounds. Mice were injected with compound and plasma levels determined at several time points following injection. Where possible, we used intravenous injections (compounds 1, 7, and 8), but poor solubility forced us to rely on intraperitoneal injections for most compounds. Not surprisingly, the pharmacokinetics of the compounds differed significantly, both in bioavailability following injection and in the persistence of compound in circulation. A number of compounds showed very limited bioavailability. The exceptions were compounds 6, 7, and 11, which achieved biologically relevant plasma levels that persisted at detectable levels until 8 or 24 h after injection, respectively, although the rate of clearance of compound 7 was very fast ( Fig. 4A ).
Bioanalytical Method Parameters.
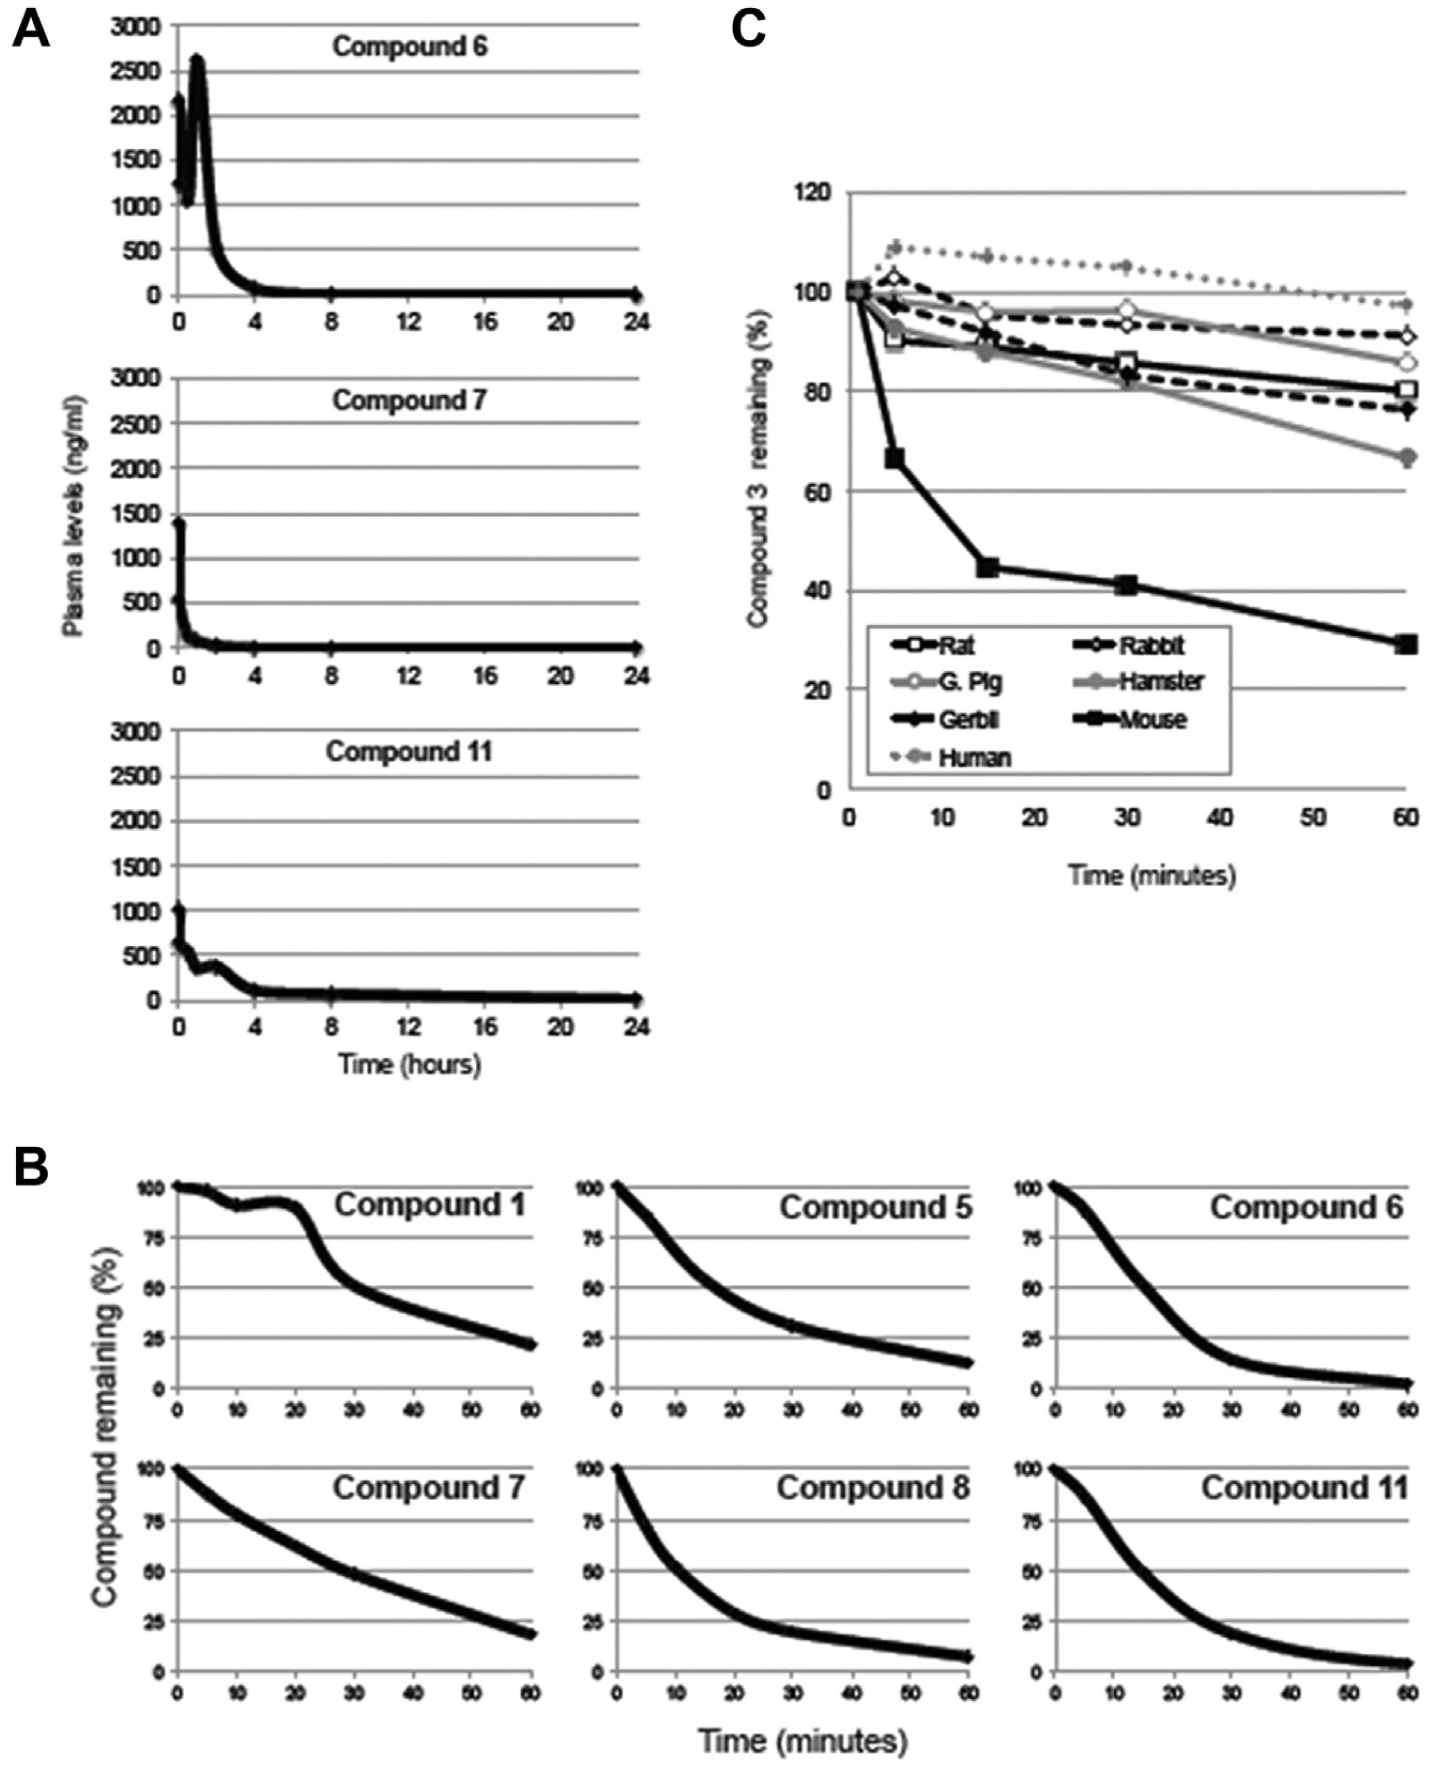
Pharmacokinetics and metabolism. (
Given the rapid clearance of a number of compounds, we examined their stability when incubated with liver microsomes. All compounds experienced metabolism, with ~20% or less remaining after 1 h of incubation in human liver microsomes in all cases ( Fig. 4B ). Compound 1 was the most stable, although significant amounts of irreversible binding to protein in liver microsomes were observed for compound 5 and might account for some of its depletion in this assay.
We also sought to better understand the instability of compound 3 in plasma. Metabolism resulted from cleavage of the nitrogen-nitrogen bond of the linker region of compound 3, and we found that protease inhibitors prevented plasma instability (data not shown) and sought to examine the stability of this compound in plasma from different species. In contrast to the rapid metabolism observed in mouse plasma, greater stability was observed in other species tested, with the highest stability observed in humans ( Fig. 4C ). Given the high plasma stability of this molecule in rabbits, we therefore sought to examine the pharmacokinetics of compound 3 in rabbits. Analysis of plasma levels after intraperitoneal injection shows that bioavailability was very low for this compound, never exceeding plasma concentrations of 100 ng/mL at any time point following administration.
Discussion
The HGF pathway is clearly associated with cancer progression, and developing agents that target HGF, its receptor, or downstream signaling has been the subject of therapeutic interest for some time. 3 Here we report the identity of a series of small molecules that inhibit HGF-induced epithelial scattering discovered in phenotypic screening. The compounds represent seven clearly distinct scaffolds.
Given that microtubule targeting agents are active in this assay, 5 it is not surprising that these compounds are antiproliferative in a broad array of cancer cell lines and that, with the exception of compound 5, they generally induce cell cycle arrest in G2/M with minimal immediate apoptosis. Biochemical assays using purified tubulin reveal that compounds, excepting 6 and 8, directly inhibit microtubule polymerization, suggesting that they bind and sequester tubulin dimers, although any effect of compound 1 appears to be quite weak. That compound 5 directly targets microtubule polymerization without inducing cell cycle arrest in G2/M suggests polypharmacology or significant off-target effects, resulting in pleiotropic effects in cell culture assays. Similarly, additional effects besides G2/M arrest seen by flow cytometry of DNA-stained cells suggest that compounds 1, 3, and 7 may have additional effects on cells besides those that may be attributed from inhibition of microtubule polymerization alone. Compounds 6, 8, and 11 have the clearest effects on the distribution of treated cells through the cell cycle, which suggests the highest degree of selectivity, but only compound 11 targets the microtubule cytoskeleton. Whether compounds 6 and 8 affect microtubules indirectly or whether these compounds generate G2/M arrest by a completely different mechanism and an unrelated target remains to be seen.
A key point here is that molecules that bear activity in preventing microtubule polymerization also prevent HGF-induced epithelial scattering, the basis of the screening assay used to identify these molecules. Importantly, this cellular assay was performed at high confluence that minimizes cell proliferation, suggesting that disruption of the microtubule cytoskeleton is blocking scattering another way. One way is by limiting cell migration in cells without an intact microtubule cytoskeleton. Our prior work suggests that disruption of the microtubule cytoskeleton might also limit critical vesicle trafficking steps necessary to enact cell behavior changes initiated by HGF stimulation, including influxes of calcium into the cell. 4 Regardless, the identification of microtubule targeting agents with high frequency in our phenotypic screen demonstrates a critical role for microtubules in ways that are independent of their role in mitosis. Given the large number of microtubule targeting agents revealed in this screen, we suggest that compounds 6 and 8 also generate G2/M arrest by targeting microtubules, although through a mechanism that is not direct.
While not a major focus of this work, we also present information showing some drug-like properties and pharmacology of the compounds identified in screening. Most compounds have poor pharmacokinetics and are subjected to significant metabolism. Efforts to optimize these molecules in any way must include those directed toward improving these properties and not only increasing potency.
In summary, we report novel biological activities, as inhibitors of microtubule polymerization, for a series of compounds identified in a screen for inhibitors of HGF-induced epithelial scattering. This mechanism of action highlights a growing role for microtubules in epithelial morphogenesis.
Footnotes
Declaration of Conflicting Interests
The authors declared no potential conflicts of interest with respect to the research, authorship, and/or publication of this article.
Funding
The authors disclosed receipt of the following financial support for the research, authorship, and/or publication of this article: J.B. was supported by a BYU Cancer Center summer undergraduate research internship.
References
Supplementary Material
Please find the following supplemental material available below.
For Open Access articles published under a Creative Commons License, all supplemental material carries the same license as the article it is associated with.
For non-Open Access articles published, all supplemental material carries a non-exclusive license, and permission requests for re-use of supplemental material or any part of supplemental material shall be sent directly to the copyright owner as specified in the copyright notice associated with the article.