
Abstract
Many screening hits show relatively poor quality regarding later efficacy and safety. Therefore, small-molecule screening efforts shift toward high-content analysis providing more detailed information. Here, we describe a novel screening approach to identify cell cycle modulators with low toxicity by combining the Cell Cycle Chromobody (CCC) technology with the CytoTox-Glo (CTG) cytotoxicity assay. The CCC technology employs intracellularly functional single-domain antibodies coupled to a fluorescent protein (chromobodies) to visualize the cell cycle–dependent redistribution of the proliferating cell nuclear antigen (PCNA) in living cells. This image-based cell cycle analysis was combined with determination of dead-cell protease activity in cell culture supernatants by the CTG assay. We adopted this multiplex approach to high-throughput format and screened 960 Food and Drug Administration (FDA)–approved drugs. By this, we identified nontoxic compounds, which modulate different cell cycle stages, and validated selected hits in diverse cell lines stably expressing CCC. Additionally, we independently validated these hits by flow cytometry as the current state-of-the-art format for cell cycle analysis. This study demonstrates that CCC imaging is a versatile high-content screening approach to identify cell cycle modulators, which can be multiplexed with cytotoxicity assays for early elimination of toxic compounds during screening.
Introduction
The control of cell proliferation is a highly regulated process in any dividing cell and central to tissue morphogenesis during the development of multicellular organisms. 1 The cell cycle is classically described as four sequential phases (G1, S, G2, and M phase). 2 DNA synthesis (S phase) is followed by segregation of the duplicated chromosomes into the two daughter cells during mitosis (M phase). During the two interphases (G1 and G2) the cells grow, while G2 additionally includes the premitotic break after completion of the S phase. The proliferating cell nuclear antigen (PCNA) forms a closed ringlike structure that encircles DNA and has an essential role as a processivity factor for DNA replication within the S phase, providing multifaceted interaction surfaces for factors involved in DNA replication, repair, chromatin dynamics, and cell cycle regulation.3,4 While PCNA clearly localizes at replication foci that undergo characteristic morphological changes throughout the S phase, it is diffusely distributed within the nucleus in G2, M, and G1. 5 Therefore, visualization and analysis of the dynamic redistribution of endogenous PCNA allows a reliable determination of distinct cell cycle phases in living cells.
Deregulation of cell proliferation is a hallmark of cancer. 6 In this context, the discovery and development of druglike molecules that block cancer-related cell cycle progression is highly relevant. Moreover, novel inhibitors can be used as molecular probes in chemical genetics approaches7,8 to dissect the functions of proteins that are critical for cell cycle progression and could thereby give further information on target–disease relations. Consequently, the identification of small molecules that modulate or block the cell cycle without secondary cytotoxicity presumably provides the basis for a better understanding of the complex regulation of cell proliferation or could even be further developed to novel therapeutics. Hence, to identify appropriate compounds, novel high-throughput assay technologies for adherent cells need to be developed that reliably quantify cell populations of various phases of the cell cycle upon compound treatment. However, the availability of automated technologies that increase the throughput of complex cell-based assays with multiparametric cell cycle readouts is still a limiting obstacle for many screening campaigns. State-of-the-art technologies like the classical propidium iodide (PI) staining 9 approach is a low/mid-throughput method that either uses suspension cells or needs detachment of adherent cells, which reduces the throughput. Hence, we aimed to establish a multiplexed assay that (1) provides a quick and accurate determination of the cell cycle status of individual cells in a high-throughput manner and (2) identifies early cytotoxic effects of small-molecule treatment.
We utilized a novel high-content imaging approach that visualizes the dynamic redistribution of endogenous PCNA in living cells. It is based on a Cell Cycle Chromobody (CCC) cell line (HeLa-CCC), which employs stable expression of an intracellularly functional single-domain antibody fused to TagRFP, the so-called PCNA-chromobody. The PCNA-chromobody recognizes and outlines the distribution of endogenous PCNA without disturbing its function. Recently, it has been successfully applied in cell cycle analysis on the single-cell level as well as in whole organisms.10,11
To distinguish the effect of compound treatment on cell cycle from general cytotoxic effects, we combined our image-based approach with the CytoTox-Glo (CTG) technology. 12 The latter assay uses a luminogenic peptide substrate to measure dead-cell protease activity, which is released from cells that have lost membrane integrity classified as a hallmark of cytotoxicity. Hence, we developed a two-step protocol for determining dead-cell protease in the supernatant before imaging and analyzing the nuclear Hoechst intensity and PCNA distribution of single cells. To demonstrate the feasibility of this approach, we adopted the assay to a high-throughput format and screened 960 Food and Drug Administration (FDA)–approved drugs of the Prestwick Chemical Library as a starting point. By this, we identified a set of nontoxic small molecules blocking the cell cycle at different stages. We confirmed the identified compounds in the original HeLa cell line and additionally used prostate cancer–derived PC3 cells stably expressing the PCNA-chromobody. Both settings confirm the results of the primary screening. Finally, we verified the data with parental HeLa as well as U2OS cells in an independent PI staining assay by flow cytometry. In summary, the results clearly demonstrate that this novel multiparametric screening system can detect compounds with specific cell cycle modulating effects and provides additional information on early cytotoxicity during primary screening in different disease-relevant cell types. Thus, the CCC approach described in this study will be a versatile and reliable tool for future screening of larger compound libraries to identify novel cell cycle modulators.
Material and Methods
Cell Culture
Adherent HeLa-CCC-TagRFP (ChromoTek), HeLa cells (ATCC), and U2OS cells (ATCC) were maintained in DMEM growth medium containing 4.5 g/L
Generation of the Stable PC3-CCC-TagRFP Cell Line
The sequence coding for the Cell Cycle Chromobody was transferred into pLenti6/V5-DEST by Gateway recombination and lentiviral particles were produced using Virapower lentiviral packaging mix according to the manufacturer’s protocols (Invitrogen, Grand Island, NY) with a yield of ~5 × 10⁷ transducing units per milliliter. Twenty-four hours after transduction, PC3 cells (ATCC) were subjected to a 2-week selection period with 3 µg/mL blasticidin S. From the polyclonal population, individual cells were separated for the generation of the monoclonal PC3-CCC-TagRFP cell line.
CytoTox-Glo Assay
Cell viability was determined using CytoTox-Glo (G9290, Promega, Mannheim, Germany). This assay measures the dead-cell protease activity, which is released from cells that have lost membrane integrity. The assay uses a luminogenic peptide substrate (alanyl-alanyl-phenylalanyl-aminoluciferin, AAF-Glo Substrate) to measure dead-cell protease activity. Cells were seeded before treatment in black poly-
Small Molecules and Other Reagents
The diverse small-molecule library used for this study contained 960 compounds that are 100% approved drugs (FDA, European Medicines Agency [EMA], and other agencies) (Prestwick Chemical). The purity of the compounds was >90% as reported by the provider of the compounds. Reordered compounds were delivered as dry powder and dissolved in DMSO to 20 mM stock solutions. Mebendazole was purchased from Santa Cruz Biotechnology (Dallas, TX) and camptothecin from Enzo Life Sciences (Farmingdale, NY). Cladribine and vinblastine were ordered from Cayman Chemical (Ann Arbor, MI). Niclosamide, aphidicolin, and nocodazole were obtained from Sigma-Aldrich (Taufkirchen, Germany). Digitonin was provided together with the CytoTox-Glo Kit (G9290, Promega).
Automation
Plate and liquid handling was performed using a high-throughput screening platform system composed of a Sciclone G3 Liquid Handler from PerkinElmer with a Mitsubishi robotic arm (Mitsubishi Electric, RV-3S11), a MultiFlo Dispenser (Biotek Instruments, Bad Friedrichshall, Germany), and a Cytomat Incubator (Thermo Fisher Scientific). 13 Cell seeding and assays were performed in black 384-well CellCarrier plates (6007558, PerkinElmer). CytoTox-Glo measurements were performed using an EnVision Multilabel Reader (PerkinElmer). Image acquisition and image-based quantification were performed using an Operetta/Columbus high-content imaging platform (PerkinElmer).
Assay Robustness Analysis
For assay quality control, Hela-CCC cells were seeded in precoated 384-well plates (384-well CellCarrier, PerkinElmer) at 1250 cells per well in 50 µL. Twenty-four hours after seeding, cells were treated with DMSO or control substances (15 µM aphidicolin, 2 µM camptothecin, or 3 µM Nocodazole). Control substances resulted in cell cycle arrest in specific phases (aphidicolin, G phase arrest; camptothecin, S phase arrest; nocodazole, M phase arrest). Twenty-four hours later, cells were fixed and stained with Hoechst for image acquisition and analysis (please see separate Image Analysis section) in order to determine the assay Z′ value.
Z′ factors were calculated according to the formula 14 Z′ = 1 – (3(θ p + θ n )/(µ p – µ n )), where p is the positive control, n is the negative control, θ is the standard deviation, and µ is the mean.
High-Content Screening Assay
For the screening, Hela-CCC cells were washed with phosphate-buffered saline (PBS), trypsinized, and resu-spended in cell culture medium. The cell suspension (1250 cells in 50 µL per well) was dispensed into poly-
Image Analysis
Multiparametric image analysis was performed using Columbus Software 2.5 (PerkinElmer). The Hoechst signal was used to detect all cell nuclei and discover cells in the M phase. The chromobody signal was used to determine the two other cell cycle stages (G and S phases). In the G phase, the red fluorescence protein (RFP) signal is homogeneously distributed throughout the nucleus and cytoplasm, whereas during the S phase it accumulates in the nucleus and visualizes the formation of replication foci. In the following, the precise analysis steps in Columbus are described. Nuclei were detected via the Hoechst signal using Method C of Columbus software with the following specific parameters: common threshold (parameter determining the lower level of pixel intensity for the whole image that may belong to nuclei), 0.40; area (to tune the merging and splitting of nuclei during nuclei detection), >60 µm²; split factor (parameter influencing the decision of the computer whether a large object is split into two or more smaller objects or not), 7.0; individual threshold (parameter determining the intensity threshold for each object individually), 0.2; and contrast (parameter setting a lower threshold to the contrast of detected nuclei), 0.2. Method C to find nuclei provides good results for images with low background or with size variations of nuclei and supports images with large variations in intensity or contrast of nuclei.
In a next step, the border objects were removed from the selected output population “Nuclei.” Remove border objects is a common filter that recognizes and removes nuclei that cross image borders. For this subpopulation called “Nuclei selected,” the mean intensity of the Hoechst signal was calculated using the building block “Calculate Intensity Properties” (mean per nuclei). Second, the building block “Calculate Morphology Properties” was used to calculate the nucleus areas of all selected nuclei (µm2). The building block “Find spots” was used to detect PCNA spots in cell nuclei. Each spot was detected as a small region within the corresponding image by having a higher intensity than its surrounding area. For our analysis, we chose Method D. The following second-level input parameters available in Method D were used: detection sensitivity (determines how intense a spot must be to be detected), 0.5; splitting coefficient (responsible for split-or-merge decisions), 0.5; and background correction (responsible for an adequate estimation and subtraction of the background), 0.5.
In the last step, we defined our three output populations using these calculated properties as filters:
S phase cells: ≥3 spots per nucleus
M phase cells: nucleus area <250 µm2 and Hoechst intensity ≥3200
G phase cells: <3 spots and Hoechst intensity <3200
An illustration and workflow on the automated detection method for cell cycle stages using the Hoechst and CCC-TagRFP signal is presented in Figure 3 .
EdU and Phosphohistone H3 (pH3) Staining for Verification of Image Analysis
EdU treatment (Alexa 488) at a final concentration of 25 µM was performed 30 min before fixation. Staining was done according to the manufacturer’s protocol (Click-iT EdU HCS Assays, Thermo Fisher Scientific). For staining with anti-pH3 antibody, cells were permeabilized with 0.3% Triton in PBS after fixation. After blocking with 1% bovine serum albumin (BSA), cells were incubated with primary anti-pH3 antibody (cell signaling, dilution 1:400) for 2 h on a shaker. After washing, cells were incubated with secondary antibody (anti-mouse antibody Alexa 647, Molecular Probes, Eugene, OR; dilution 1:500) for 1 h in the dark. Cells were imaged on the Operetta High-Content imaging device and analyzed using the Columbus software.
Hit Confirmation Assays
The HeLa-CCC-TagRFP secondary assay was used as the first confirmation assay, with the procedure identical to that during the primary screening. In addition, the cell line PC3-CCC-TagRFP was taken as a second confirmation assay. Twenty-five hundred PC3-CCC-TagRFP cells per well were plated in black µClear 96-well plates (Greiner, Frickenhausen, Germany). Twenty-four hours after plating, cells were either left untreated or incubated with compounds (n = 4). Compound concentration (10 µM) was used for mebendazole and cladribine in both cell lines. As PC3-CCC-TagRFP cells treated with 10 µM niclosamide displayed significant apoptosis (dead cells) (data not shown), we chose 1 µM niclosamide treatment as the ideal concentration with already clear activity. Twenty-four hours later, images of living cells were acquired with an Image Xpress Micro XL system and analyzed by MetaXpress software (64 bit, 5.1.0.41). Several images were acquired for each condition comprising a statistically relevant number of cells (~500). Cells were phenotypically classified based on the PCNA pattern and the nuclear morphology, giving rise to the percentage of cells in the distinct cell cycle stages. Standard errors were calculated for three biological replicates.
Secondary Validation Assay: Cell Cycle Analysis by Flow Cytometry Using Propidium Iodide Staining
HeLa or U2OS cells (1 × 10⁵) were seeded in six well plates. The following day, cells were treated with different compounds (final concentration of 10 µM) or DMSO for 24 h. Cells were then trypsinized and washed with PBS. Subsequently, cells were fixed with cold 70% ethanol and incubated for a minimum of 2 h on ice. After washing with PBS, cells were resuspended in PI staining solution (20 g/mL PI, Cayman Chemical; 200 µg/mL RNase A; 0.1% Triton X-100) and incubated for 40 min at RT while keeping the reaction in the dark. Finally, cells were analyzed by flow cytometry (Attune Acoustic Focusing Cytometer, Applied Biosystems) using the FL-2 channel to detect the PI signal. Analysis of flow data was carried out using FlowJo software.
Results
Combination of CytoTox-Glo Cytotoxicity Assay and Chromobody-TagRFP Microscopy-Based Imaging
We utilized the HeLa–Cell Cycle Chromobody–TagRFP (HeLa-CCC) cell line for establishing a multiplexed assay together with the CytoTox-Glo (CTG) cytotoxicity assay, thereby measuring the activity of dead-cell protease in the supernatant of cells together with microscopy-based readouts giving information on the cell cycle status of the cell population. The first step was to find optimal readout parameters for both assays in a 384-well format. In order to identify the optimal number of cells per well that produces a robust luminescence signal in the dead-cell protease activity assay, different numbers of the HeLa-CCC cells were seeded in 384-well plates. On the next day, the luminescence signal of cells, which were either left untreated or incubated with digitonin, was measured (
Fig. 1A
). Digitonin is a detergent that effectively permeabilizes cell membranes.
15
Thus, treatment of cells with digitonin is expected to result in a maximum release of dead-cell protease to the supernatant and consequently should produce high signals in this type of assay. To identify the ideal cell number for the 384-well plate format, the screening parameters for each condition were calculated (
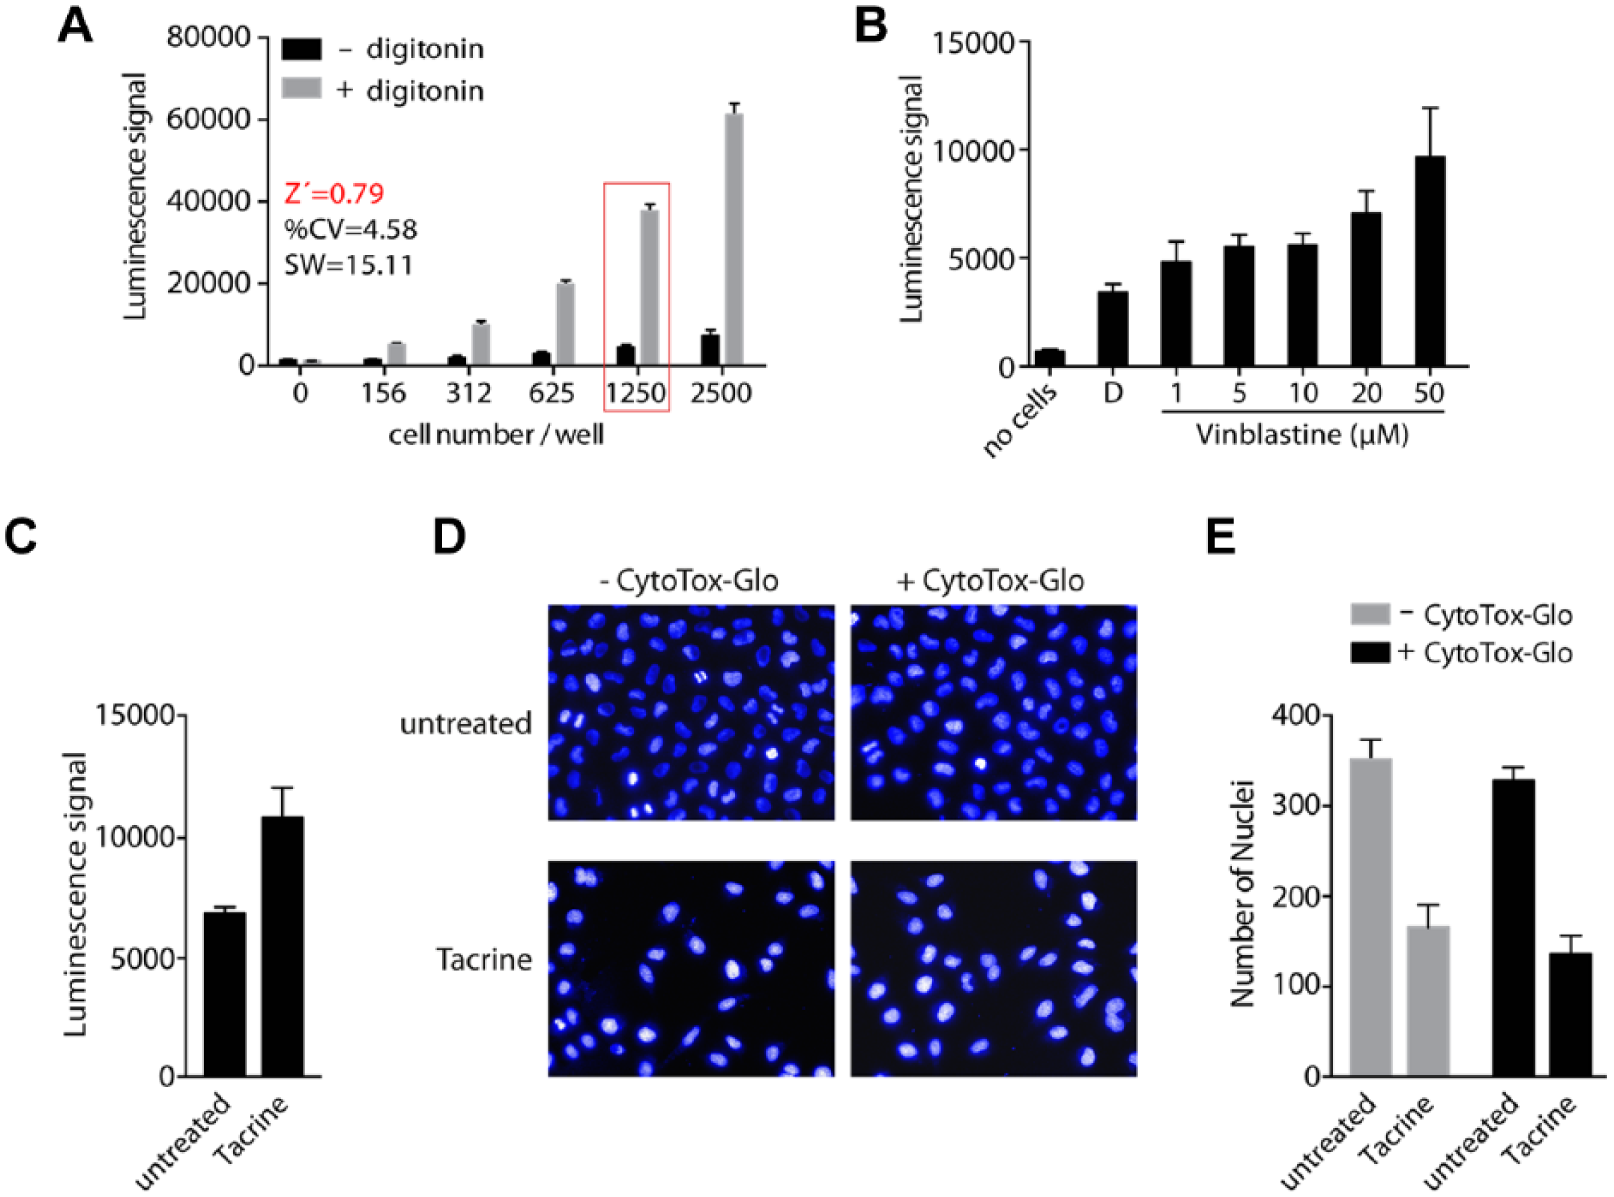
Combination of CytoTox-Glo (CTG) assay with microscopy-based readout. (
In the next step, we investigated the effect of the toxic anticancer drug vinblastine on our assay to mimic a more realistic screening scenario. 16 As expected, we could observe a dose-dependent increase in luminescence signal upon addition of vinblastine ( Fig. 1B ). Notably, the assay was set up in black clear-bottom plates as necessary for fluorescent microscopy without negatively influencing the CTG assay performance when compared to white plates (data not shown). For testing the combination of luminescence measurement and high-content imaging, we treated cells with a third toxic agent (tacrine 17 ) to prove general applicability of the cytotoxicity assay to various toxic agents and performed a stepwise procedure of measuring dead-cell protease activity and subsequently recording images by automated microscopy ( Fig. 1C–E ). Tacrine-treated cells showed an increase of luminescence signal compared to untreated cells, confirming the toxicity of the compound ( Fig. 1C ). After measurement of the protease activity, cells were stained with Hoechst and four fields per well were imaged in the Operetta HCS system. By detection of the nuclei we determined the cell number in each well and directly compared the influence of tacrine in the presence and absence of CTG reagent. The results show that treatment with tacrine has a toxic effect, shown by a reproducibly reduced cell number ( Fig. 1D , E ). Importantly, prior addition of CTG reagent and measurement of protease activity had no influence on the number of cells or the image quality ( Fig. 1D , E ). This aspect was highly relevant since transferring the supernatant into other assay plates for detection of protease activity would tremendously reduce throughput of the intended assay format.
Taken together, these data clearly demonstrate the correlation between increased luminescence signal and reduced nuclei count of tacrine-treated cells. Importantly, addition of CTG reagent to cells did not influence cell count, image quality, or staining intensities, providing the convenience to measure CTG activity and cell imaging within the same well for efficient multiplexing.
Establishment of an Image-Based Cell Cycle Detection Protocol for High-Content Screening
Next, our analysis was adapted to a more screening-relevant scenario. Instead of just examining the cell count, we took advantage of the HeLa-CCC cell line by detecting the distribution of PCNA within the cell. We could visualize the distribution of PCNA in individual cells (
Fig. 2A
) and develop our customized Columbus analysis protocol to identify cell nuclei and the pattern of PCNA, in addition to nuclear Hoechst intensity (
Fig. 3A
). We used this algorithm for automated detection and multiparametric image analysis to classify cell cycle phases. PCNA foci formation is a clear marker for the S phase, whereas diffuse PCNA staining in the nucleus indicates G phases (G1 and G2).
18
In contrast, nucleus condensation and high Hoechst intensity in the cell nucleus specifies a cell for the M phase. To determine a quality metric (Z′) for our HeLa-CCC assay, we used different molecules (aphidicolin, nocodazole, and camptothecin) that are well known to arrest cells in specific cell cycle phases. Aphidicolin is a DNA polymerase inhibitor and produces a cell cycle arrest in the G1/S phase.
19
In contrast, nocodazole is described as a substance that interferes with the polymerization of microtubules and therefore causes M phase arrest.
20
Finally, camptothecin acts as a topoisomerase I inhibitor and blocks the progression of the S phase into the G2 phase.
21
After treatment of cells for 24 h with the different control substances, we utilized our customized analysis protocol and defined the percentage of cells in the three different cell cycle phases. By combination of pairs of substances setting positive and negative controls, we were able to determine good Z′ values for the G (Z′ = 0.67), M (Z′ = 0.52), and S (Z′ = 0.65) phases, respectively (
Fig. 2C
). Importantly, we could also demonstrate the accuracy of our algorithm for S phase and M phase detection by costaining of the HeLa-CCC cells with EdU or phosphohistone H3 (pH3) (
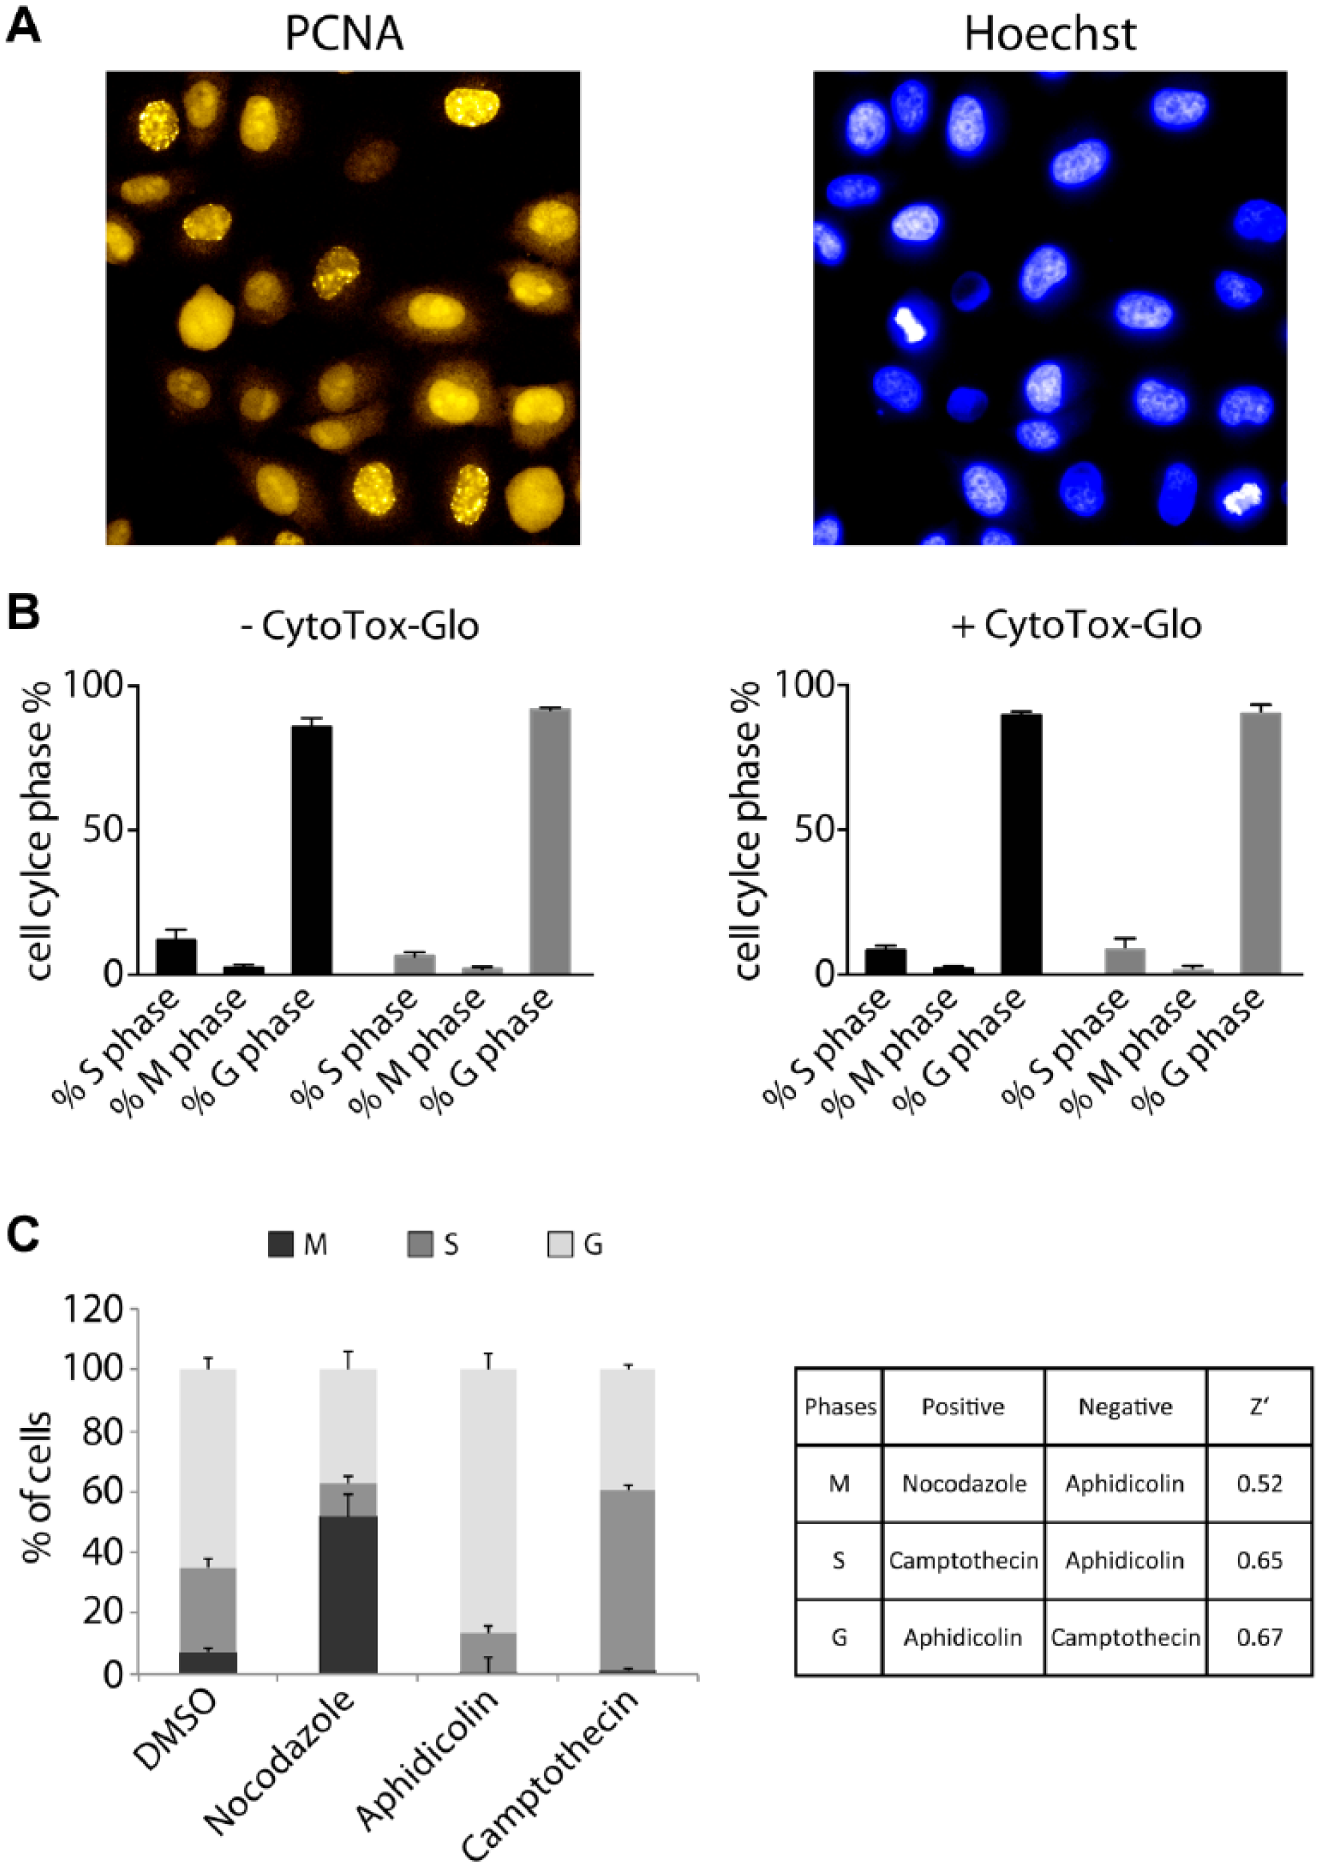
Detection of the cell cycle phases using HeLa-CCC cells. (
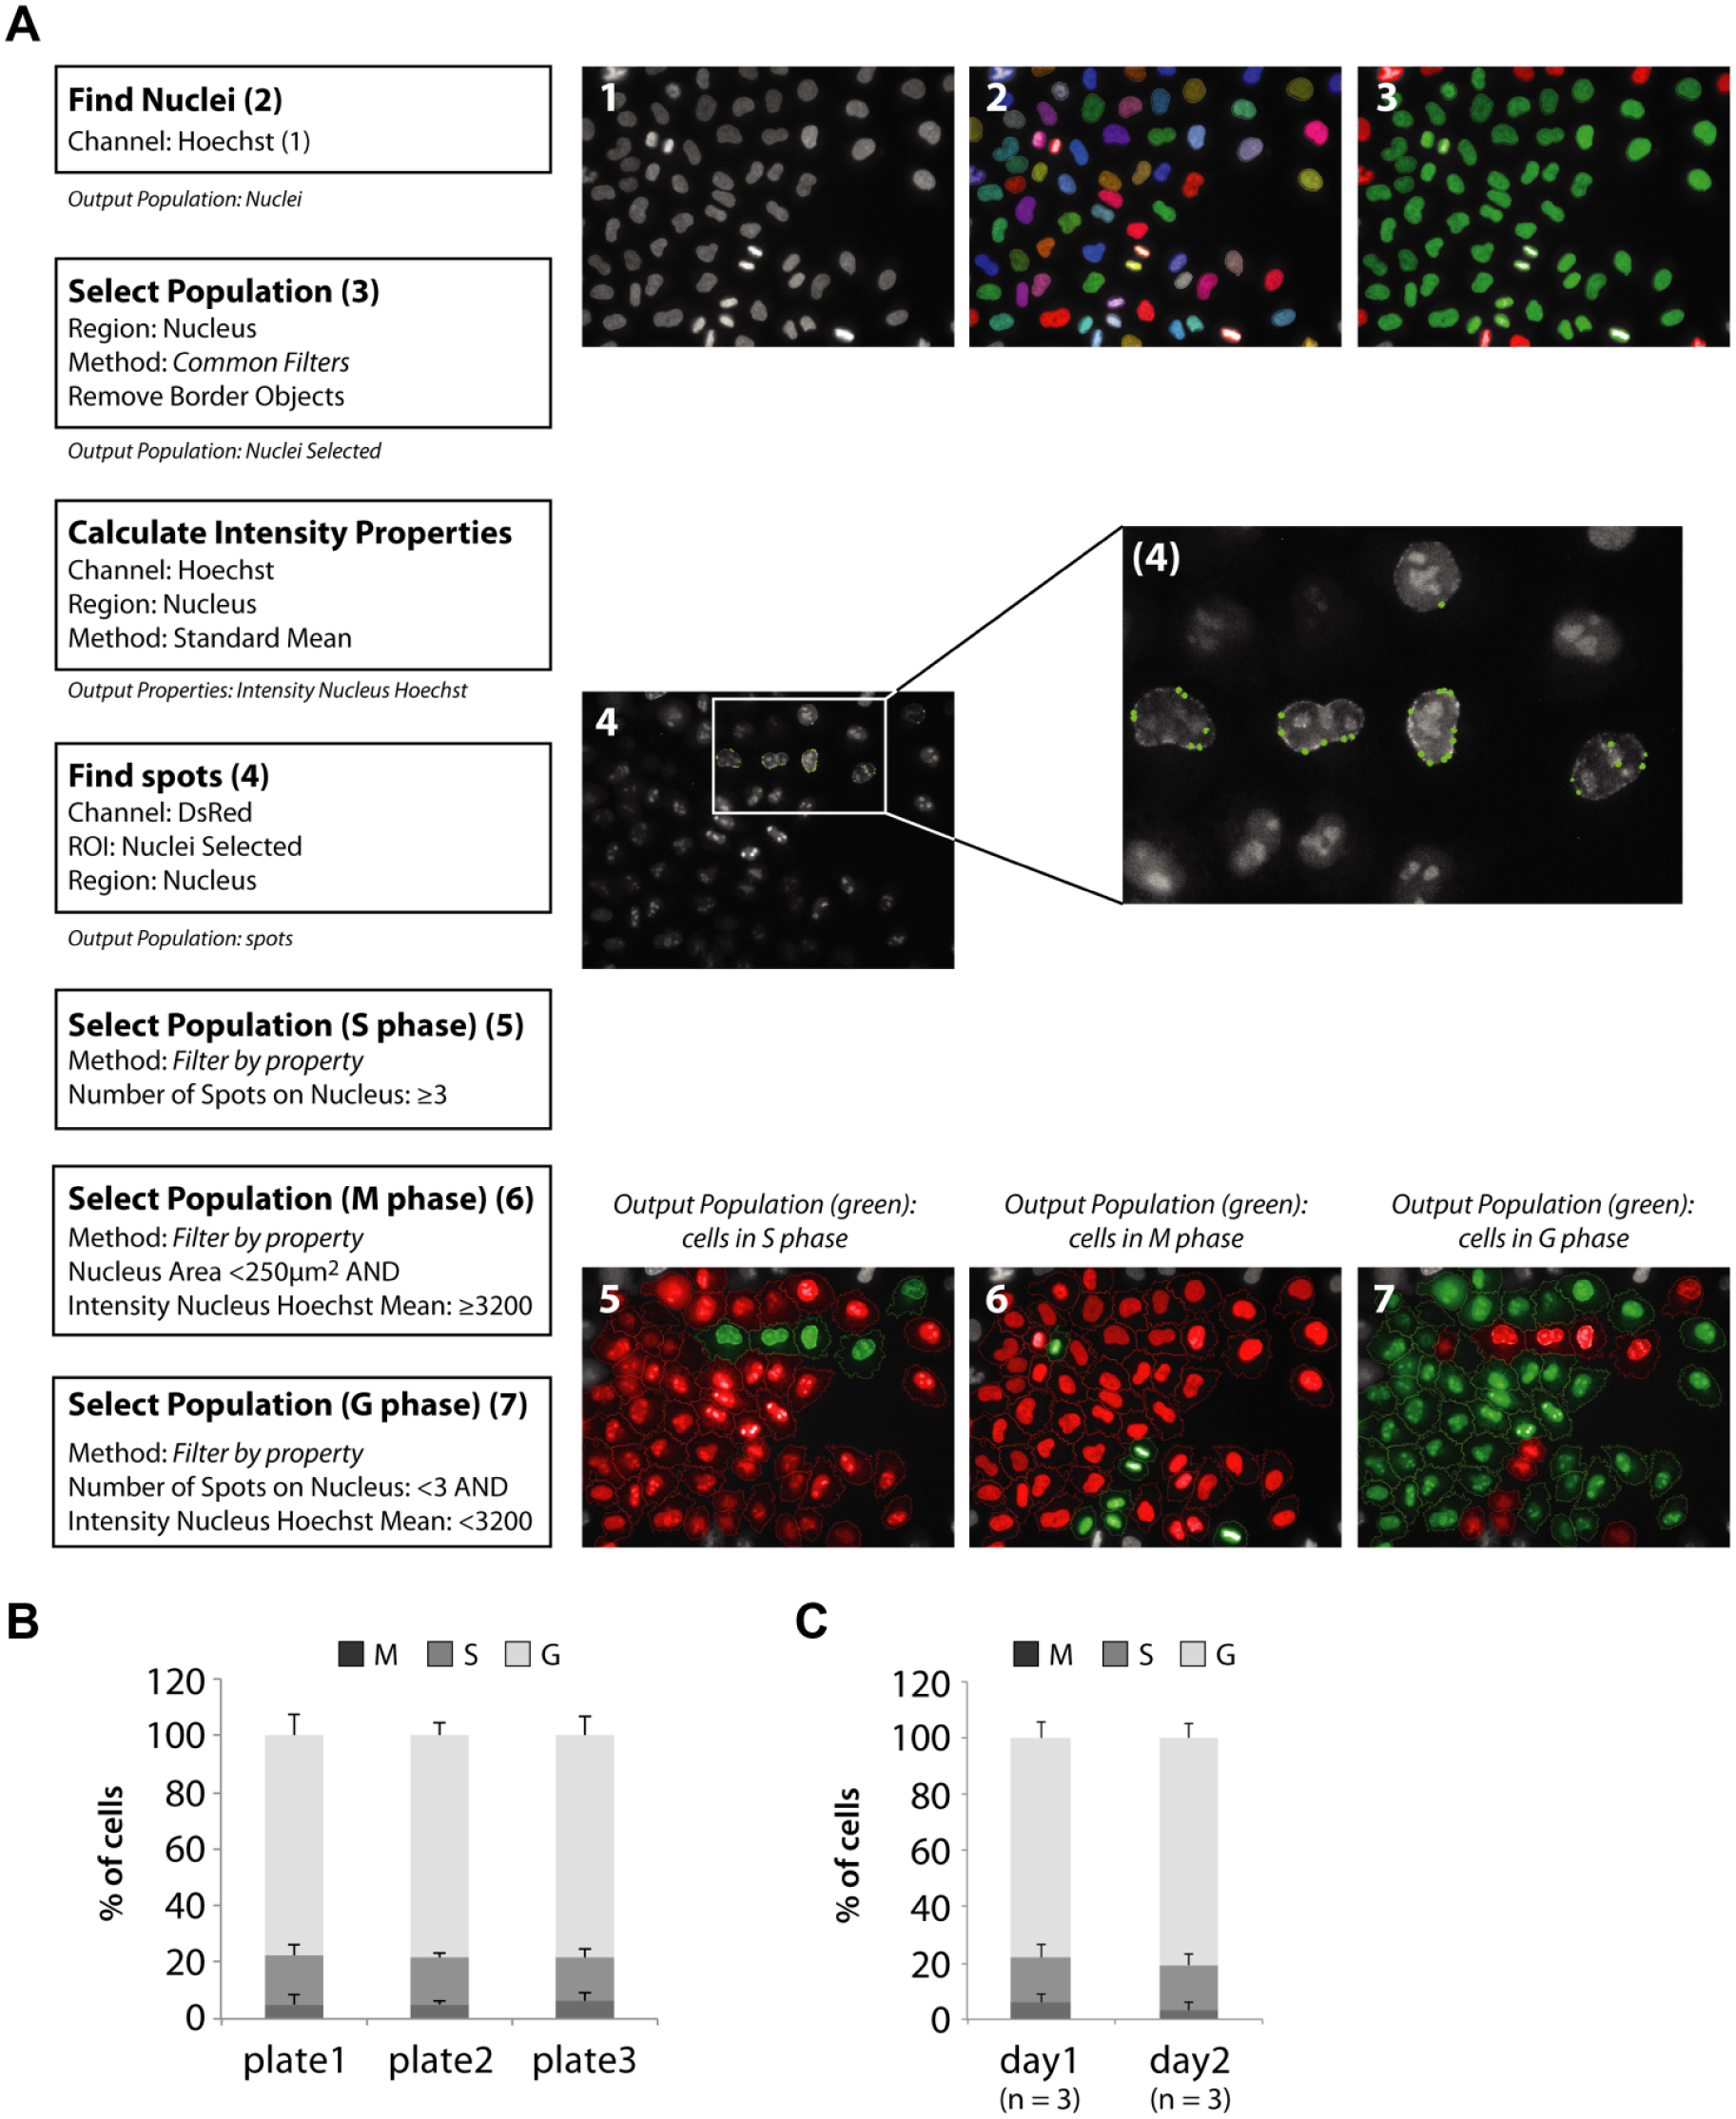
Image analysis for the detection of cell cycle phases. (
In summary, we have established a robust assay suitable for high-content screening campaigns with multiple image-based readout parameters per well that allows for the selection of compounds influencing cell cycle progression without having early secondary cytotoxicity.
Screening of 960 FDA-Approved Drugs
In a first screening, we intended to obtain important information about the performance and robustness of the established assay. We conducted a screening of the HeLa-CCC cell line against a library of FDA-approved drugs. Therefore, 1250 cells per well were seeded in 384-well plates and incubated for 24 h. Then, cells were treated with small-molecule compounds at a final concentration of 8 µM (n = 1, 0.8% DMSO) or with the control substances (aphidicolin or nocodazole) (each n = 12) and incubated for another 24 h. The cytotoxicity of all 960 compounds on HeLa-CCC cells was examined in parallel with the CTG assay. After measuring the luminescence signal and removing the supernatant, cells were fixed and subsequently stained with Hoechst. Finally, nuclear Hoechst stain (blue) and the PCNA-chromobody signal (red) were imaged (two images per well) using the automated Operetta high-content microscope. The adapted analysis allowed a systematic classification of each cell into the individual cell cycle phases (M, G, or S phase). Thereby we were able to calculate the percentage of cells in each cell cycle phase per well. The DMSO control resulted in a distribution of 3% cells in the M phase, 16% in the S phase, and 80% in the G phase, on average. According to the determined phenotypes induced by DMSO and the control substances aphidicolin and nocodazole, we are able to define cutoffs for each cell cycle phase. The cutoff definitions were (1) more than 13% of cells in the M phase (M phase hit), (2) more than 30% of cells in the S phase or less than 5% of cells in the S phase (S phase hit), and (3) more than 93% of cells in the G phase or less than 65% of cells in the G phase (G phase hit). The detailed workflow of image analysis is depicted in Figure 3A . With this strategy, we were able to generate a manifold data set consisting of cytotoxicity, nuclear count, and cell cycle distribution for all 960 compounds.
Our first selection process was aimed at the identification of small molecules with early secondary cytotoxicity that should be omitted in further analysis. Importantly, a low cell count could indicate two possible scenarios. It could mean either that a small molecule creates cytotoxic effects that lead to cell death or that compound treatment results in a cell cycle arrest. To distinguish between these two alternatives, we plotted the cell count against CTG signals of all DMSO (black dots, n = 48), nocodazole (orange dots, n = 48), aphidicolin (purple dots, n = 48), and 960 FDA drug-treated wells and were thereby able to classify three different populations ( Fig. 4 ). Compounds with increased CTG signal (>1800) were marked in gray and excluded from further cell cycle analysis and classified as “generally toxic.” The cutoff CTG signal >1800 was chosen as the bulk population of all CTG signals, including DMSO-, nocodazole-, and aphidicolin-treated cells was below this threshold. The population with low CTG signal (<1800) could be further split into two clusters: (1) the vital (blue, cell count >50) and (2) the group with low cell count (green, cell count <50). The threshold of 50 cells was selected based on the nocodazole control-treated cells. This control is known to induce a strong cell cycle arrest and in our conditions resulted in cell numbers below 50 cells per well ( Fig. 4 ). In total, the green population in Figure 4 may indicate compounds that generate cell cycle arrest.
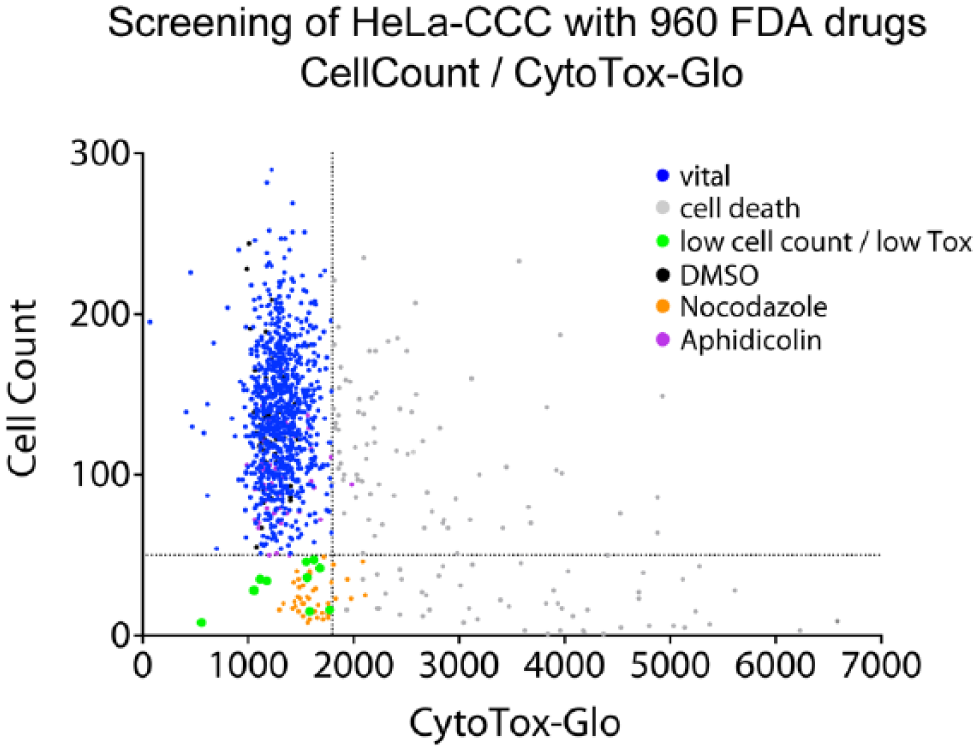
The output of a screening campaign with 960 FDA-approved drugs: first analysis step. Correlation of cell count and the CTG signal. Each dot represents the data of one compound in one well (n = 1). The main cluster is defined by the majority of compounds that show no increased CTG signal (CTG signal <1800). The DMSO (black dots), aphidicolin (purple dots), and nocodazole (orange dots) controls are within this population of nontoxic compounds. General cytotoxic compounds are marked in gray (CTG signal >1800). To calculate the cell number, two fields (117 fields cover the entire well) were taken randomly for each treatment. This resulted in a mean cell number of approximately 132 cells in control wells with DMSO (n = 48). The 48 control wells with nocodazole have a cell count less than 50 cells per well. Thus, compounds reducing the cell count to less than 50 cells per well were designated as compounds: “low cell count/low Tox” (green).
Next, we calculated the distribution of the cell cycle phases (percentage of cells in the G, M, and S phases) using the image analysis setup as described in Figure 3 . By plotting the percentage of cells (positive cells normalized to whole amount of selected nuclei) in the G ( Fig. 5A ), S ( Fig. 5B ), and M ( Fig. 5C ) phases individually against the CTG signal, each population with low cytotoxicity (<1800) could be subdivided into three clusters (low, normal, and high) on the basis of the boundaries present at the DMSO population (black dots, n = 48). DMSO-treated wells, as well as the bulk population (green dots, non-hits), appeared in each graph as a condensed cloud, giving us the opportunity to define the boundaries. As also described above, a dot that is located outside of the two boundaries indicates a shift in the cell cycle phase that is bigger than the DMSO spread. Notably, we identified cells treated with aphidicolin (purple) in the cluster of the high-percentage G phase ( Fig. 5A ), whereas the population of nocodazole-treated cells (orange) shifted more to the M phase ( Fig. 5C ).
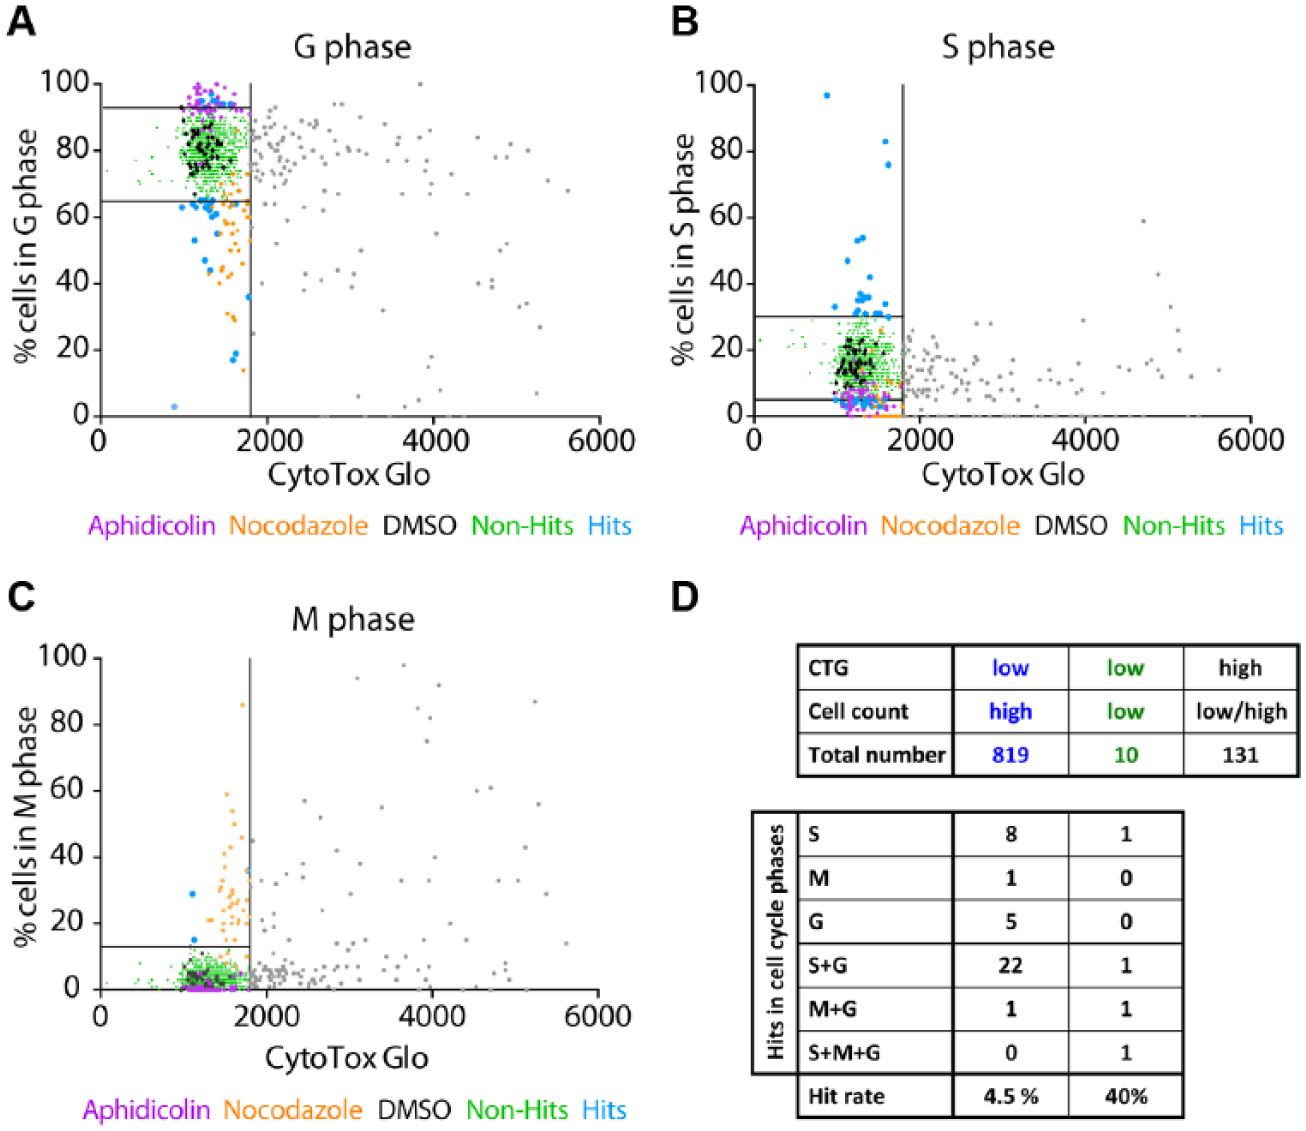
The output of a screening campaign with 960 FDA-approved drugs: second analysis step. Correlation of the results obtained by the CTG assay to percent cells in the (
Thus, the analysis of both control substances (aphidicolin and nocodazole) and DMSO within our microscopy-based HCS campaign demonstrated that the HeLa-CCC cell line is a versatile alternative for cell cycle studies to identify novel modulators, and that our classification strategy yielded an excellent output. Only a small number of compounds (blue dots) were classified as hits to arrest cells in the G, S, and M phases (
Fig. 5A–C
), representing interesting novel hit candidates of cell cycle modulation. In total, we identified 41 FDA-approved drugs that have an altered distribution of the cell cycle phases (
Fig. 5D
). Moreover, we characterized the two vital subpopulations (blue dots in
Fig. 4
) and “low cell count/low Tox” (green dots in
Fig. 4
). The vital population consists of 819 candidates overall, whereas the “low cell count/low Tox” subgroup is comprised of only 10 members (
Fig. 5D
). According to the changes in the cell cycle, by applying the same thresholds as described for
Figure 5A–C
, we could classify 37 hits out of the vital population, giving rise to a hit rate of 4.5%. Interestingly, four hits were defined out of the 10 “low cell count/low Tox” subpopulation (hit rate = 40%), thereby remarkably increasing the hit rate as a consequence of our multiplexed HCS-CTG screening approach (
Fig. 5D
and
Validation of Three Selected Hit Compounds
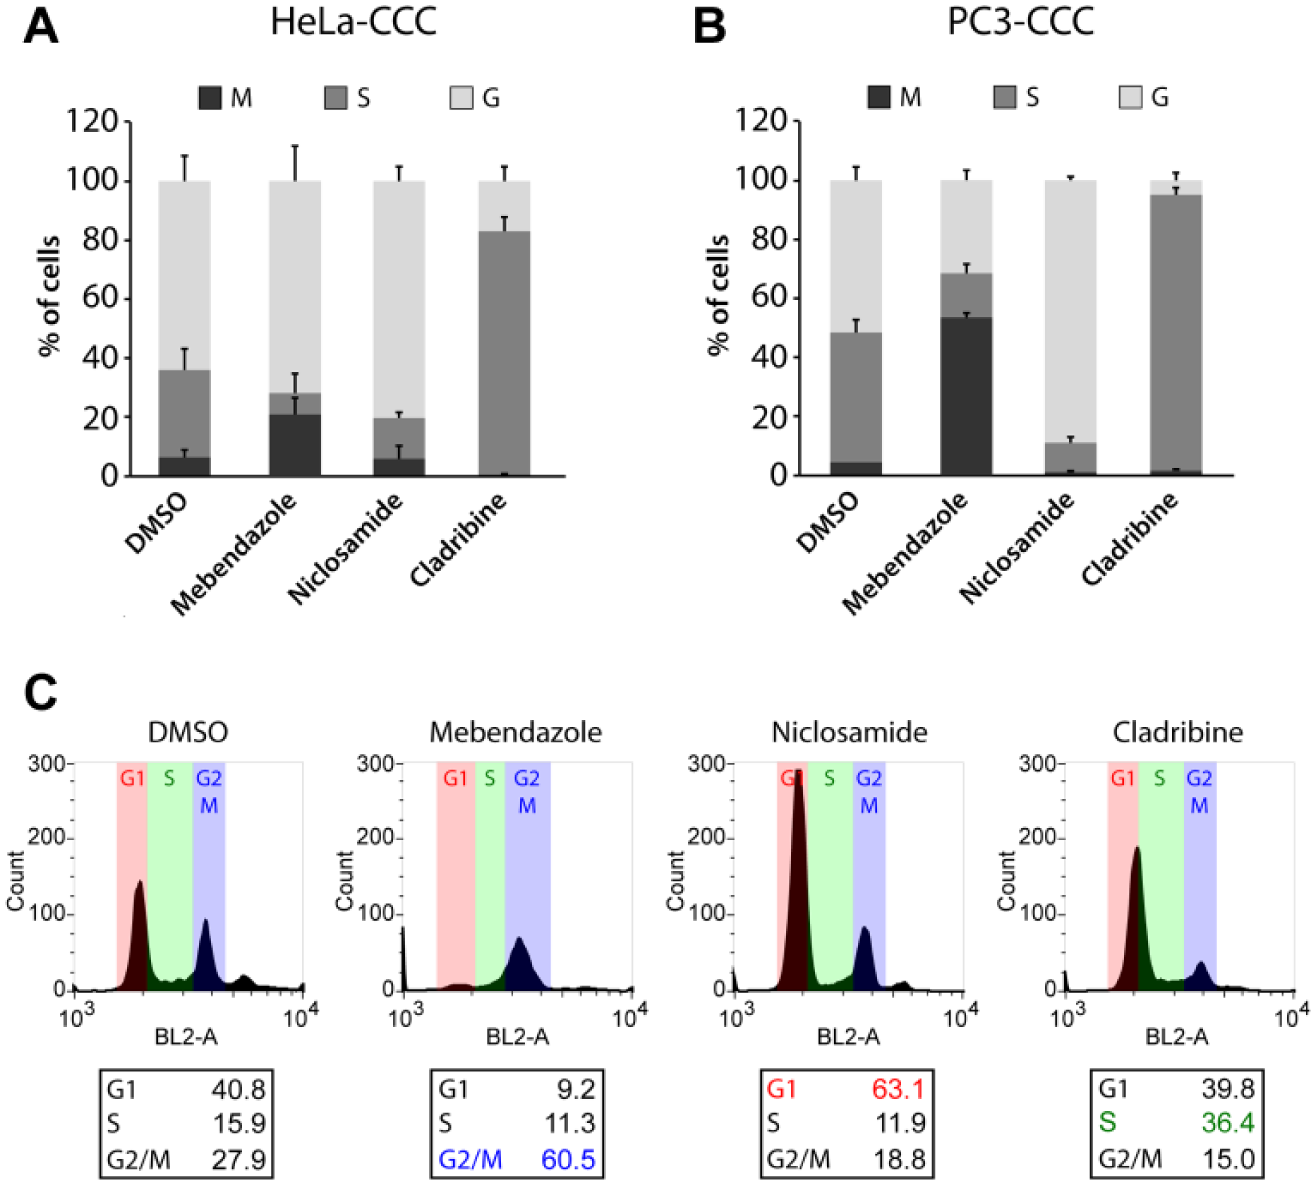
For hit validation, we reordered three hit compounds (mebendazole, niclosamide, and cladribine), which showed alteration of distinct cell cycle phases in our primary screening. These hits were retested in HeLa-CCC cells, and the distribution of the cell cycle phases was analyzed in the established microscopy-based assay. Notably, the activity of all three small molecules could be confirmed in the initial primary HeLa-based screening assay ( Fig. 6A ).
Hit confirmation with selected reordered hit compounds that modulate the cell cycle. (
To demonstrate that the chromobody technology is also functional in another cellular context, we generated a prostate cancer cell line (PC3) stably expressing the PCNA-chromobody labeled with TagRFP. We used this PC3-CCC cell line to test the effect of the compounds previously identified in the HeLa-CCC cell screen. Although the absolute percentages of cell cycle phases differ between HeLa (cervix carcinoma) and PC3 (prostate cancer) cells, our results reveal that the overall effects of cell cycle modulation mediated by mebendazole, niclosamide, and cladribine are comparable in both cell lines (
Fig. 6A
,
B
). Finally, the influence of the compounds on the cell cycle distribution was analyzed by classical PI-based flow cytometry assay in parental HeLa cells, as well as in U2OS cells (
Fig. 6C
and
The anthelmintic drug mebendazole is a member of benzimidazoles, a class of structurally related and tubulin-disrupting drugs inducing mitotic arrest by depolymerizing tubulin.22,23 Importantly, in both chromobody-based assays and PI assays, mebendazole appeared as a promising candidate inducing M phase arrest independent of the cell line tested ( Fig. 6A–C ). Our second hit, niclosamide, a drug originally used to treat intestinal tapeworm infections, 24 was very recently described to induce the arrest of the S and G2/M phases in U2OS cells. 25 Interestingly, in our image-based HeLa-CCC and PC3-CCC assay we identified and confirmed niclosamid as an inducer of G phase arrest ( Fig. 6A , B ). This is in accordance with the results of the PI flow cytometry assays, which show that niclosamid led to a dominant cell cycle arrest in the G1 phase ( Fig. 6C ). Cladribine is a purine analog and interferes with DNA synthesis and repair through incorporation into DNA. 26 This in turns leads to DNA strand breaks, cell cycle arrest, and ultimately cell death. After treatment of cells with cladribine, we observed a progressive accumulation of cells in the S phase in HeLa-CCC, as well as in PC3-CCC cells, suggesting a block during the S phase ( Fig. 6A , B ), which could also be verified by flow cytometry ( Fig. 6C ).
In summary, these data show that our high-content screening approach based on the chromobody technology is suitable to identify cell cycle modulators that are per se nontoxic.
Discussion
The aim of this study was to develop an image-based high-throughput assay format to analyze the effect of small molecules on cell cycle modulation in adherent cells, simultaneously measuring cytotoxicity. Hence, we developed a multiplexed two-step protocol using the HeLa–Cell Cycle Chromobody (HeLa-CCC) cell line together with the CytoTox-Glo (CTG) assay.
The HeLa-CCC cell line presented in this study was carefully characterized for response to toxic agents ( Fig. 1 ) by using different well-known toxic compounds (digitonin, vinblastine, and tacrine). As a consequence, we were able to obtain an optimal cell number with robust signals in the CTG assay. Measuring the dead-cell protease activity produces one single parameter per well, which is indicative for potential toxic effects produced by compound treatment. However, it is a common phenomenon that different assay and detection technologies generate different results for the same biological question. 27 Therefore, the big advantage of using the HeLa-CCC cell line is that a second step of microscopy-based readout is now possible without any complicated sample preparation and loss of throughput capacity. The simple visualization of the distribution of endogenous PCNA in this cell line was used to identify cell cycle subpopulations by high-content analysis. In addition, the analysis provides informative parameters such as cell number and nuclei morphology that can now be correlated with the CTG data for better toxicity evaluation. For instance, a low cell count could trace back to the fact that either a small molecule creates cytotoxic effects or the compound treatment results in a cell cycle arrest. Ideally, a small molecule should have high specificity to a selected target/pathway without early secondary cytotoxicity. Accordingly, such a compound blocks the cells in a specific cell cycle phase and cell death would just be a secondary effect when these cells were not able to exit the arrest.28,29 Such findings are definitely important since cancer cells are highly proliferating cells and any specific compound-mediated cell cycle modulation could direct these cells to apoptosis. 28
In contrast, small molecules that affect, for example, the integrity of the cellular membrane or the mitochondrial activity would also result in cell death with a decrease in cell number; however, this scenario would be independent of the proliferation status of the cell. Thus, our first assay step to identify general toxic compounds (e.g., membrane permeabilizer) is a suitable strategy to avoid higher attrition rates in later steps of the hit validation process. In our campaign we identified 62 compounds and the nocodazole control strongly reducing the cell numbers, of which we classified 52 as toxic molecules due to enhanced dead-cell protease activity in the supernatant. Interestingly, in the population with low cell count and less cytotoxicity (green population in Fig. 4 ), we identified four molecules that changed the distribution of the cell cycle phases. Thus, the hit rate in the “low cell count/low Tox” population (40%) is approximately 10 times higher than in the population with higher cell counts (4.5%), again proving that our multiplexing strategy can enrich cell cycle modulators. One of these compounds, mebendazole, was further used in the validation process, and it could be confirmed as a compound to induce M phase arrest.
Since detection of PCNA distribution is a microscopy-based imaging approach, it suffers the same limitations as immunofluorescence microscopy in general, including a dependency on suitable spatial resolution and fluorescent visualization. In contrast to classical immunostaining protocols, the chromobody technology offers the big advantage that no additional staining steps are needed to visualize endogenous PCNA.10,11 Moreover, this technology can be expanded to high-throughput live-cell imaging campaigns in the future that would create an additional layer of information about cell cycle dynamics. Alternatively, strategies where genes such as H2A or tubulin are tagged with fluorescence molecules can be employed, as these are differentially localized during specific cell cycle stages. 30 Although these tagged proteins recapitulate endogenous protein characteristics, we see the advantage of the chromobody technology to visualize the dynamics and localization of real endogenous proteins without fluorescence tagging. This high-throughput/high-content imaging approach is also a valid alternative to the flow cytometry “gold standard” using PI as more easily applicable to adherent cell lines, which are used in many laboratories for cell cycle analysis. Importantly, we could demonstrate that the HeLa-CCC high-content imaging approach yields very high reproducibility and good Z′ values. It is also worth mentioning that the chromobody technology is not limited to distinct cell lines, as it could already be established for HeLa, PC3, and U2OS cell lines (data in this manuscript and data not shown). Furthermore, other intracellular proteins (e.g., lamin, vimentin, β-catenin, PARP1, and actin) could successfully be targeted by the chromobody technology11,31–33 (Buchfellner et al., 2015, in revision), making this technology suitable for the development of a variety of image-based screening assays for future applications.
Of note, high-content imaging-based cell cycle phenotyping, unlike the analysis by flow cytometry, permits the analysis of a multitude of subcellular structures. For instance, the approach presented in this study allows versatile multiplexing, for example, by immunostaining of other proteins in the screening procedure to determine their localization in dependency of each of the cell cycle phases. In one example, this application enabled us to costain phospho-ATM, a DNA damage marker, 34 in HeLa-CCC cells. γ-Irradiation with 2 Gy induces DNA double-strand breaks (DSBs), followed by the accumulation of phospho-ATM at DSBs, and this accumulation could nicely be detected and quantified with an anti-phospho-ATM antibody in HeLa-CCC cells (data not shown) and correlated to a specific cell cycle phase. Technically, this cell line could be used for any kind of coevaluation of other proteins in dependency to the cell cycle phases as long as there is no cross talk of fluorescence and a sufficient spatial resolution is achieved.
In summary, we demonstrate that multiplexing the CTG assay with the HeLa-CCC cells in combination with high-content imaging enables the identification of potent cell cycle inhibitors in adherent cells. Furthermore, this protocol provides insight into the compound mechanism of action and heterogeneity of response. The convenience of the assay protocol makes this approach highly applicable for high-throughput screening and compound profiling.
Future studies will apply this assay format to larger screening campaigns in adherent cells for the identification of so far unknown cell cycle modulators. These small molecules could contribute to the development of novel drug candidates for cancer treatment, as well as tool compounds for their use in basic research.
Footnotes
Acknowledgements
We thank ChromoTek GmbH for providing the chromobody cell lines used in this study and Stefanie Brandner for excellent technical assistance.
Declaration of Conflicting Interests
The authors declared no potential conflicts of interest with respect to the research, authorship, and/or publication of this article.
Funding
The authors received no financial support for the research, authorship, and/or publication of this article.
References
Supplementary Material
Please find the following supplemental material available below.
For Open Access articles published under a Creative Commons License, all supplemental material carries the same license as the article it is associated with.
For non-Open Access articles published, all supplemental material carries a non-exclusive license, and permission requests for re-use of supplemental material or any part of supplemental material shall be sent directly to the copyright owner as specified in the copyright notice associated with the article.