
Abstract
A new analysis approach was evaluated for measuring plasma protein binding (PPB) of small molecules using the Agilent RapidFire high-throughput system coupled with a Sciex API 4000 mass spectrometer (RF-MS/MS). Thirty-three proprietary and 12 literature compounds were subjected to rapid equilibrium dialysis (RED) and evaluated in parallel using RF-MS/MS at 16.4 s/sample and traditional liquid chromatography–tandem mass spectrometry (LC-MS/MS) at 3.5 min/sample, thus making the RF-MS/MS analysis over 12 times faster than LC-MS/MS. The high-throughput analysis method that was developed demonstrated excellent correlation with the traditional LC-MS/MS analysis method with an r2 value of 0.96. The RF-MS/MS analysis method was implemented to increase sample throughput, decrease turnaround time for PPB data, and decrease time burden on existing LC-MS/MS instruments.
Introduction
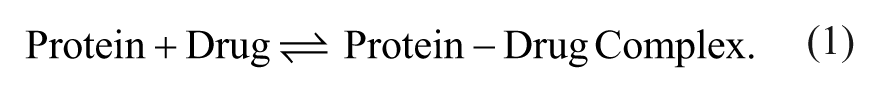
Plasma protein binding (PPB) is an in vitro assay widely used in the pharmaceutical industry to assess the free drug fraction. The free drug fraction (or simply fraction unbound [fu]) is used to convert in vivo total drug concentration into free concentration to aid in pharmacokinetic/pharmacodynamic interpretation, dose projection, and modeling. 1 Drugs can bind to plasma proteins such as albumins, α-acid glycoproteins, and/or lipoproteins. There is an equilibrium between free drug, protein, and the protein-drug complex that is described by the following equation.
There are several methods to characterize PPB, but equilibrium dialysis has been observed to be the most accurate. 2 The rapid equilibrium dialysis (RED) approach was used in this work to reduce equilibrium and assay preparation time. 2
The RED assay is used at Novartis for initial PPB characterization for all disease areas during the discovery phase. This translates into a large amount of requests per week, which can take traditional liquid chromatography–tandem mass spectrometry (LC-MS/MS) more than 30 h of runtime. The Agilent RapidFire high-throughput system (Agilent Technologies, Inc., Santa Clara, CA) performs an online solid-phase extraction followed by direct delivery of the sample to the mass spectrometer (RF-MS/MS). The absence of a chromatographic separation allows for a significant decrease in cycle time per sample compared with traditional LC-MS/MS (e.g., 8–20 s compared with 3–5 min, respectively). RF-MS/MS and similar systems have proven to be successful with in vitro ADME assays,3–10 but to our knowledge, there have been no peer-reviewed published reports on the application of RF-MS/MS for PPB analysis. This article explores the application of a fully integrated RF-MS/MS system to increase sample throughput, decrease the time burden on existing laboratory instrumentation, and improve turnaround time for PPB results. Moreover, an analytical solution is presented that was derived by holistically examining the entire process of generating PPB data, including automated batch and run list creation, automated MS method creation, and high-throughput tools for data processing and analysis. This approach ensures that all potential bottlenecks in the process of generating PPB data are minimized, resulting in a platform that is well suited to supporting the needs of PPB determination in an early discovery pharmaceutical environment.
Materials and Methods
Reagents
Pooled plasma from mouse, rat, dog, monkey, or human was purchased from BioreclamationIVT (Westbury, NY). Commercially available compounds were purchased from Sigma Aldrich (St. Louis, MO). Bepridil, clozapine, dexamethasone, docetaxel, etoposide, fluphenazine, piroxicam, promethazine, propranolol, sulfamethoxazole, triamterene, and warfarin were used as test compounds for this work. Rapid Equilibrium Dialysis (RED) single-use inserts, reusable base plate, phosphate buffered saline, ethanol, acetonitrile, methanol, formic acid, and DMSO were purchased from Thermo Fisher Scientific (Rockford, IL).
RED Protein Binding Assay
The reusable Teflon base plate was soaked in 20% ethanol, dried, and then filled with RED inserts prior to use. Internal and commercial compounds were dissolved in DMSO to create spiking solution concentrations of 0.25 mg/mL. Freshly thawed plasma of each selected species was pipetted into 990-µL aliquots. Then, 10 µL of the spiking solutions was added to the 990-µL plasma aliquots to create samples with a concentration of 2500 ng/mL. Each plasma sample along with a phosphate buffered saline solution was added to RED inserts in the sample and buffer chambers, respectively, at a ratio indicated by the manufacturer’s protocol. Each analysis was performed in triplicate with three separate RED inserts. The test plates were sealed and incubated for 4.5 h at 37 °C in an orbital shaker with 5% CO2 to keep the pH of the plasma constant. This step has been shown in the literature, 11 as well as in a Novartis cross-site evaluation, to be imperative in maintaining consistency of PPB data. Matrix matching was performed after incubation and prior to protein precipitation. A 25-µL aliquot of each chamber containing plasma was transferred to a 96-well plate containing 25 µL phosphate buffered saline for analysis. A 25-µL aliquot of each corresponding phosphate buffered saline chamber was transferred to a 96-well plate containing 25 µL plasma of the desired species. Control compounds were incubated along with unknown compounds to maintain data consistency on an intra- and interday basis. 11 These included triamterene (high fu), propranolol (medium fu), and warfarin (low fu).
A plasma stability analysis was performed to ensure that the PPB data were not affected by drug instability. In total, 25 µL of each remaining 2500-ng/mL plasma sample was transferred to a 96-well plate in duplicate aliquots for analysis and treated as a t = 0 sample. The remaining plasma was then incubated in parallel with the PPB samples for 4.5 h at 37 °C in an orbital shaker. After incubation, 25 µL of each plasma sample was transferred to a 96-well plate in duplicate for analysis and treated as a t = 4.5-h sample. Then, 150 µL acetonitrile containing 100 ng/mL of the internal standard (glyburide) was added to each 96-well plate to precipitate the plasma proteins. The plates were then vortexed and spun on a centrifuge for 10 min at ~2700 × g and 4 °C, and 125 µL of the resulting supernatant was transferred to a new 96-well plate. The new 96-well plates had 150 µL of water added to them. Then, 60 µL was transferred from these plates into 384-well plates for analysis on the RapidFire MS/MS system. The remaining sample was used for traditional LC-MS/MS analysis.
LC-MS/MS System Setup
LC-MS/MS analysis was performed using an API 6500 triple quadrupole instrument mass spectrometer (Sciex, Foster City, CA), coupled to an Agilent 1290 Infinity LC system (Agilent Technologies, Inc.) and a CTC HTS PAL autosampler (LEAP Technologies, Carrboro, NC). Chromatographic separations employed an ACE C18, 3-µm, 30-mm × 2.1-mm i.d. high-performance liquid chromatography (HPLC) column (MAC-MOD Analytical, Inc., Chadds Ford, PA). A 20-µL sample loop was used for injection. A 3.5-min LC method with a flow rate of 0.7 mL/min was used for separation. The mobile phase consisted of 0.1% formic acid in water (solvent A) and 0.1% formic acid in acetonitrile (solvent B). Elution conditions were the following: 0 to 0.5 min, 2% solvent B; 0.5 to 2.0 min, a linear gradient change from 2% to 98% B; 2.0 to 2.5 min, 98% B; 2.5 to 2.6 min, a linear gradient change from 98% to 2% B; and 2.6 to 3.0 min, the mobile phase returned to initial conditions. The total cycle time of the LC-MS/MS method was 3.5 min, including 0.5 min for the autosampler to make an injection. LC-MS/MS was performed in either positive (5500 V) or negative polarity (−4500 V) depending on the test compound. The source temperature was 450 °C. Gas 1 and gas 2 settings for nitrogen were set to 60. The curtain gas and collision gas were also nitrogen and were set to 30 and 10, respectively. All test compounds were acquired with selected reaction monitoring (SRM) transitions, which were optimized with DiscoveryQuant 2.1.2 software (Sciex). DiscoveryQuant enabled the unattended optimization of SRM methods for all compounds.
RF-MS/MS System Setup
The RapidFire RF300 system (Agilent Technologies, Inc.) was coupled to an API 4000 triple quadrupole mass spectrometer (Sciex). An online solid-phase extraction was performed with a RapidFire cartridge (reversed-phase C4 chemistry) prior to introduction of the sample into the mass spectrometer. The mobile phase consisted of 0.1% formic acid in water (solvent A for loading/desalting) and 0.1% formic acid in methanol (solvent B for elution to MS). The RapidFire method conditions were the following: 700 ms aspirate, 4000 ms load/desalt, 3000 ms elute, and 500 ms reequilibrate. The aspiration time was purposefully set to 700 ms to overfill the injection loop, and ensure better reproducibility. The RapidFire sipper was rinsed with water and acetonitrile using the RapidFire wash station after each injection. An additional blank injection from a RapidFire matrix vial (50/50 water/acetonitrile) was performed after every injection to minimize any potential carryover. The blank injection plus the sample injection made the total cycle time for RF-MS/MS analysis 16.4 s, which reduced sample analysis time by over 12-fold compared with traditional LC-MS/MS analysis. RF-MS/MS was performed in either positive (5500 V) or negative polarity (−4500 V) depending on the ionization properties of the analytes. The source temperature was 550 °C. Gas 1 and gas 2 settings for nitrogen were set to 50. The curtain gas and collision gas were also nitrogen and were set to 30 and 10, respectively. All test compounds were acquired with SRM transitions, which were optimized with DiscoveryQuant 2.1.2 software (Sciex). All RF-MS/MS data were acquired in a multiple-injection chromatogram format, whereby all data/injections for a compound are acquired in a single data file. This imparts added robustness and throughput to the system, since delays and errors associated with opening/closing multiple data files are reduced.
System Suitability Check
A system suitability test was implemented to benchmark the performance of LC-MS/MS and RF-MS/MS prior to beginning the analytical run sequence. To pass the system suitability test, a 0.1-nM solution of verapamil had to result in a peak with a signal-to-noise ratio (S/N) greater than 10:1. S/N ratios were calculated using the S-to-N script associated with Analyst Software (Sciex, Framingham, MA, USA). The same criterion was also applied to test compounds (including quality controls [QCs]) to determine if a chromatographic peak represents meaningful data.
Automated Tools
An internally developed Microsoft Excel (Microsoft Corp., Redmond, WA) software tool was implemented to complement the speed of RF-MS/MS. This tool automatically creates the files required for DiscoveryQuant SRM method creation/optimization, plate maps, and LC-MS/MS or RF-MS/MS sequences using Excel macros. Furthermore, a PPB Wizard was internally developed using Microsoft Excel for automatic generation of protein binding reports from Analyst or MultiQuant (.txt type) data files. These tools not only complement the speed of the RF-MS/MS but also reduce the possibility of human error by minimizing manual intervention.
Data Analysis
Special consideration needs to be given to data processing and analysis when developing a high-throughput analytical solution. This is especially true given that RF-MS/MS data are acquired in multiple-injection files, which necessitates software capable of processing data in this format. MultiQuant 2.1.1 software (Sciex) was uniquely suited to this purpose and was used to perform peak integration for both LC-MS/MS and RF-MS/MS analysis. All analyte peak areas were normalized to their corresponding internal standard peak area. Fraction unbound (fu) was calculated for each test compound using equation (2).
where PAR_buffer is the peak area ratio in the buffer chamber, and PAR_plasma is the peak area ratio in plasma. Stability was assessed by calculating the percentage remaining following the 4.5-h incubation using equation (3):
If the calculated percentage remaining following the 4.5-h incubation was not within a range of 70% to 130%, the protein binding results were deemed unreliable and were not reported. Peak areas of each compound in the buffer chamber were analyzed using a criterion of a minimum S/N of 10:1.
Results and Discussion
A total of 45 compounds were evaluated for this study, of which 33 were proprietary Novartis compounds, nine were selected from literature, and another three literature compounds (propranolol, triamterene, and warfarin) were used as QCs. In silico physicochemical parameters were calculated for 42 test compounds using in-house software. The compounds had a molecular weight range from 253 to 901 g/mol, distribution coefficient (pH 7.4) from −1.1 to 5, partition coefficient from 0.03 to 6.2, and a polar surface area from 6 to 224 Å. This clearly represents a chemically diverse set of compounds for the evaluation of RF-MS/MS. It is also imperative to know if a particular physicochemical parameter may bias RF-MS/MS results. For instance, compounds with higher hydrophobicity may behave differently in RF-MS/MS compared with LC-MS/MS and generate different fu values. Figure 1 shows plots of the ratio of fu determined by RF-MS/MS and LC-MS/MS against select physicochemical parameters. In the ideal scenario, one would expect the ratio to be equal to unity, irrespective of the physicochemical parameter (i.e., there is no relationship between fu and the physicochemical parameter). This is exactly what is seen in Figure 1 , where the horizontal line shows no clear relationship in the data. Therefore, the choice of compounds and their physicochemical properties do not bias the evaluation in any way.
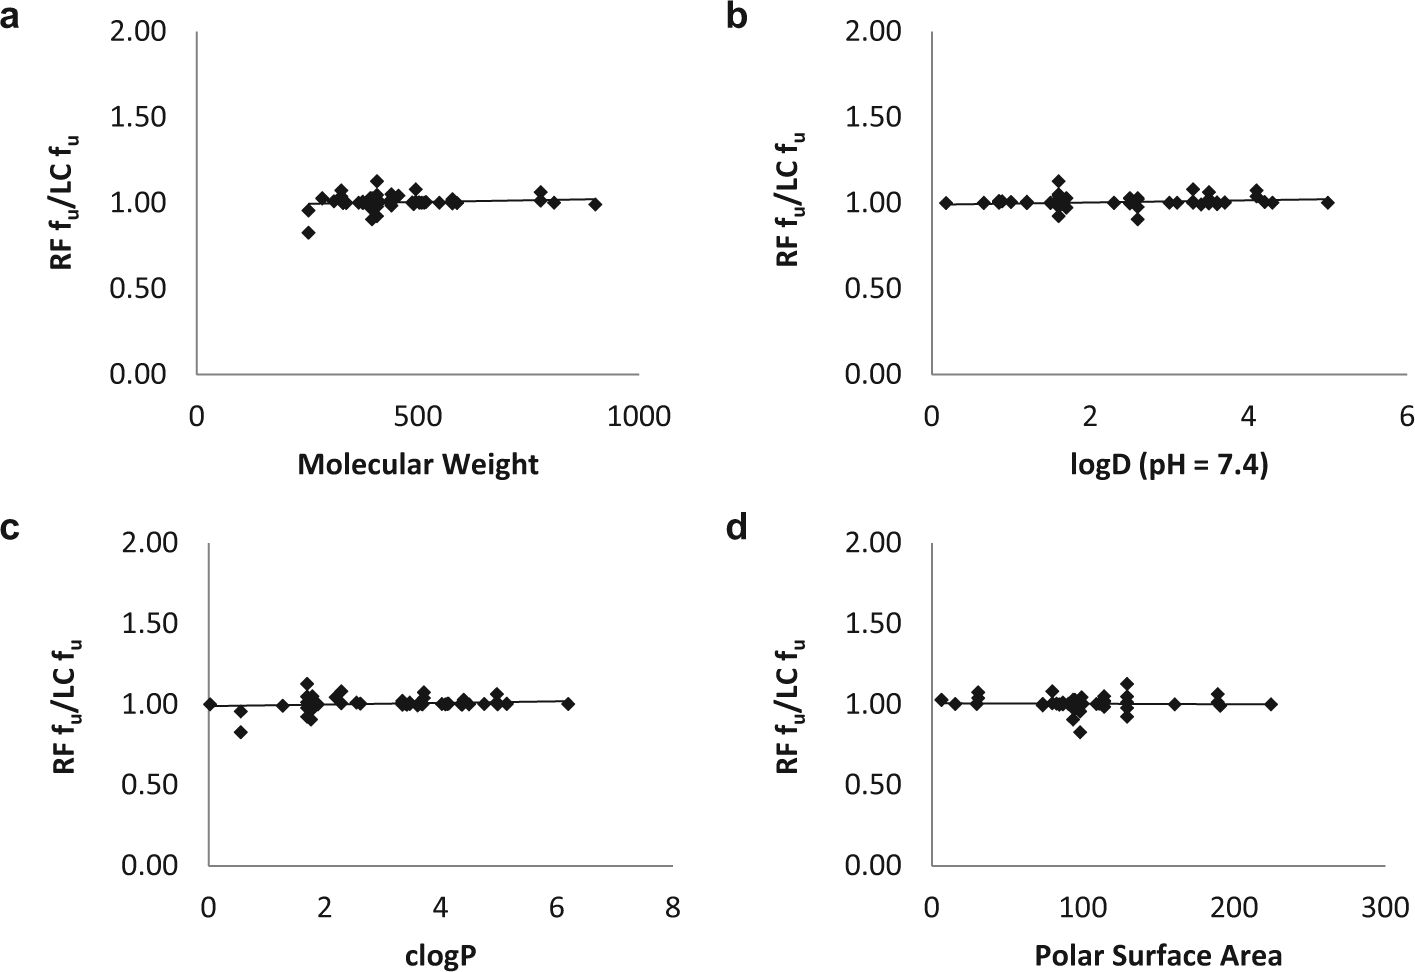
Physicochemical properties of test compounds. Ratio of fu (RF-MS/MS to LC-MS/MS) plotted against (
The data from both LC-MS/MS and RF-MS/MS sets were compared using correlation plots for each experiment. The collective data generated from four experiments were combined into one single data set to generate a correlation for 25 proprietary compounds, nine commercial compounds, and three QCs. The test compounds were evaluated in the plasma of different biological species depending on the request from the project team. In total, 107 unique incubations were performed in plasma with K2 EDTA as an anticoagulant and 14 in plasma with sodium heparin as an anticoagulant. Figure 2 shows the correlation for these 106 unique incubations (15 data points were dropped since they did not meet the S/N criterion). The comparison of LC-MS/MS to RF-MS/MS yielded a slope of approximately 1 and a correlation coefficient of 0.96. Moreover, a correlation plot of fu between RF-MS/MS and literature values for the 12 commercial compounds has a slope of 0.93 and a correlation coefficient of 0.88, lending further support to the suitability of RF-MS/MS for the analysis of PPB samples. Table 1 lists the fu values determined by RF-MS/MS and LC-MS/MS of the nine commercial compounds used in this work, along with literature values.
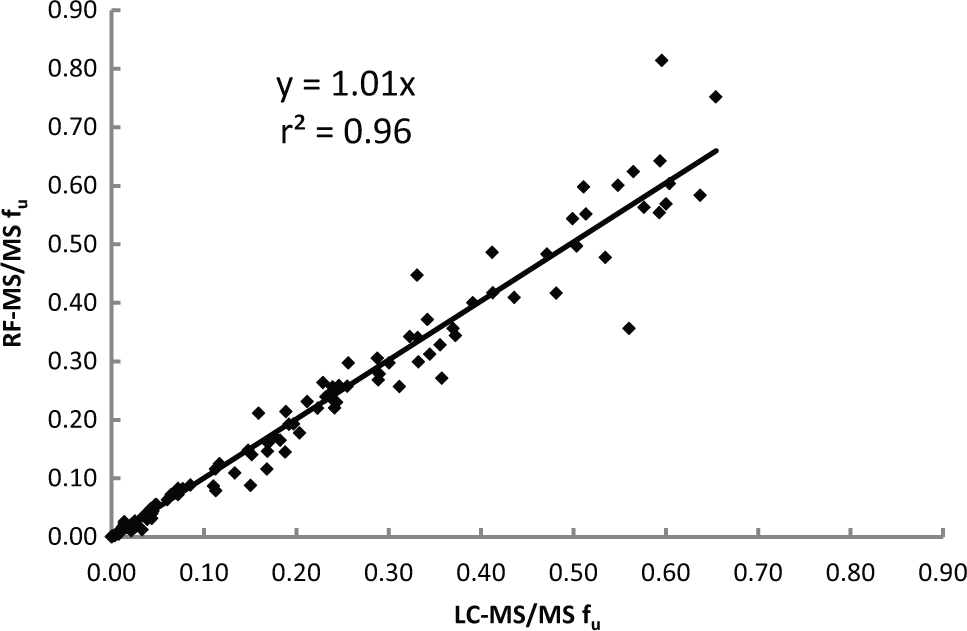
A correlation plot of fu values using RF-MS/MS and LC-MS/MS. Data were collected as an average of triplicate points, with n = 106 (15 of 121 compounds removed for signal to noise <10). LC-MS/MS, liquid chromatography–tandem mass spectrometry; RF-MS/MS, RapidFire high-throughput system coupled with a Sciex API 4000 mass spectrometer.
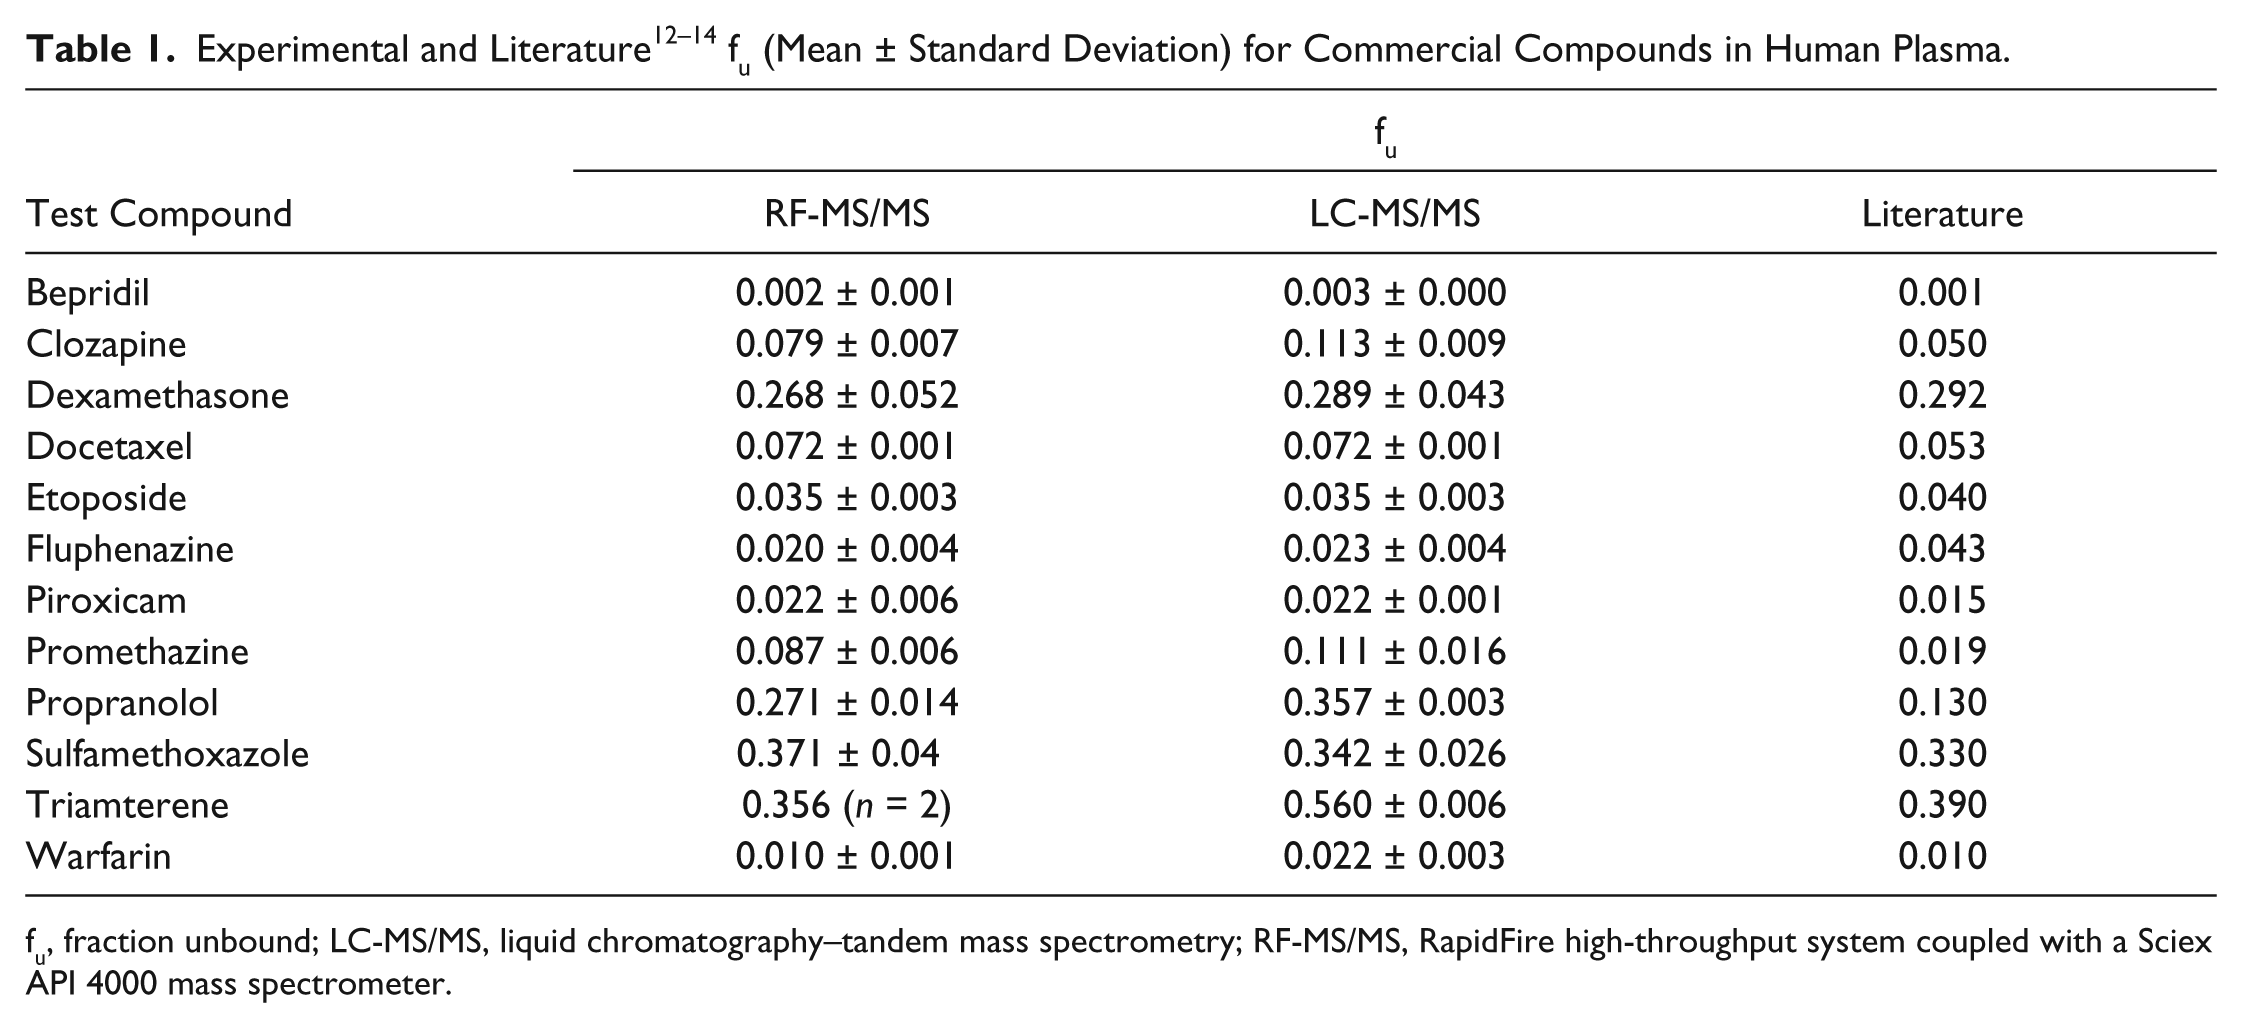
fu, fraction unbound; LC-MS/MS, liquid chromatography–tandem mass spectrometry; RF-MS/MS, RapidFire high-throughput system coupled with a Sciex API 4000 mass spectrometer.
PPB measurements below a fu of 0.01 are generally deemed unreliable, 15 largely due to exposure levels of highly bound compounds frequently falling at or below the limit of detection of LC-MS/MS or radioactivity detection. This is especially true in the discovery phase where emphasis is placed on throughput rather than developing methods with high sensitivity. Hence, for the purposes of reporting data to project teams, fu below 0.01 was labeled “<0.01.” This represents a fit-for-purpose approach for generating PPB data in the early discovery phase for a wide range of chemically diverse compounds. More stringent assay conditions are applied when compounds enter the preclinical development stage.
Nonetheless, highly bound compounds were evaluated using LC-MS/MS and RF-MS/MS. A 10:1 S/N requirement for LC-MS/MS and RF-MS/MS data was implemented to ensure data quality and robustness for compounds with fu of 0.01 or lower. If a chromatographic peak was detected with S/N less than 10:1 for the buffer chamber in the RED dialysis experiment, then the compound was labeled “undeterminable,” and data were not reported. Compounds labeled “undeterminable” or compounds yielding fu less than 0.01 were both reported as “<0.01.” Figure 3 shows that a higher number of compounds (i.e., 19 compared with 12 of the 121-compound data set) were measured as <0.01 using LC-MS/MS, and a higher number of compounds (i.e., 13 compared with 6) were labeled “undeterminable” using RF-MS/MS. However, both techniques had the same number of compounds (i.e., 25), for which a numerical fu was not assigned. The larger number of compounds labeled “undeterminable” using RF-MS/MS can be explained by the overall loss of sensitivity associated with this technique for compounds having fu less than 0.01. However, the RF-MS/MS method has the requisite sensitivity to reliably measure PPB for compounds with fu values higher than 0.01 and, in some instances, for compounds with fu lower than 0.01. This observation, coupled with the assay cap of “<0.01” (as was discussed in the previous paragraph), is the reason that there is no difference in the data and attrition rate of the PPB assay when LC-MS/MS or RF-MS/MS is used as the detection technique. Figure 4 shows the correlation between LC-MS/MS and RF-MS/MS for compounds with low fu (<0.01). The correlation for compounds with low fu (r2 = 0.81) is somewhat lower than the correlation for the complete data set (r2 = 0.96) but is still acceptable given that data were acquired near the lower limit of quantification (S/N 10:1) of both assays.
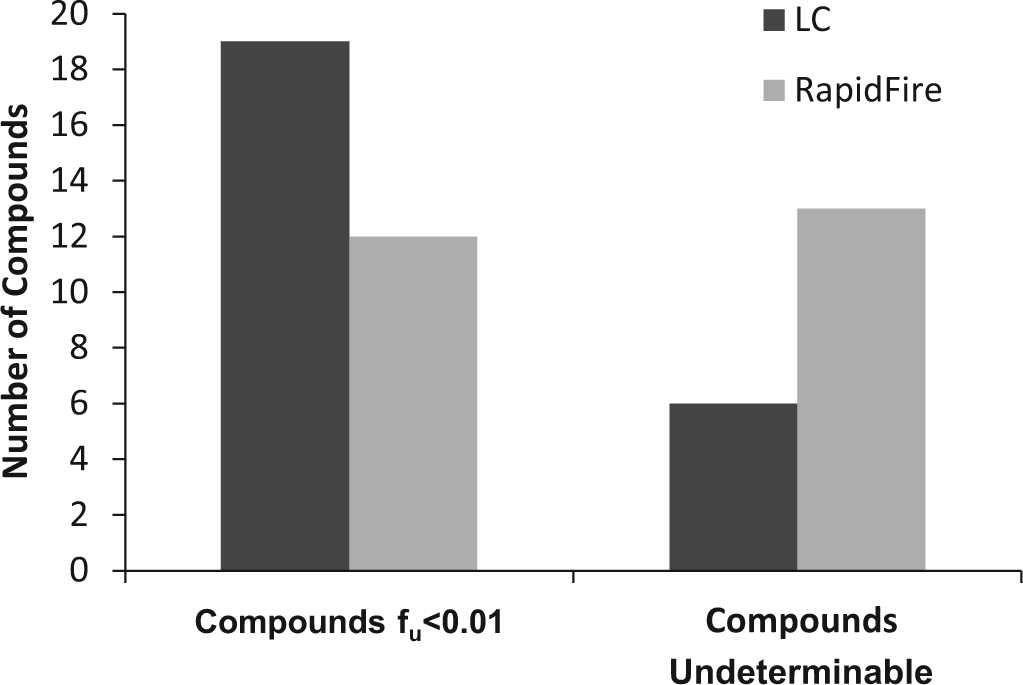
A bar graph of the number of compounds of the 121-compound data set that had fu <0.01 using LC-MS/MS and RF-MS/MS. Bar graph also shows the number of compounds that were labeled “undeterminable” using LC-MS/MS and RF-MS/MS. fu, fraction unbound; LC-MS/MS, liquid chromatography–tandem mass spectrometry; RF-MS/MS, RapidFire high-throughput system coupled with a Sciex API 4000 mass spectrometer.
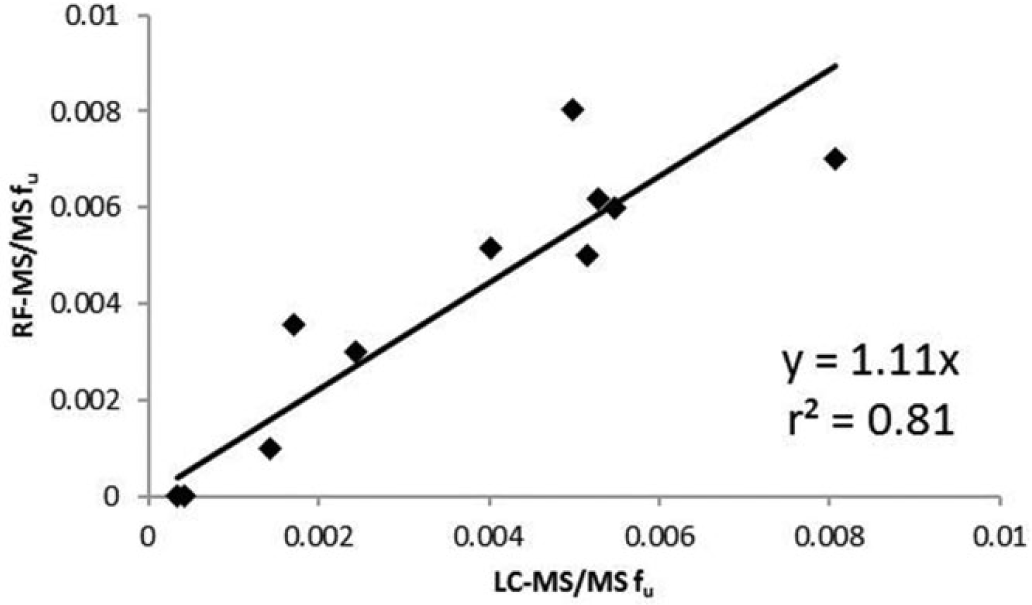
A correlation plot of fu using RF-MS/MS and LC-MS/MS for highly bound compounds (fu <0.01). fu, fraction unbound; LC-MS/MS, liquid chromatography–tandem mass spectrometry; RF-MS/MS, RapidFire high-throughput system coupled with a Sciex API 4000 mass spectrometer.
The increase of speed associated with RF-MS/MS stems from there being no chromatographic separation during analysis. Coelution of endogenous components (e.g., phospholipids) could lead to matrix effects and ion suppression. This ion suppression is of particular concern for highly bound compounds. The sensitivity of the analysis is critical to obtain a protein binding value for highly bound compounds. A reduction in sensitivity could lead to an increase in the amount of compounds for which no data are obtained. Metabolites of the same mass transition or that undergo in-source fragmentation could also lead to potential isobaric interferences. However, the predominant metabolic pathway in blood/plasma is ester hydrolysis and amide hydrolysis, 16 which should not cause such an issue. Furthermore, a stability experiment is performed in parallel with protein binding, and if the compound is found to have less than 70% recovery, then the data are deemed not reportable.
The software tools that were developed and/or implemented in this work complemented the speed of RF-MS/MS and ensured minimal manual user intervention throughout the entire process. This is of utmost importance when developing a high-throughput analytical platform because bottlenecks can result in unforeseen issues or delays, rendering improvements in analytical throughput meaningless. For example, the data analysis process implemented in this work uses MultiQuant software to peruse and integrate chromatographic peaks in a facile manner. The data export from MultiQuant is further manipulated by means of Excel macros (e.g., the PPB Wizard) to automatically calculate and generate reports for project teams. This workflow is imperative when dealing with the large amount of data generated using RF-MS/MS to ensure that data are delivered quickly and reliably.
Footnotes
Acknowledgements
We thank David Ayres for creation of the plasma protein binding report and Guiqing Liang for helpful discussions.
Declaration of Conflicting Interests
The authors declared no potential conflicts of interest with respect to the research, authorship, and/or publication of this article.
Funding
The authors received no financial support for the research, authorship, and/or publication of this article.