
Abstract
Mass spectrometry (MS) offers a label-free, direct-detection method, in contrast to fluorescent or colorimetric methodologies. Over recent years, solid-phase extraction–based techniques, such as the Agilent RapidFire system, have emerged that are capable of analyzing samples in <10 s. While dramatically faster than liquid chromatography–coupled MS, an analysis time of 8–10 s is still considered relatively slow for full-diversity high-throughput screening (HTS). Matrix-assisted laser desorption/ionization time-of-flight mass spectrometry (MALDI-TOF) offers an alternative for high-throughput MS detection. However, sample preparation and deposition onto the MALDI target, as well as interference from matrix ions, have been considered limitations for the use of MALDI for screening assays. Here we describe the development and validation of assays for both small-molecule and peptide analytes using MALDI-TOF coupled with nanoliter liquid handling. Using the JMJD2c histone demethylase and acetylcholinesterase as model systems, we have generated robust data in a 1536 format and also increased sample deposition to 6144 samples per target. Using these methods, we demonstrate that this technology can deliver fast sample analysis time with low sample volume, and data comparable to that of current RapidFire assays.
Introduction
High-throughput screening (HTS) is a key process in lead discovery for the pharmaceutical industry and academia. In recent years, the size and diversity of compound collections have increased; hence, technologies for miniaturization and automation of biological assays to enable the testing of tens (HTS) or even hundreds (ultra-HTS [uHTS]) of thousands of compounds per day are required. While focused screens based on small chemical libraries have been applied as an alternative to HTS, they do not enable coverage of the diversity of chemical space offered in a full-diversity screen,1,2 and some target knowledge is required to build the compound sets, making them less suited to novel target classes. 3
Historically, fluorescence-based technologies have been used for uHTS against enzyme targets, with techniques such as fluorescence intensity (FI), fluorescence polarization (FP), and time-resolved fluorescence resonance energy transfer (TR-FRET) being commonly applied. These technologies are, however, susceptible to interference from colored or fluorescent compounds. Critically, owing to the modified reaction components and variety of detection methods, different formats screening the same compound library can report strikingly different activities, and thus extensive confirmation assays are required to validate hits. 4 Additionally, the development of specific fluorescent probes or antibodies adds cost and time to the discovery process. 5
Mass spectrometry (MS) is rapidly becoming an essential tool for identifying and characterizing molecules that modulate protein function, offering a label-free, direct-detection method. High-performance liquid chromatography (HPLC)–MS methods, unlike many label-dependent formats, can quantify all species present in an enzymatic reaction and provide a more complete assessment of activity through analysis of both substrates and products. Yet these conventional methods are extremely low throughput, typically minutes per sample. 6 More recently, solid-phase extraction (SPE)–based platforms, such as the Agilent RapidFire (RF-MS), have enabled analysis times of <10 s/sample. While dramatically faster than HPLC-MS, a sample time of 10 s is still considered relatively slow for HTS or uHTS, where screening of millions of compounds would take many months. RapidFire is therefore more typically employed for compound profiling, focused screening,7,8 and ADME assays, 9 where compound throughput is <5000 compounds/day in a 96- or 384-well plate format, with sample volumes of >40 µL/well. By comparison, fluorescence-based readouts offer a sample time of <1 s and are typically run in 1536-well plates, with assay reactions in sample volumes of 10 µL or less.
The development of surface-based MS techniques, such as matrix-assisted laser desorption/ionization (MALDI), desorption electrospray ionization (DESI), secondary ion mass spectrometry (SIMS), and self-assembled monolayers coupled with desorption/ionization (SAMDI), which offer direct ionization of analytes with little to no sample preparation, is an attractive alternative to the SPE-coupled electrospray ionization methods already described. Having fast analysis times (around 1 s/sample) and very small sample volume requirements (typically nanoliters), surface-based MS techniques have the potential to combine the label-free, interference-resistant readout of mass spectrometry with throughput closer to that of traditional fluorescence-based techniques. One of the most validated surface-based MS techniques is MALDI coupled with time-of-flight mass spectrometry (MALDI-TOF), whereby the analyte is cocrystallized on the surface with the matrix, which absorbs laser energy and facilitates desorption/ionization of analyte molecules. Historically, however, deposition of sample onto the MALDI target, as well as interference from matrix ions for low-molecular-weight analytes, has been considered a limitation for the use of MALDI-TOF for higher-throughput screening assays.
MALDI-TOF approaches for direct quantitation of small molecules, peptides, and proteins for enzyme assays and inhibitor screens have now been published;10–12 however, these examples typically employ high sample volumes (reaction volume up to 50 µL and sample deposition up to 2 µL) in a 96- or 384-well format, with a sampling rate of ~5 s. This throughput is comparable to the current RF-MS methodologies and demonstrate the potential application of MALDI-TOF, but do not address the critical issues for uHTS, including low sample volume, and fast analysis speeds of <1 s/sample. We note, however, recent reports detailing the use of the Mosquito (TTP Labtech, Hertfordshire, UK) with MALDI-TOF as a high-throughput screening platform that may address these issues.13,14
Here we describe the application of MALDI-TOF in the development, configuration, and validation of uHTS-compatible enzyme assays for small-molecule and peptide analytes using acetylcholinesterase (ACHe) and the histone H3 demethylase Jumonji enzyme JMJD2c as model enzymes, both of which are important therapeutic targets for neurological conditions 15 and cancer,16,17 respectively. These model enzymes were selected for three reasons. First, they were selected to study low-molecular-weight (~100 Da) and higher-molecular-weight (~1500 Da) analytes to demonstrate the broad applicability of this technology. Second, there was an existing RF-MS assay in-house to allow comparison of data between techniques. Finally, MALDI-TOF analysis has been reported for both ACHe 18 and a related H3K9 demethylase, JMJD2e. 19 These targets were therefore considered ideal candidates to determine if this technique could be configured in an uHTS-compatible format.
Materials and Methods
Materials
Ascorbic acid, α-ketoglutarate, DMSO, 2-(N-morpholino)ethanesulfonic acid (MES), bovine serum albumin (BSA), acetylcholine, choline, Tris-HCl, trifluoroacetic acid (TFA), HPLC-grade water, HPLC-grade ethanol, HPLC-grade methanol, and HPLC-grade acetonitrile were purchased from Sigma-Aldrich (St. Louis, MO). Ammonium iron (II) sulfate and formic acid (FA) were purchased from Fisher Scientific (Hampton, NH). Acetylcholinesterase was purchased from R&D Systems (Abingdon, UK). α-Cyano-4-hydroxycinnamic acid matrix (CHCA), peptide calibration standard II, Anchor Chip PAC 384 HCCA plastic target plates, and metal MTP PAC Frames were purchased from Bruker Daltonics (Bremen, Germany). Histone H3K9 peptides were synthesized and HPLC purified to >95% purity by Cambridge Research Biochemicals (Cambridge, UK) as detailed by Hutchinson et al. 20
JMJD2c Expression and Purification
Flag-6His-Tev-JMJD2c (1–336) was previously produced in-house using a baculovirus expression system as described by Hutchinson et al. 20
Preparation of Compound Plates
For single-concentration screening, 50 nL of 1 mM compound solution in DMSO was transferred into 1536-well HiBase microtiter plates (Greiner, Stonehouse, UK) to give a final screening concentration of 10 µM. Known JMJD2c inhibitors tested at a single concentration were prepared in a 384-well V base plate (Greiner) from 1 mM and 100 µM stocks in DMSO. From each well of this 384-well plate, 50 nL was then transferred into a 1536-well HiBase microtiter plate, giving final assay concentrations of 10 and 1 µM. For concentration–response curves, a threefold serial dilution was prepared from 10 mM compound solutions in DMSO in 384-well V base plates (Greiner). From this master plate, 50 nL of compound was transferred into a 1536-well HiBase microtiter plate, giving a final concentration range between 100 µM and 1.7 nM. All compounds and DMSO were dispensed using an Echo acoustic dispenser (Labcyte, Sunnyvale, CA). For all assays, the final DMSO concentration was 1%. Columns 11 and 12, and 35 and 36 of 1536-well HiBase microtiter plates were reserved for uninhibited and inhibited controls, respectively. The uninhibited control contained 50 nL DMSO but no compound, whereas the inhibited control contained 50 nL DMSO, but the enzyme was inactivated by pretreatment with 1.0% TFA for JMJD2c and 1% FA for ACHe.
Assays
JMJD2c Assay
The JMJD2c MS assay has been described previously by Hutchinson et al. 20 In this assay, the disappearance of H3K9Me3 histone peptide substrate m/z 1531.1 and the formation of H3K9Me2 (m/z 1517.1) histone peptide product were monitored. Assays were performed by dispensing 2.5 µL of enzyme solution typically containing 250 nM JMJD2c and 0.25 mg/mL BSA in 50 mM MES (pH 7.0) into 1536-well HiBase microtiter plates containing 50 nL compound or DMSO. Plates were incubated at ambient temperature for 10 min, before reactions were initiated by the addition of 2.5 µL substrate solution containing 50 μM ascorbic acid, 10 μM α-ketoglutarate, 50 μM Fe(NH2)2(SO4)2, and 10 μM H3K9Me3 peptide in 50 mM MES (pH 7.0). Plates were centrifuged at 1000 rpm for 1 minute, and the reactions were incubated at ambient temperature for typically 16 min before being quenched by the addition of 5 µL of a 1% (v/v) TFA solution. For the enzyme-inactivated controls in columns 35 and 36, 5 µL of 1% TFA was dispensed prior to addition of the enzyme solution. For enzyme titration and time course experiments, JMJD2c concentrations ranged from 8 to 500 nM with a maximum reaction time of 60 min.
Acetylcholinesterase Assay
The ACHe assay was based on a method described previously by Rathore et al. 21 In this assay, the formation of product choline (Ch; m/z 104.1) and the disappearance of substrate acetylcholine (ACh; m/z 146.1) by the reaction of ACHe were measured. Assays were performed by dispensing 2.5 µL of enzyme solution typically containing 500 pM ACHe in 40 mM Tris-Cl (pH 7.5) into 1536-well HiBase microtiter plates containing 50 nL compound or DMSO. Plates were incubated at ambient temperature for 10 min, before reactions were initiated by the addition of 2.5 µL substrate solution containing 25 µM ACh in 40 mM Tris-Cl (pH 7.5). Plates were centrifuged at 1000 rpm for 1 minute, and the reactions were typically incubated at ambient temperature for 10 min before being quenched by the addition of 5 µL of a 1% (v/v) FA solution. For the enzyme-inactivated controls in columns 35 and 36, 5 µL of 1% FA was dispensed prior to addition of the enzyme solution. For enzyme titration and time course experiments ACHe concentrations ranged from 500 pM to 4 nM, with a maximum reaction time of 60 min.
For both JMJD2c and ACHe experiments, all solutions were dispensed using a Multidrop Combi dispenser (Thermo Fisher Scientific, Waltham, MA), and plates were centrifuged for 10 min at 1000 rpm prior to MALDI MS spotting.
MALDI MS Target Preparation and Spotting
PAC384 MALDI targets were cleaned using 80% ethanol and 20% water (v/v) and allowed to air-dry. CHCA matrix solution (7 mg/mL) was prepared in 70% methanol (prepared in HPLC-grade water containing 0.2% [v/v] TFA). Sample deposition resulted in a “sandwich” of 25 or 100 nL matrix/analytes/matrix spotted onto the target in either a 1536- or 6144-spot format using the Mosquito nanoliter dispenser (TTP Labtech). Briefly, 25 or 100 nL of CHCA matrix solution was dispensed from a V-bottomed 384-well plate (Greiner) onto a cleaned AnchorChip PAC 384 HCCA plastic target plate held within a metal MTP PAC Frame. Following the initial matrix spot, 25 or 100 nL of assay sample was dispensed from a 1536-well HiBase microtiter plate, followed by a further 25 or 100 nL of matrix (alternatively, the initial 25 or 100 nL matrix spot could be added to the target up to 3 days prior to the sample addition and stored at 4 °C). After each dispense, the tips were washed with HPLC-grade methanol from a V-bottomed 384-well plate (Greiner). Spotted targets were air-dried prior to MALDI-TOF MS analysis. The completed MALDI targets were then scanned using a Ziath Fi-60F plate scanner.
MALDI MS Analysis
A Bruker UltrafleXtreme MALDI-TOF/TOF instrument (Bruker Daltonics, Bremen, Germany) was used in reflector positive mode. Depending on the selected analytes, mass spectra were acquired in the range of either m/z 80–1400 or 700–3500, with 200 laser shots per sample spot (4 × 50 laser shots in random walk mode). External calibration was performed using a Bruker peptide II calibration standard and matrix peaks. FlexControl software v3.4 (Bruker Daltonics) was used to control the data acquisition, and FlexImaging software v4.0 (Bruker Daltonics) allowed the generation of the geometric information for each target configuration. Within the FlexImaging software, the spot microarray preparation mode was chosen, which enables the Teach sample option. Three Teach points (top left, top right, and bottom right sample spots) were set to map the image coordinates to the sample carrier (MALDI target plate) positions, ensuring that the three Teach points resulted in a rectangular shape. The number of spots was then specified in both the horizontal and vertical directions (e.g., x = 48 and y = 32 for 1536 plates). Custom scripts written for use in FlexAnalysis software v3.4 (Bruker Daltonics) and Microsoft Excel (Microsoft Corporation, Redmond, WA) were employed for data processing and analysis.
Data Analysis
Peak area data were extracted from the FlexAnalysis output using a custom Microsoft Excel macro (GSK, Stevenage, UK) and reported as the percent conversion of substrate to product, calculated using eq 1 for the JMJD2c assay:
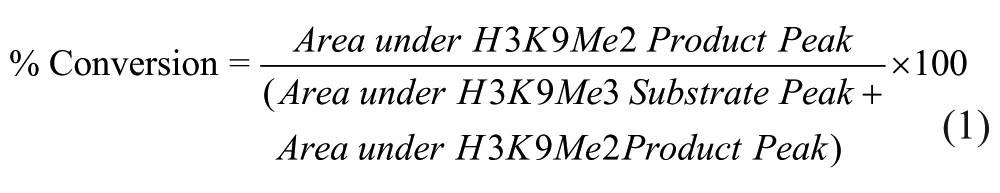
For the ACHe assay, a correction factor was applied to the acetylcholine substrate peak area to account for a sixfold increase in ionization sensitivity observed compared to the product choline. The percent conversion was therefore calculated using eq 2:
Data were analyzed within ActivityBase Suite (ID Business Solutions Ltd., Surrey, UK). Single-concentration data were expressed as percent inhibition using eq 3:
where conversion is the percent conversion calculated for the compound, and uninhibited and inhibited controls are the averages of the uninhibited and inhibited controls, respectively, from columns 11 and 12 or 35 and 36 of the plate. For concentration–response screening, pIC50 values were calculated by fitting the data to a four-parameter logistical equation:

where a is the uninhibited value, d is the fully inhibited value, [I] is the inhibitor concentration, IC50 is [I] that gives 0.5 × (a – d), and h is the Hill slope.
For graphical representation, data were extracted from ActivityBase and replotted in GraFit v7.0.3 (Erithacus Software, Surrey, UK).
Results and Discussion
Optimization of MALDI Target Nanoliter Dispensing
Initially, analytical methods for substrates and products of both JMJD2c and ACHe enzymatic reactions were generated and work completed to optimize the dispensing of reaction mixtures directly from 1536-well assay plates onto a MALDI target using the Mosquito. For the JMJD2c assay, both substrate and product could be detected in a linear fashion from 1 to 120 µM, with similar peak intensities observed for the H3K9Me3 and H3K9Me2 peptides (within twofold), suggesting similar ionization efficiencies of the two analytes (
Metal 1536-format AnchorChip MALDI targets are available, but for the work described here, a plastic prespotted 384-well AnchorChip (PAC) target, wiped clean with ethanol and water to create a blank surface, was used. This was because our overall aim was to understand the greatest density at which targets could be spotted with samples, to minimize plate movements into and out of the mass spectrometer, and we did not want to restrict ourselves to the 1536 format, although this was used in the first instance. It was found that 100 nL dispenses gave very reproducible spotting, although dispenses down to 25 nL could be tolerated by the Mosquito. Spotting of the assay mixture was more reproducible, and less prone to samples merging together, when a matrix spot was applied to the target first, and the detection of analytes was improved when a final layer of matrix was also added on top of the assay sample, to create a sample sandwich with the matrix. A scanned image of a target prepared in this manner is shown in
Initial Assay Development
Having established analytical and target spotting methods, the ability to detect enzymatic turnover was assessed by performing a reaction time course over varying protein concentrations. Substrates were maintained at concentrations used for existing RF-MS assays. For both targets, final assay conditions close to or equal to those used for existing RapidFire assays were selected. Figure 1A shows the protein titration and linearity for the demethylase reaction, in which 250 nM JMJD2c was linear up to 16 min, consistent with the RF-MS assay described by Hutchinson et al. 20 These conditions gave a robust and reproducible response that was used for all subsequent experiments. With a protein concentration of 250 nM, the theoretical tight binding limit of 125 nM (based on half-enzyme concentration and 100% fractional activity) may limit accurate determination of high-potency compounds (IC50 > 125 nM), resulting in an underestimation of activity. Although this may be a concern for structure–activity relationship screening, it is less of a concern for hit identification, with hits typically within the high nanomolar to micromolar range. Wigle et al. 23 recently reported a JMJD2c SAMDI assay run at 2.5 nM enzyme concentration, significantly lower than both the RF-MS and MALDI-TOF formats discussed here. Clearly, different preparations of JMJD2c enzyme may have different activities; however, based on the data generated, it may also be possible to lower the enzyme concentration and run the reaction for longer with the existing batch of protein.
Development of the JMJD2c 1536 MALDI-TOF mass spectrometry assay. (
For the ACHe assay, the relationship between ACh turnover and concentration of ACHe, and a measure of reaction linearity, is shown in Figure 2A . ACHe at a concentration of 500 pM was chosen for the screening assay, with a reaction time of 10 min, again for consistency with the current RF-MS assay run in-house. In the MALDI assay, this resulted in approximately 60% conversion of ACh to Ch, which is quite high, although as it is still within the linear portion of the reaction, no effect on inhibitor pharmacology would be expected.
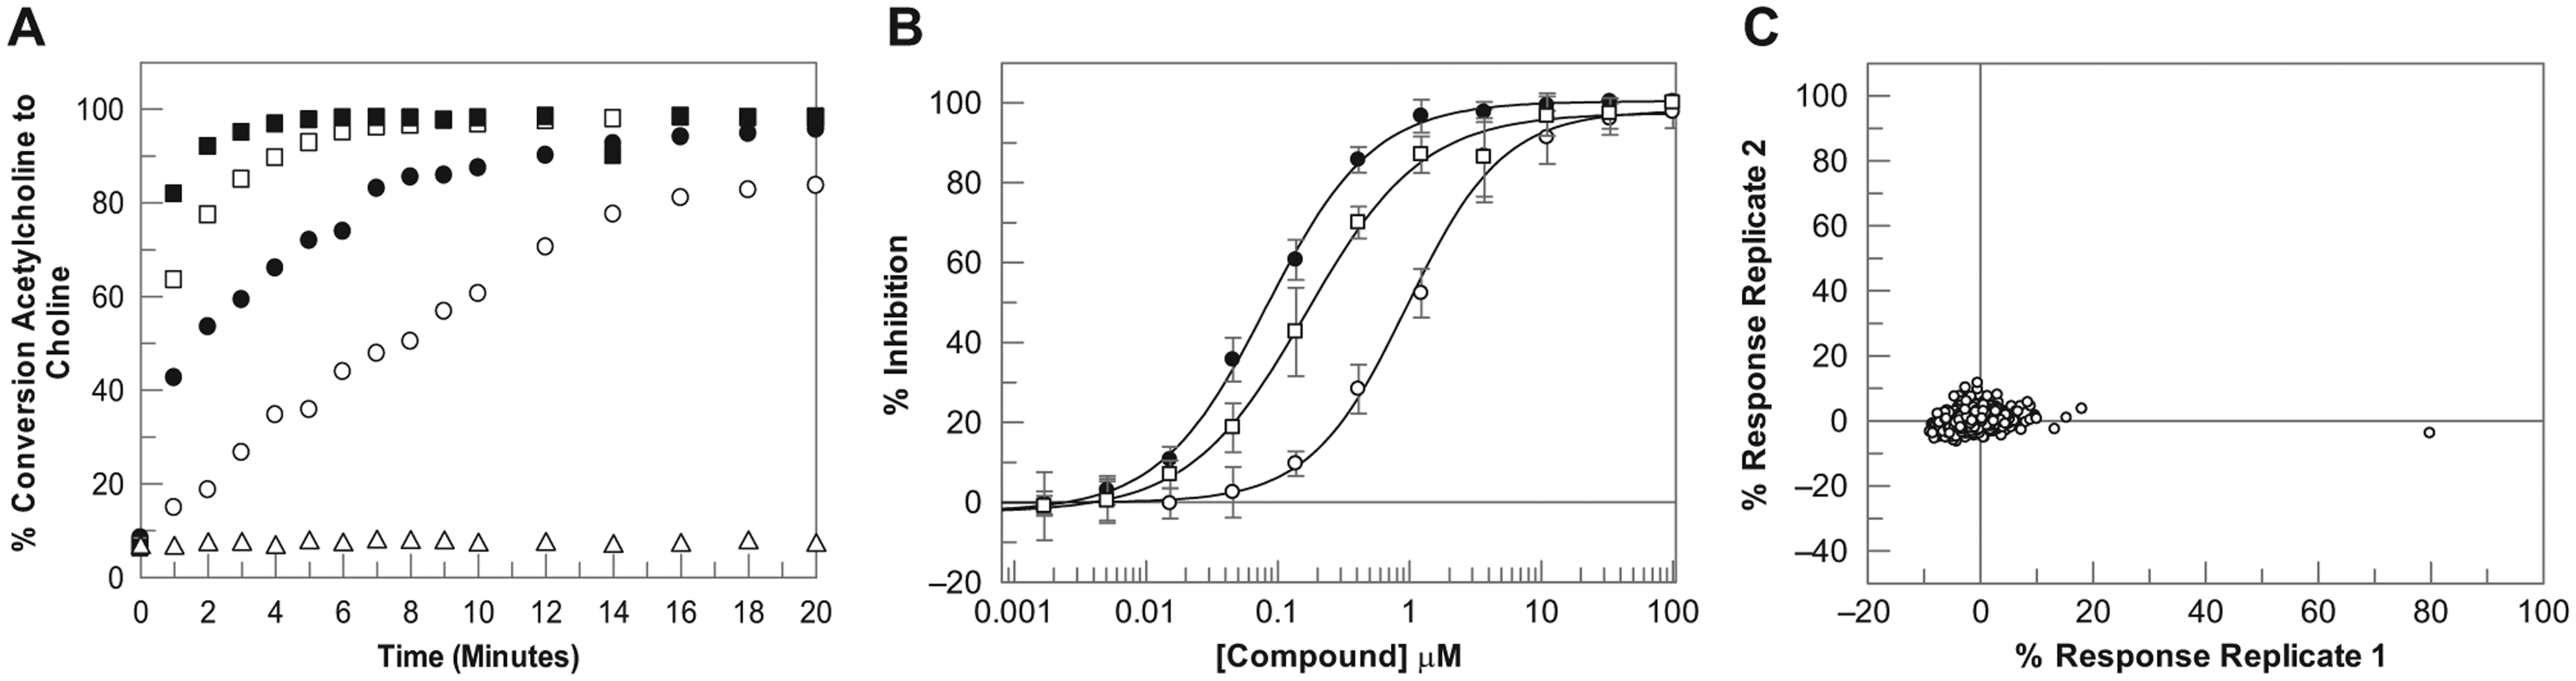
Development of the ACHe 1536 MALDI-TOF mass spectrometry assay. (
To validate the final assay conditions for each target, concentration–response curves for known inhibitors were generated in each of the respective assays. For JMJD2c, this set consisted of 105 compounds, including 2,4-pyridinedicarboxylic acid, 24 which binds at the α-ketoglutarate binding site, and two known histone lysine demethylase inhibitors from the 8-hydroxyquinoline (8-HQ) chemotype. 25 For ACHe, this set consisted of 23 compounds, including marketed ACHe inhibitors Aricept, Tacrine, and Galantamine.26,27 IC50 plots for representative literature compounds are shown in Figures 1B and 2B for the JMJD2c and ACHe assays, respectively. The data show that high-quality IC50 curves were generated in 1536 MALDI-TOF format, with IC50 values and rank order consistent with literature data. pIC50 values were also highly consistent with data generated in the RF-MS 384-well format for both targets ( Fig. 3 ). For JMJD2c, the correlation coefficient was 0.83 including all data. Three compounds reported as inactive in the MALDI-TOF assay (pIC50 < 5.0, n = 3) but were active in the RF-MS format, although it should be noted that the RF-MS data used for the correlation plots were historical data, rather than data generated from the same master plate of compound, and therefore it is possible that for these three compounds, some degradation of the compound sample or a sample preparation misdispense could have contributed to the lack of activity observed by MALDI-TOF. Excluding these three data points, the correlation coefficient was 0.91. For ACHe, pIC50 values were also comparable to the RF-MS 384-well format, with a correlation coefficient of 0.95.
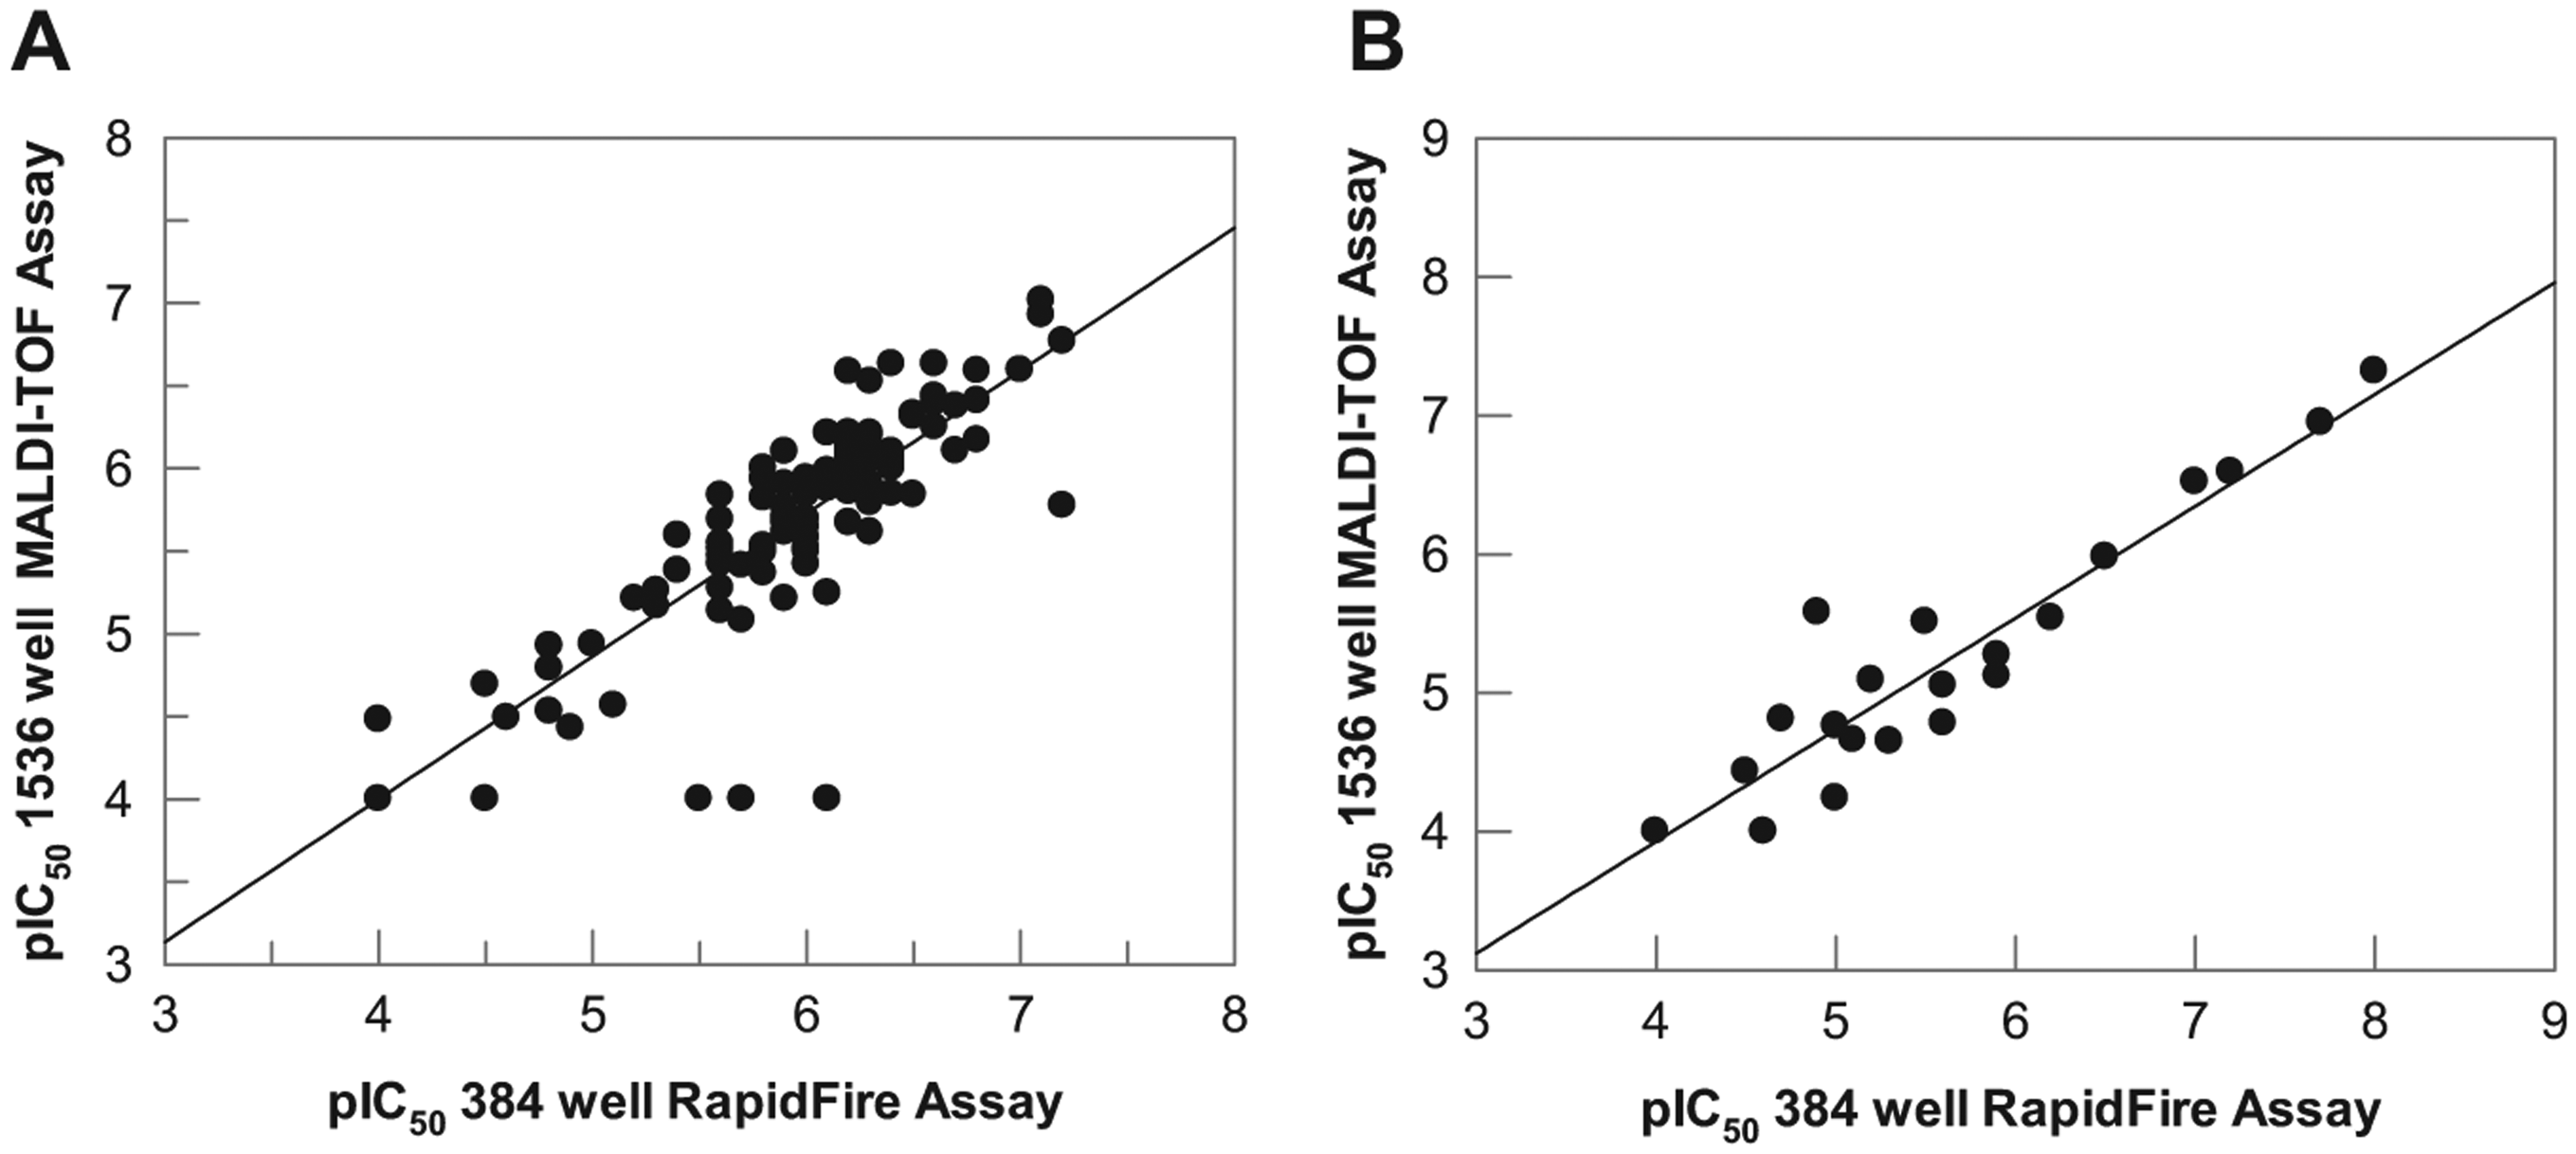
Correlation of pharmacology for (
Single-Concentration Validation and Assay Scale-Up
To validate MALDI-TOF for single-concentration screening, the robustness and reproducibility of spotting deposition and MALDI-TOF analysis were assessed. Assays were examined in duplicate using a diverse set of 1000 compounds, each at 10 µM final assay concentration. A plate containing DMSO in each well was also screened to assess variation across a plate. Assays displayed a highly robust, reproducible response with Z′ values of 0.87 and 0.89 for JMJD2c and 0.81 and 0.83 for ACHe. No patterns were observed across plates, with DMSO samples clustered tightly around 0% ( Figs. 1C and 2C for JMJD2c and ACHe, respectively). These data demonstrate the applicability of the MALDI-TOF workflow for JMJD2c and ACHe for single-concentration screening in 1536-well format. Mass spectra for exemplar high and low control wells in each assay are shown in Figure 4 . The ability to directly measure signals associated with both substrate and product of the reaction permits normalization of data, thereby minimizing errors that may result from variability in sampling volume and matrix crystallization. Product normalization to an internal standard would also address these variability issues and could make this technology more amenable to reactions with low turnover rates; however, it would add to the cost per well of the assay.
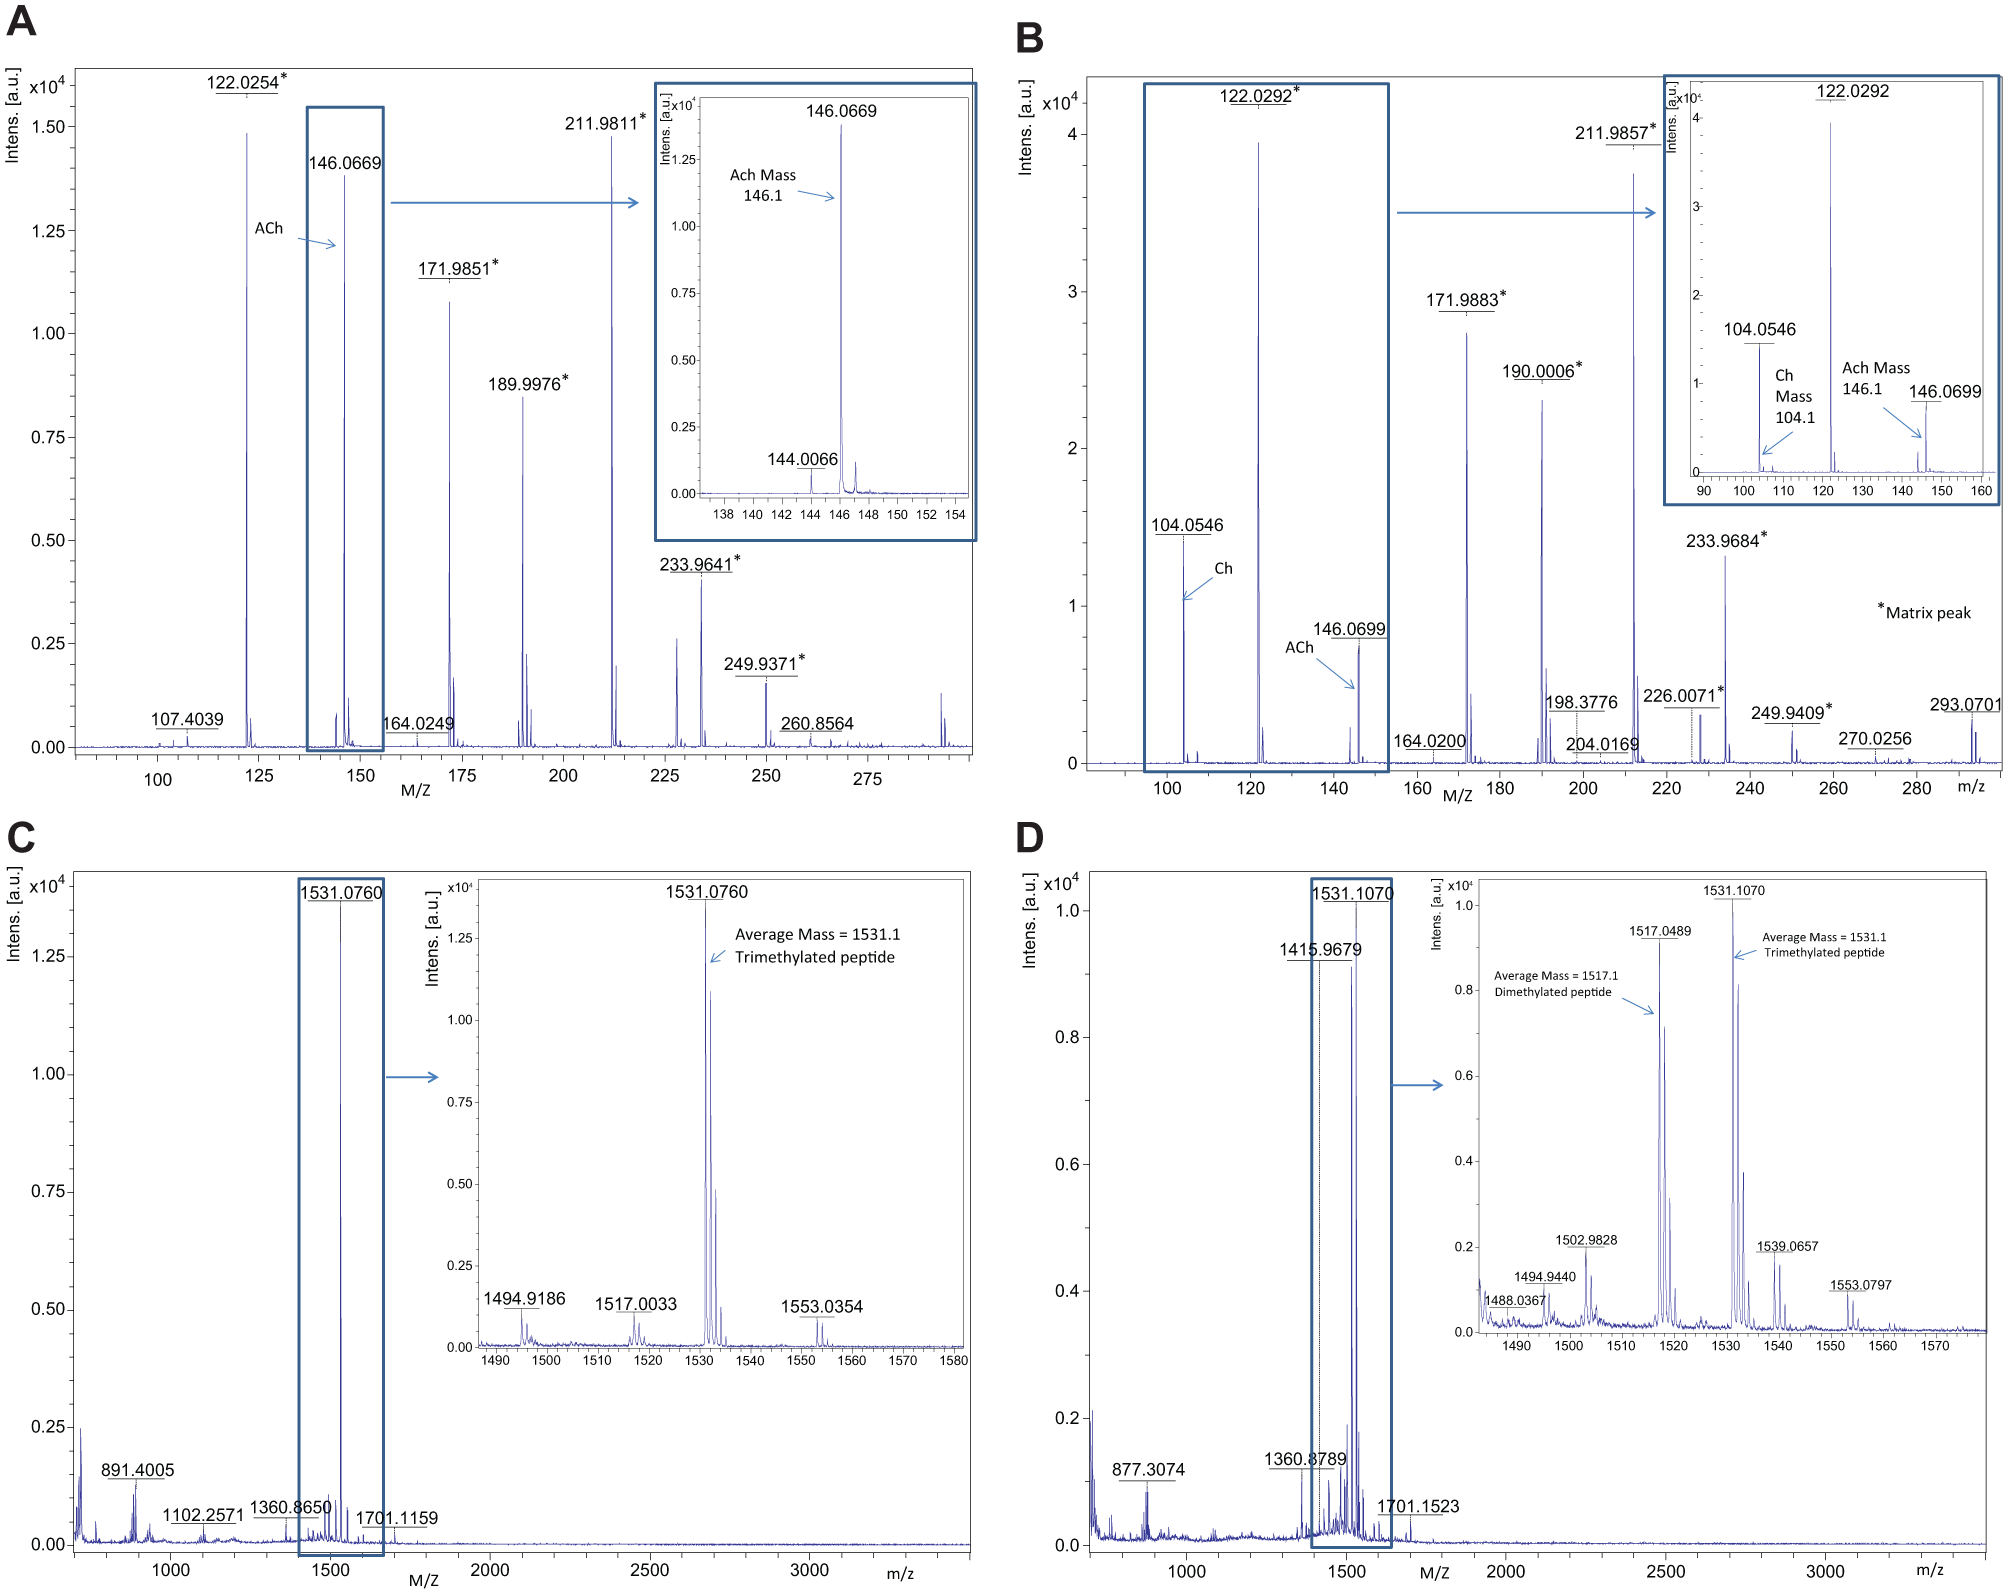
Mass spectrum of exemplar wells from the high and low controls of the ACHe and JMJD2c assays. (
Having established and validated the overall workflow and demonstrated appropriate assay robustness and equivalence of data to existing RF-MS assays, it was important to demonstrate that this process is scalable. A diverse compound set containing 10,000 compounds, broadly representative of the GSK HTS compound collection, was screened against both JMJD2c and ACHe in duplicate. Each experimental occasion totaled nine 1536-well assay plates (including a pharmacology and DMSO plate). The mean Z′ values of the two replicates were 0.67 and 0.75 for JMJD2c and 0.74 and 0.48 for ACHe. The lower Z′ value in the second replicate of ACHe was due to two plates having higher variability in the low control and giving a Z′ value of 0.39, lowering the overall mean. The cause of this is being investigated. The percent coefficient of variation for plates was ~5% for JMJD2c and ~2% for ACHe and was consistent within assay runs and between different assay runs on the same day, demonstrating the robustness and reproducibility of this technique. The robust cutoffs, calculated as the mean plus three standard deviations of the sample response, for the two replicates were 20.9% and 22.7% for JMJD2c and 23.5% and 29.2% for ACHe.
The hit rate at JMJD2c was extremely low, with only 0.2% compounds identified above the robust cutoff. This was lower than expected, as a 1000-compound validation set previously screened in the RF-MS assay format gave a hit rate closer to 2%. 20 However, the robust cutoff in that case was ~16% inhibition, and the data showed that most of the hits were very weak, as is common with novel targets such as epigenetic enzymes. With a slightly increased cutoff, in this case closer to 20%, it is feasible that very few compounds remained active. A 20% cutoff is, however, still very acceptable and would enable the identification of micromolar hits. Based on this extremely low hit rate, this set was not suitable to determine HTS-like robustness and reproducibility, and a second experiment was therefore performed using DMSO plates with known JMJD2c inhibitors derived from the 105-compound pharmacology validation set spiked in random locations. Thirty-eight compounds were chosen to give a wide range of response levels (0%–100%) and screened at final assay concentrations of 1 and 10 µM in quadruplicate across a 1536-well plate. Figure 5A shows that the two replicates had a very good correlation (correlation coefficient of 0.97), and compounds gave response levels and rank order in close agreement to the values derived from the pharmacology set, validating the ability of this assay to identify known inhibitors across a range of potencies in a single-concentration screening format. Figure 5B details the 10,000-compound set data generated for ACHe. In this assay, the robust hit rate was higher but still in line with expectations for an enzyme target, at 1.4% and 1.8% for the two replicates, respectively, and the correlation between replicates was good (correlation coefficient 0.83). A spiked set was therefore not screened for ACHe, as the 10,000 set was deemed sufficient to validate this target.
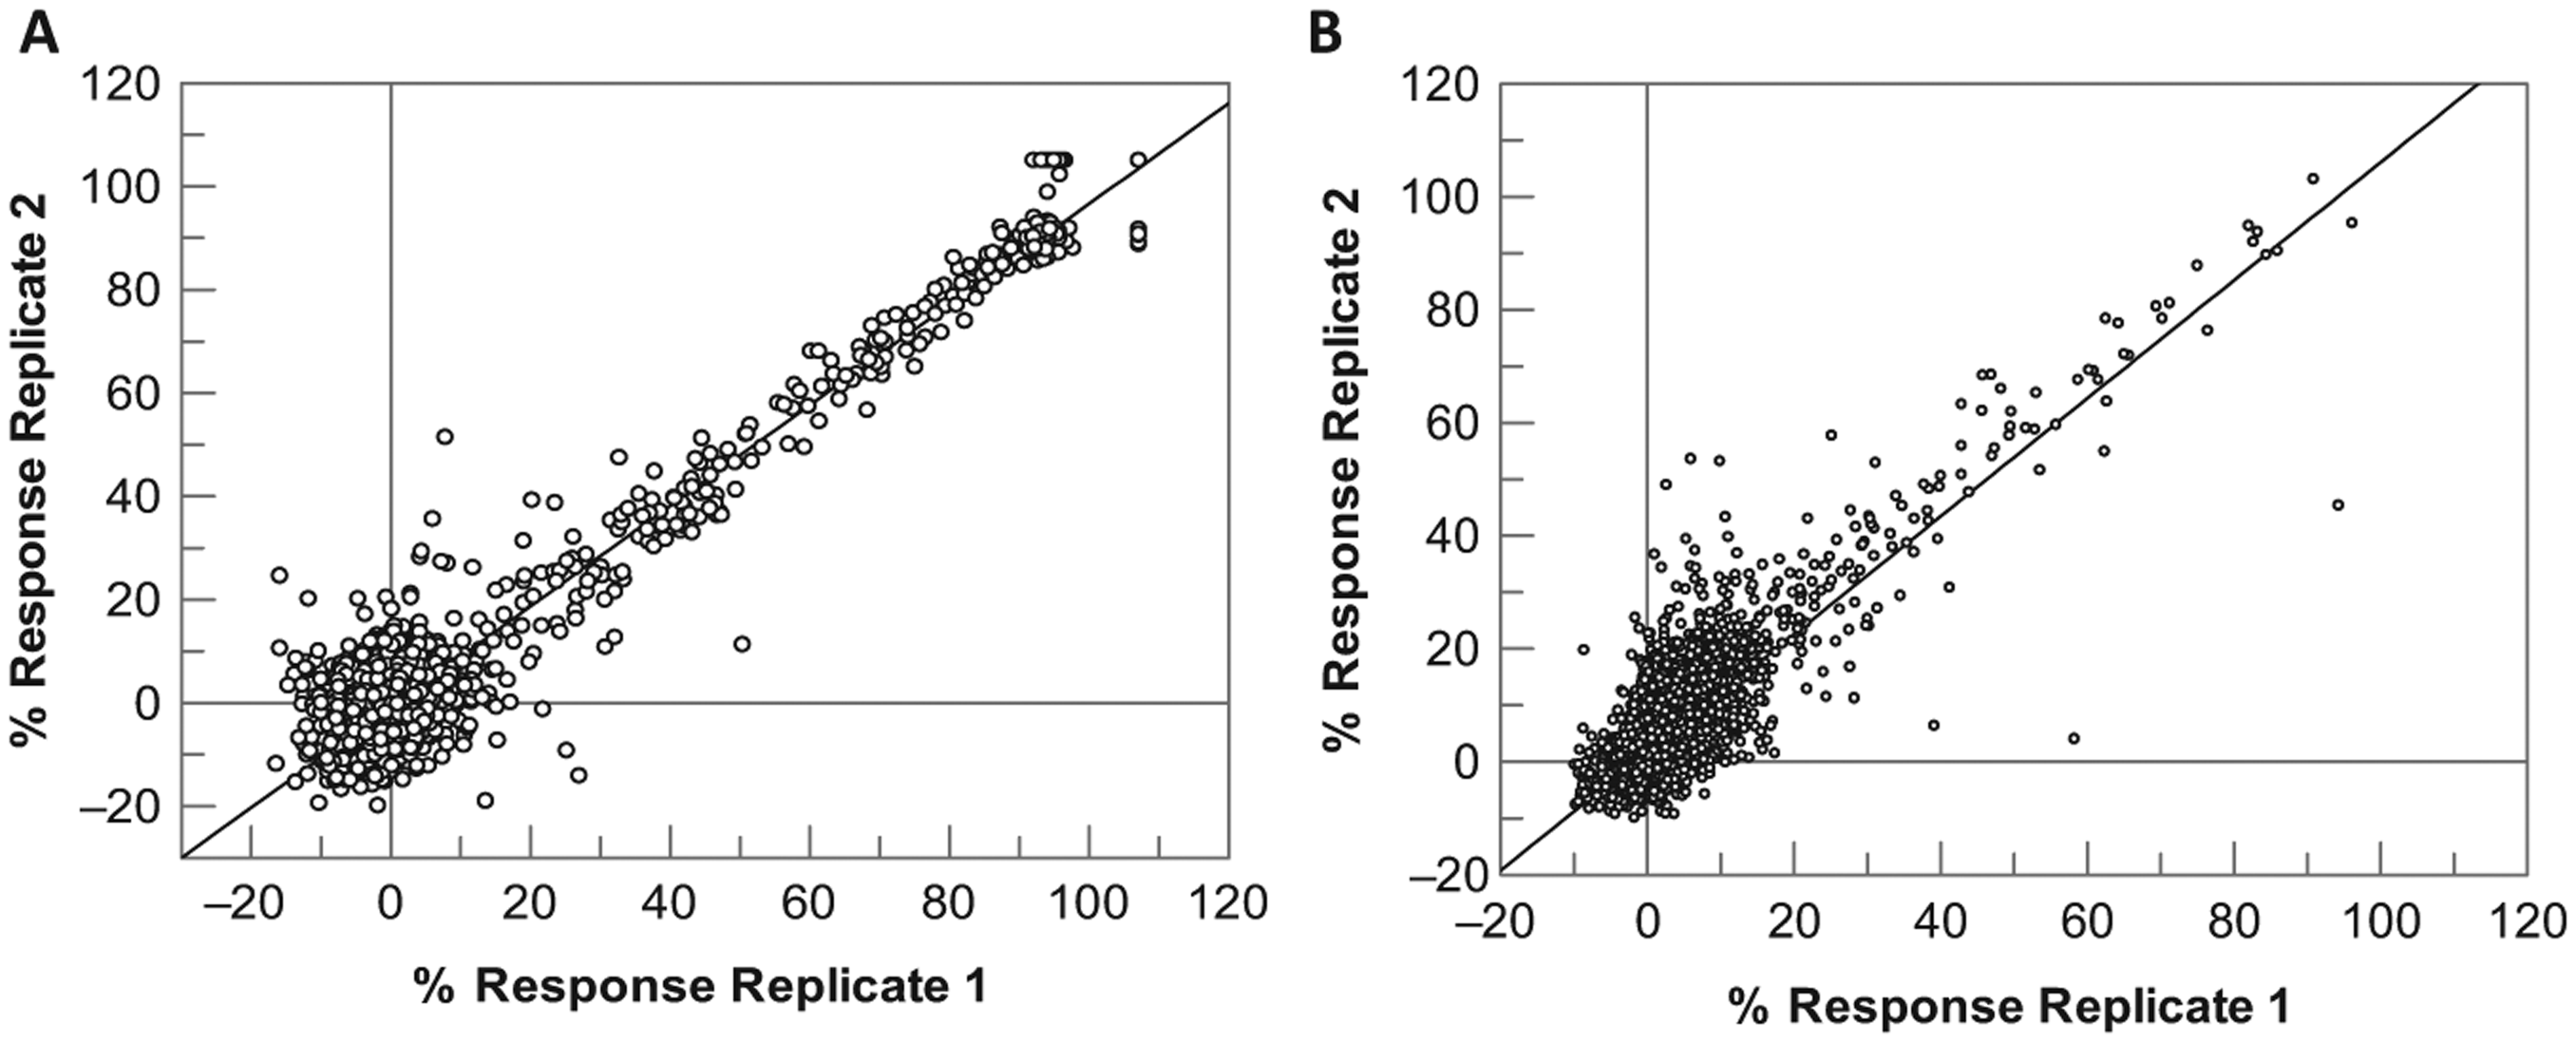
(
Throughout the validation testing, it was observed that a number of wells gave no result (NaN reported in ActivityBase). This totaled 0.9% in the 10,000 validation set for JMJD2c, and these results were excluded from further analysis in both assays. It was believed that this was as a result of inaccurate MALDI laser firing, whereby the laser missed the sample/matrix spot and no signal was generated. To overcome this in the future, the addition of a reference standard or monitoring of a suitable matrix ion to check the accuracy of the laser would allow identification and flagging of these wells. Unlike many fluorescence assay artifacts that can only be identified through downstream orthogonal assays, often much later in the hit ID process and potentially leading to wasted effort, the missed results described here, while not ideal, are easily flagged during the primary screen, and compounds in missed wells could be ordered for rescreening. Ultimately, it is possible to reanalyze the sample on the MALDI-TOF without rerunning the biology, either by respotting the sample (as only 100 nL of a 10 µL assay mixture was used) or by manually reanalyzing the sample spot by MALDI-TOF, although in HTS or uHTS this would be less than ideal for logistical reasons. Further work is ongoing to try and minimize this effect either by further optimization of the nanoliter dispensing to ensure samples are spotted evenly across the plate or by providing the MALDI-TOF software with a “spot coordinates” file, rather than calibration against three fixed points and then relying on spots being a fixed distance apart.
Application for uHTS
The data generated at the 10,000-compound scale demonstrate that the MALDI-TOF process described here is, with some additional optimization, suitable for screening multiple 1536-well plates and could therefore be applied to HTS and uHTS workflows. The analysis speed of 1.2 s/sample gives a read time of ~30 min/1536-well plate, and low sample volumes (reaction volume 5 µL and MALDI deposition 100 nL) make this assay format comparable to some fluorescence-based technologies. As no antibodies or fluorescent probes are required, the cost per well of the MALDI-TOF assays is also attractive compared to many traditional technologies, at just 2–3pence/well, assuming target surfaces can be reused five times, which should be feasible based on our experience. One could also envisage further miniaturization of the assay reaction itself, down to 1–2 µL or less, given that only 100 nL of sample is required for analysis, which would further reduce cost. However, in the experiments described here, the movement of plates into and out of the mass spectrometer and concurrent cycling of the vacuum took 5 min/1536-well target. Additionally, a cautious approach to keeping the mass spectrometer clean was adopted, with a laser source clean performed after each target, which added a further 20 min, taking the total read time per 1536-well plate to almost 1 h. While ~4 times faster than commonly employed SPE-MS systems, a screen of 2 million compounds would still take ~3 months at this read rate using a fully automated setup. In order to push this technology to the uHTS scale, both of these points would therefore need to be addressed.
One option for reducing the time for plate movements into and out of the mass spectrometer is to increase the density of spots upon the MALDI target plate. We were able to increase the density to 6144 (4 × 1536 format) by dispensing a volume of 25 nL, rather than 100 nL, per sample on the Mosquito and introducing an offset to enable spotting in between standard well locations, as shown in
To assess assay quality and reproducibility at 6144 density for both full-curve and single-concentration screening, the spiked DMSO plate previously tested against JMJD2c and the pharmacology plate of ACHe inhibitors were rescreened in this format. Data quality was reduced compared with the 1536 density, with Z′ ~ 0.0–0.5 for the two assays, likely due to reduced accuracy and uniformity of spotting when operating at the limit of the Mosquito’s capability. However, despite this reduced assay quality, the final results obtained in terms of either percent response or pIC50 of inhibitors correlate well between the 1536 and 6144 methods ( Fig. 6 ), with correlation coefficients for both assays of 0.98. Clearly, the reduction in assay quality is a concern, but the results suggest that with further optimization of the spotting methodology, this could be a viable method for increasing throughput. With source cleaning every 10 plates and a 6144 spotting density, a screen of 2 million compounds could be completed in 2 months. Although still slower than a typical fluorescent-based primary screen, which can be completed in less than 1 month, this time frame is likely to be short enough that the benefits of a label-free readout and the subsequent reduction in hit confirmation assays and risk of progressing false positives begin to outweigh the loss of speed.
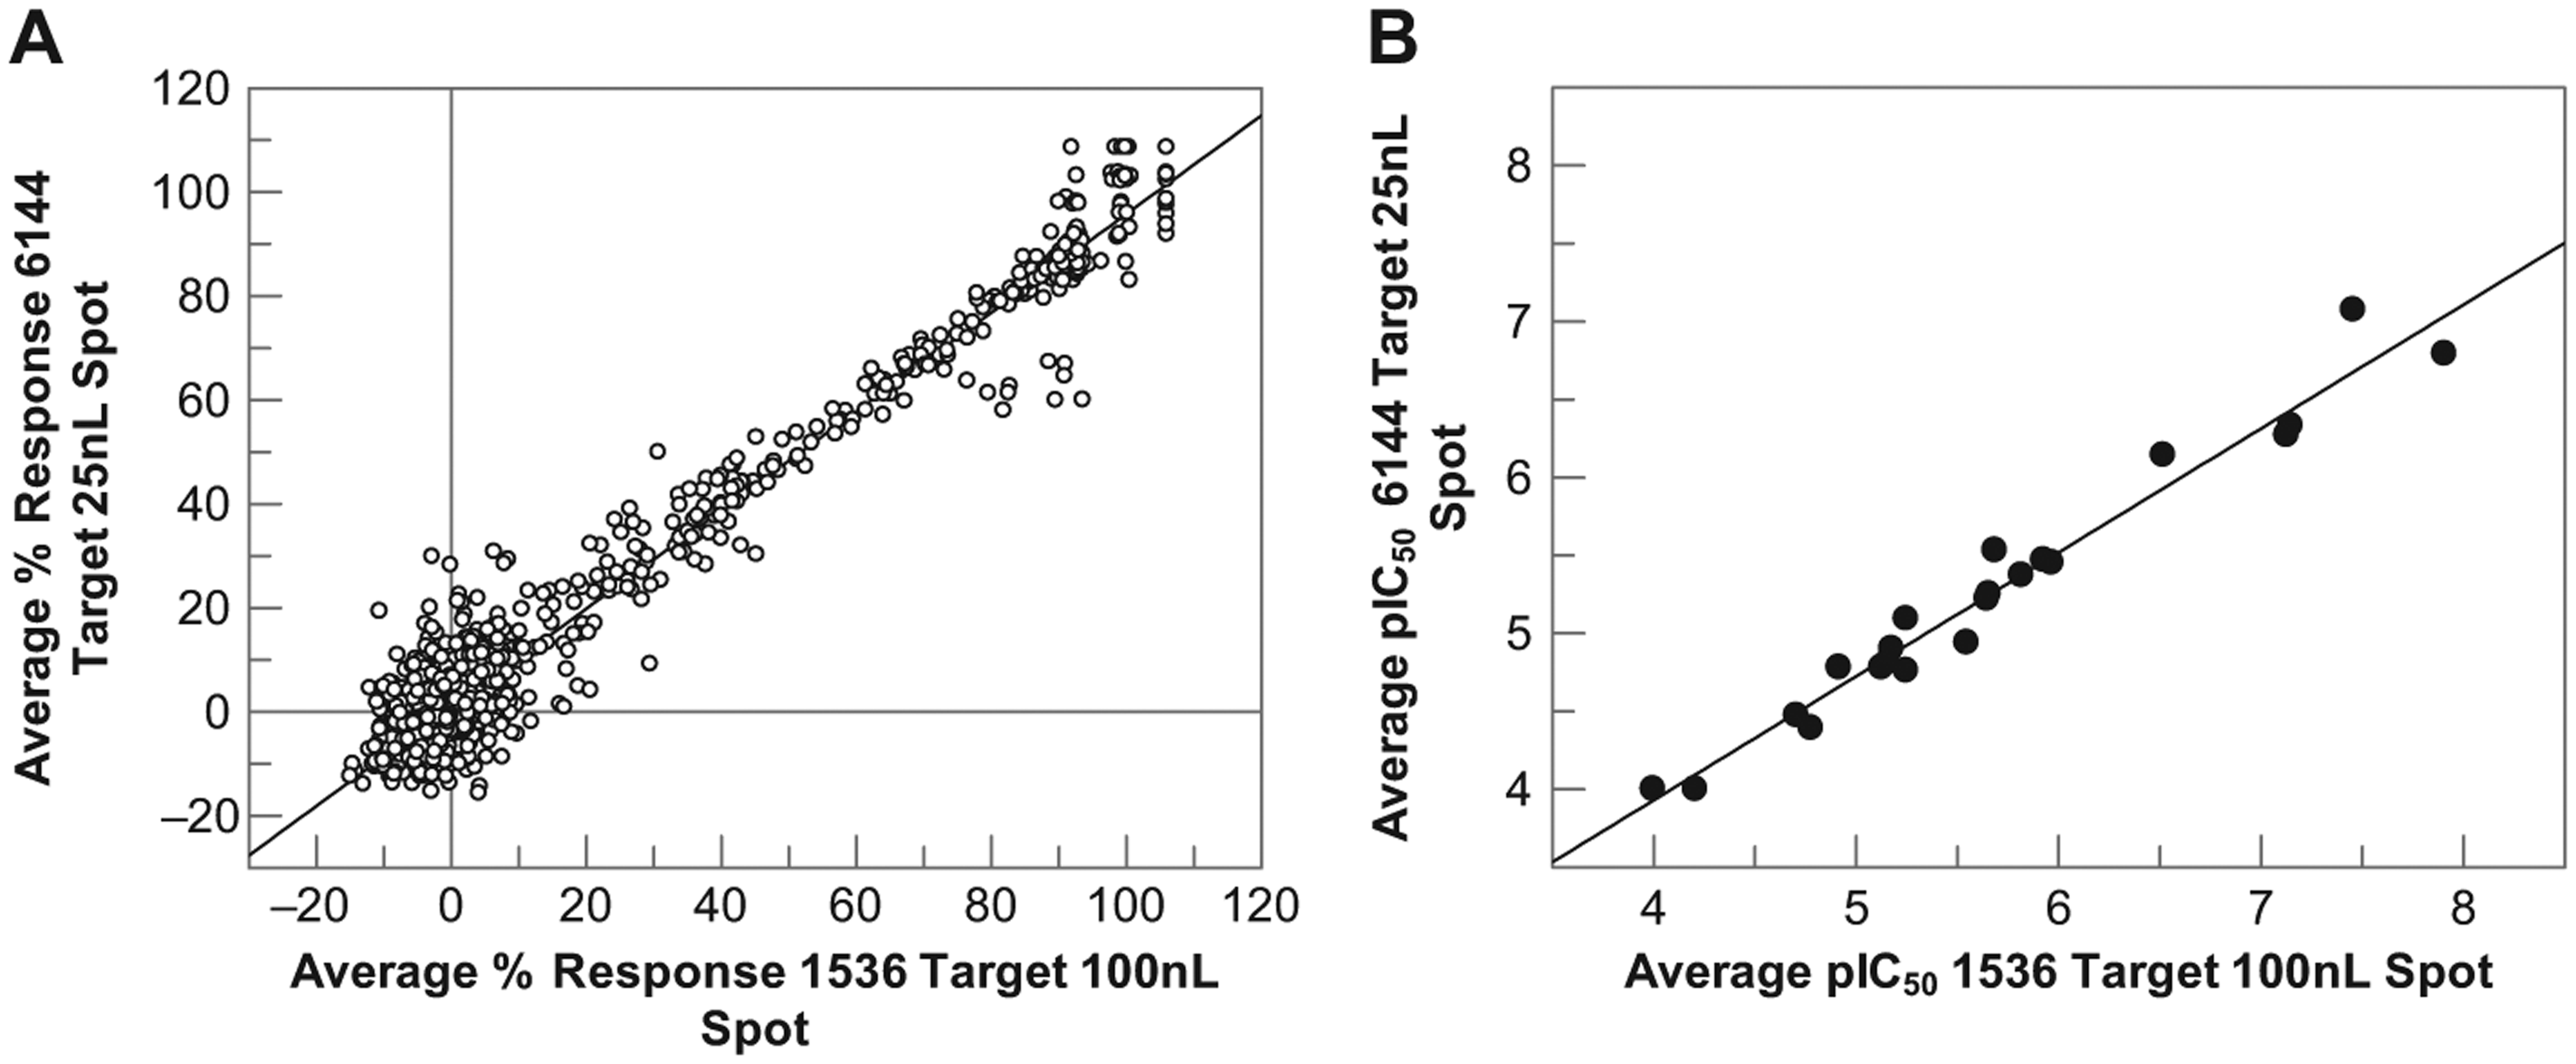
Correlation of (
Another consideration for an uHTS technology is the breadth of application to multiple targets across an assay portfolio. Historically, matrix ion interference at low mass ranges has been considered a limitation for the use of MALDI-TOF for assays involving small-molecule analytes. The ACHe example described here, however, demonstrates the utility of this technology for a small-molecule analyte-based assay, suggesting that the technique can be applied more broadly across an enzyme assay portfolio. In fact, unless there is a specific clash of m/z between a known matrix ion and the analyte of interest, matrix interference should be of minimal concern. However, careful choice of matrix is advisable and matrix–analyte compatibility should be evaluated prior to study commencement. Of greater concern is the effect of ion suppression due to the buffers, salts, and other assay components used, due to a lack of sample cleanup when compared to SPE HT-MS methods. Unfortunately, MALDI MS is vulnerable to the composition of the sample, and unpredictable decreases in signal can sometimes be observed, particularly in the presence of high levels of salts. Similarly, decreases in signal intensities can arise due to the matrix application; that is, poor matrix crystallization has occurred. The use of an internal standard could flag these potential problems during the sample preparation and analytical process, and the cost of this should be carefully balanced with the benefit it could bring, which will likely be assay dependent. It should be noted that both assays described here were performed in simple buffer systems and a homogenous mixture of matrix was observed, resulting in minimal ion suppression in the MS source. To understand the full potential of MALDI-TOF as a screening technology, evaluation of assays with more complex matrices is required. Indeed, although the application described here is focused on biochemical target-based screening, MALDI-TOF has been successfully used for analysis of intact proteins from cell and tissue samples, 28 albeit at low throughput; hence, it may be possible to extend the application space further if complex matrices are tolerated. The breadth of the application described here is also limited to enzymatic reactions where a mass change is observed between substrate and product. Other label-free techniques, such as affinity selection–mass spectrometry (AS-MS), may be better suited to targets where binding events are the primary readout, and these methods are also gaining acceptance in high-throughput screening laboratories. 29
In conclusion, the work described here demonstrates the potential utility of MALDI-TOF for HTS and uHTS applications. The technology offers data comparable to that of well-characterized SPE-MS methods, but with sample throughput and assay volumes more suited for full-diversity screening. While groups have reported high-throughput screens in MS-based systems previously, these often require a high-volume 384-well format, and throughput is achieved through either multiplexing 7 or compound pooling, 30 both of which require alterations to standard screening logistics and complicated data analysis. The work described here allows data input directly into standard 1536-well analysis workflows. Although ultimately the throughput of mass spectrometry may never match that of the most simple “mix and read” fluorescent technologies, the benefits of screening with a direct, label-free detection and reduced risk of progressing false positives will save time and cost later in the process by reducing the need for extensive deconvolution activities. The evolution of MALDI-TOF-based methods and advances in liquid handling makes this a viable future option for uHTS applications in 1536-well format and beyond.
Footnotes
Acknowledgements
The authors would like to thank Andrew Leach and Stuart Baddeley for their sponsorship of this project. We thank those at TTP Labtech for their technical support. We also thank Jon Williams, Stan Martens, and other members of Platform Technology and Sciences for their intellectual input and technical advice.
Declaration of Conflicting Interests
The authors declared no potential conflicts of interest with respect to the research, authorship, and/or publication of this article.
Funding
The authors received no funding for this work. Everything was completed as work-for-hire for the employer GSK.
References
Supplementary Material
Please find the following supplemental material available below.
For Open Access articles published under a Creative Commons License, all supplemental material carries the same license as the article it is associated with.
For non-Open Access articles published, all supplemental material carries a non-exclusive license, and permission requests for re-use of supplemental material or any part of supplemental material shall be sent directly to the copyright owner as specified in the copyright notice associated with the article.