
Abstract
Phenotypic screening enables the discovery of new drug leads with novel targets. ES cells differentiate into different lineages by successively making use of different subsets of the genome’s possible macromolecular interactions. If a compound effectively targets just one of these interactions, it derails the developmental pathway to produce a phenotypical change. The OTRADI microsource spectrum library of 2000 approved drug components, natural products, and bioactive components was screened for compounds that can induce phenotypic changes in ES cell cultures at 10 µM after 3 days. Twenty-one compounds that induced specific morphologies also induced unique changes to an expression profile of a dozen markers of early embryonic development, indicating that each compound has derailed the molecular developmental process in a characteristic way. Phenotypic screens conducted with ES cultures differentiating along different lineages can be used to efficiently prescreen compounds able to regulate cell differentiation lineage.
Keywords
Introduction
Normal embryonic development transforms the fertilized egg cell into a large variety of cell types, first by differentiating cells along different proliferative lineages, and then by causing most cells of these lineages to permanently exit the cell cycle and enter classic tissue differentiation pathways to become the specialized cell types observed in the adult body. Adult cell types were traditionally identified by anatomical, morphological, and physiological criteria, and more recently, they have also become associated with gene expression criteria. Many of the cell types that exist in embryos during the pattern formation phase of development do not exist in adults. They are generally defined by a combination of anatomical location in the embryo and combinatorial codes of sequence-specific transcription factor (SSTF) expression. They are transient and depend on very particular precursor cell types (with their own, distinct SSTF codes) to be exposed to very particular spatial signaling contexts, provided by their anatomical position in the embryo, to come into existence. Such cell types appear to be transiently stable regulatory states whose stability, or existence, depends on the continued coexpression of each SSTF in their SSTF code. They generally have not been stably cultured and cannot be independently identified by morphological and physiological criteria. One notable exception is the regulatory state stabilized by the coexpression of Oct4, Nanog, and Sox2, which is the totipotent embryonic stem (ES) cell type.1,2
Correct mammalian embryonic development is exquisitely sensitive to the correct deployment and function of a progression of macromolecules. These include peptide ligands, cell surface receptors, second messengers, and SSTFs. Various flavors of each of these protein classes are normally deployed successively, in overlapping patterns, by different cell types at specific stages of development. A chemical genetic approach that used phenotypic discovery on a dynamic developing system, rather than a static or stable cell culture system, would screen through far more macromolecular functional surfaces. However, culturing and drug screening mammalian embryos is difficult, costly, and inefficient.
The embryonic developmental process can, to some extent, be mimicked in a petri dish by ES cells. These pluripotent cells have the ability to self-renew or, in principle, generate any postmitotic cell type. ES cells can be guided into various differentiated states by traditional culturing techniques or, more recently, by the carefully dosed and timed application of purified, developmentally relevant protein ligands of the transforming growth factor beta, hedgehog, and fibroblast growth factor classes. The relative timing and order of ligand treatment is empirically worked out by analogy to normal developmental events. Several inductive environments resulted in the differentiation of ES cells into neurons, 3 blood cells, 4 and other lineages.
In traditional cell culture assays, the perturbation of a cellular process that is brought on by a small molecule may be phenotypically silent as homeostatic feedback mechanisms alter the gene regulatory network. The cells will look the same even though gene expression profiles will have changed. In a differentiating ES culture assay, a homeostatically altered gene regulatory network is unlikely to move along the same developmental trajectory and a phenotype may therefore become apparent later as the developmental process gradually derails. In this sense, a differentiating ES cell culture assay would be expected to provide a more sensitive phenotypic readout in chemical genetic screens than assays involving individual stable cell lines.
Finally, the possibility of finding small molecules that drive ES cells along different lineages not only enhances the technical possibility for using ES cells as drug discovery tools in those lineages, but also provides new possibilities and cost efficiency in regenerative medicine. Identifying individual drugs, sequences of drugs, or combinations of drugs that can guide cells to particular regulatory states, cell types, or lineages would be desirable and would augment techniques using peptide ligands, which are costly and technically challenging to produce.
We have performed a phenotypic, chemical genetic screen on differentiating ES cells, using a library of 2000 compounds of known bioactivity, to identify compounds that alter developmental genetic programs. Proliferative mouse ES cells transferred to media without leukemia inhibitory factor (LIF), or a feeder cell layer, spontaneously differentiate in culture. Differentiating ES cultures were individually exposed to 2000 different chemical compounds for 5 days after LIF removal and monitored for phenotype changes by phase-contrast light microscopy. Twenty-one compounds that elicited cell morphologies differing from the controls were identified. A dozen markers of early development were used to establish that each of the compounds induces a unique expression profile. While it is not yet clear how each compound acts, it is apparent that 2% of the compound library derails the control differentiation process and that each nontoxic compound appears to do so by a specific mechanism.
Materials and Methods
Chemical Library
The OTRADI MicroSource Spectrum Collection includes 2000 clinically approved compounds from the collections of Discover, Pharmakon, and NatProd. Compounds have shown biological potential, with some being fully characterized and some already available in the market. Compounds are at a concentration of 2 mM in 10% DMSO (Sigma-Aldrich, St. Louis, MO).
ES Cell Culture
Mouse R1 ES cells (ATCC SCRC-1011) were grown 3 days on confluent mitomycin-treated mouse embryonic fibroblasts (MEFs), on gelatin-coated plates, in Dulbecco’s modified Eagle’s medium (DMEM) high glucose (Thermo Fisher Scientific, Grand Island, NY) supplemented with 15% heat-inactivated fetal bovine serum (FBS; GE HealthCare Life Sciences, Marlborough, MA), 100 µM nonessential amino acids (Thermo Fisher Scientific), 1 mM sodium pyruvate, 2 mM glutamine (Thermo Fisher Scientific), 0.1 g/mL penicillin/streptomycin (Thermo Fisher Scientific), 100 µM β-mercaptoethanol (Sigma-Aldrich), and 1000 U/mL LIF (ESG1107|ESGRO; ED Millipore). 5 Medium was changed daily. ES cells were trypsinized (trypsin 0.25% [w/v]/EDTA 0.04% [w/v], Thermo Fisher Scientific) and transferred onto MEF-free gelatin-coated 96-well plates (4000 cells per well in 200 µL of medium), and morphologically scored visually under a Zeiss Axiovert microscope (Carl Zeiss, Oberkochen, Germany).
Quantitative Real-Time PCR
ES cells were harvested for total RNA using the Qiagen RNeasy kit. Reverse transcription was performed on a fixed volume of the RNA preparation using the Applied Biosystems High-Capacity cDNA Transcription Kit (Grand Island, NY), and quantitative real-time PCR (qPCR) was performed using iTaq Universal SYBR Green Supermix and Applied Biosystems 7500 Fast Dx Real-Time PCR. All cDNA preparations were measured in triplicate. Primers sequences were designed in Primerbank http://pga.mgh.harvard.edu/primerbank/ and are as follows:
ES: Oct3/4 (F) GGCTTCAGACTTCGCCTCC, (R) AA CCTGAGGTCCACAGTATGC; Sox2 (F) GCGGAG TGGAAACTTTTGTCC, (R) CGGGAAGCGTGTAC TTATCCTT; Nanog (F) TCTTCCTGGTCCCCACA GTTT, (R) GCAAGAATAGTTCTCGGGATGAA
Ectoderm: Nes (F) CCCTGAAGTCGAGGAGCTG, (R) CTGCTGCACCTCTAAGCGA; Nog (F) GCCAGC ACTATCTACACATCC, (R) GCGTCTCGTTCAGAT CCTTCTC; Pax2 (F) AAGCCCGGAGTGATTGGTG, (R) CAGGCGAACATAGTCGGGTT
Mesoderm: Gsc (F) AACGCCGAGAAGTGGAACAAG, (R) CCGAGTCCAAATCGCTTTTACC; Nodal (F) AGACGTTCACCGTCATTCCTT, (R) CCAACACT TTTCTGCTCGACT; Twist1 (F) GGACAAGCTGAG CAAGATTCA, (R) CGGAGAAGGCGTAGCTGAG; Twist2 (F) CGCTACAGCAAGAAATCGAGC, (R) GCTGAGCTTGTCAGAGGGG
Endoderm: Cldn6 (F) TGCAAGGTGTATGACTCAC TGT, (R) GACGAGACTTGGAGTTCCTATCT; Sox7 (F) ATGCTGGGAAAGTCATGGAAG, (R) CGTGTTCTGGTCACGAGAGA; 18S rRNA (F) GCAATTATTCCCCATGAACG, (R) GGCCTCACT AAACCATCCAA
For each marker and the18S rRNA input control, the difference between average Ct values for the drug-treated sample and DMSO-treated controls (∆Ct) was calculated. Standard deviations were propagated by standard techniques (square root of sum of squares). ∆Ct values of each marker/drug were normalized for input by subtracting the corresponding ∆Ct for the 18S rRNA/drug to give ∆∆Ct with a standard deviation (error propagated as above). The log base 2 of the input-normalized fold change is given by ∆∆Ct*log2E, where E is the efficiency of amplification (set at 1.9 for all primer pairs). Marker changes were scored conservatively, based on the fold-change range in which the lowest end of the error bar fell. Error bars that crossed the axis were called no change. Changes between 0- and 1.4-fold, 1.4- and 2-fold, 2- and 4-fold, and greater than 4-fold were scored as uncertain (+ or –), low (++ or – –), moderate (+++ or – – –), or high (++++ or – – – –) changes with drug treatment, respectively. Plus (+) or minus (–) indicated that the drug induces or suppresses expression of the marker, respectively. Significance was indicated as the number of compounds with plus or minus changes per marker. Magnitude was indicated as the fold changes—uncertain, low, moderate, or high—per marker.
Results and Discussion
Library Screening
ES cells were grown for 3 days in the presence of LIF, to 30% confluence, with 20–30 cells per colony. The undifferentiated, pluripotent state of ES cells is maintained by LIF, and withdrawal of LIF allows cells to differentiate. 6 After 3 days, the medium was replaced with LIF-free medium to initiate differentiation and each compound was dispensed to one well to achieve a final concentration of 10 µM (1 µL of 2 mM compound in 10% DMSO into 200 µL medium). Each 96-well plate was used to test 80 different compounds, along with 16 controls of three types. The direct control (DMEM+LIF–DMSO+) was performed in eight wells per plate and provides only the amount of DMSO (0.05% final concentration) delivered by the solvent of the compounds ( Fig. 1B ). It has long been established that DMSO used at a final concentration of 0.5%–1% in a classic differentiation protocol drives ES cells toward a smooth muscle phenotype in 10 days. 7 A solvent control (DMEM+LIF–DMSO–) was therefore performed in four wells per plate to determine if the compound solvent (DMSO) is significantly or dominantly altering the developmental trajectory ( Fig. 1C ). The phenotypes of the direct and solvent control wells were similar in repeat wells of each control, but these appeared qualitatively different between the two different control types. Therefore, DMSO even at the low concentration of 0.05% appears to alter the developmental trajectory brought on by LIF removal in a consistent way. Nondifferentiating controls (DMEM+LIF+DMSO–) were performed on four wells per plate as a further visual reference during phenotype screening ( Fig. 1A ).
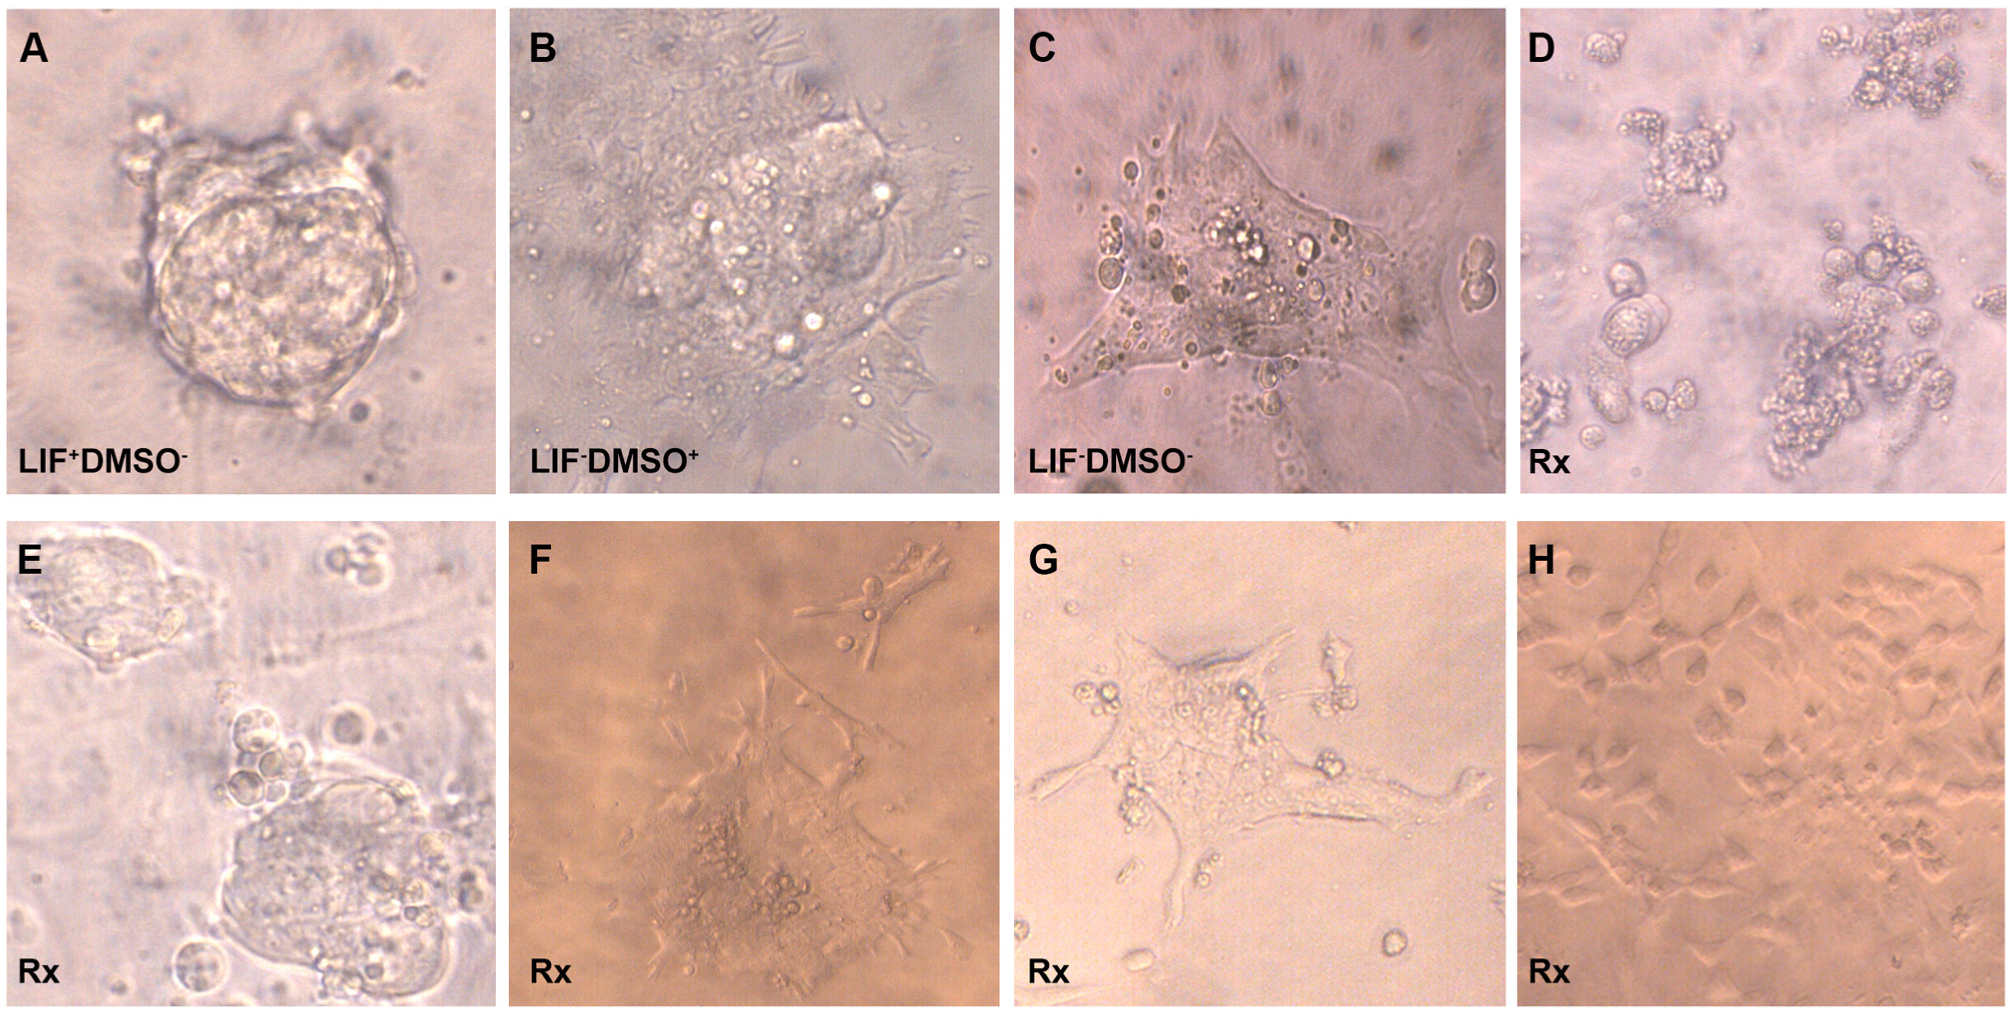
Phenotypes of in vitro differentiated mouse ES cells. (
For each compound-treated well, 20 ES cell colonies were inspected for morphological changes under a microscope daily for up to 5 days. Phenotypes were assigned if more than 15 of the colonies (75%) were similar. Four classes of phenotypes were observed: (I) toxic, dying with detached and floating colonies ( Fig. 1D ); (II) stalled ( Fig. 1E ), characteristic round shapes similar to, but differing from, undifferentiated pluripotent control cells ( Fig. 1A ); (III) normal ( Fig. 1F , G ), normally differentiated colonies with nondistinct borders and shapes similar to either direct ( Fig. 1B ) or solvent ( Fig. 1C ) controls; and (IV) distinct differentiated ( Fig. 1H ), differentiated with distinct shapes not observed in controls. At day 3, of the 2000 compounds tested, 114 (5.7%) were toxic (class I) ( Fig. 1D ), 1859 (92.9%) were normal (class III) ( Fig. 1F , G ), and 27 (1.4%) resulted in class II (stalled) or class IV (distinct differentiated) phenotypes. Compounds that induced nontoxic phenotypes that differed from those of all three control types were selected for further evaluation.
The observation of a large fraction of compounds (7%) causing microscopically observable phenotypic changes (stable or toxic) is consistent with the idea that developmental processes can be derailed in many different ways by a large variety of small molecules. The exact set of compounds identified is likely to depend on the levels of regulating proteins that the differentiating cells are deploying in a particular lineage trajectory. In this case, the developmental trajectory was initiated by LIF removal and does not represent the means by which cells normally enter differentiation in embryonic development. LIF, either produced by feeder cells or added exogenously, does not function on human ES cells. In rodents, LIF normally facilitates diapause, which is a process by which embryos can be placed into a state of suspended animation during times of stress. 8 The LIF receptor signals through JAK1 kinase and ultimately through STAT3, PI3/KAKT, and MAPK pathways and lifts a blockade on retinol metabolism. 9 LIF removal, or direct inhibition of STAT3, causes the cells to differentiate into a morphologically mixed cell population consisting of cells of all three germ layers. It does not appear to promote one lineage over the other. We expect that different sets of compounds, including subsets of the ones identified here, will cause observable phenotypic alterations if differentiating ES cells are actively promoted, by known signals, along particular lineages as they are exposed to test compounds. Such an approach, coupled with differential expression analyses, would also aid in narrowing down the possible molecular targets of compounds. Compounds can only be effective in lineages that express their molecular targets. Further testing of the 114 toxic compounds at lower concentrations is expected to produce nonlethal phenotypes and/or changes in gene expression to use as a starting assay to identify their molecular targets.
Phenotypic Rescreening
The phenotypic screen was repeated with the same ES cell passage, at the same compound concentration, and under identical culture conditions. However, wells were observed and colonies photographed for only 3 days before RNA was isolated for gene expression profiling. Only 21 of the initially selected compounds were selected again during phenotypic rescreening. The limited sample size allowed more detailed observations to be made for each compound. The timing with which distinct phenotypes developed differed between selected compounds. For example, cells treated with compound 11 became distinctly differentiated (class IV) after only 2 days. The initial round uniform colonies disappeared and cells became flat and covered the entire plate by day 3 (
Developmental Marker Profiling of Phenotypically Altered Cells
Gene expression profiles were used to determine if, and how, treatment with the selected compounds molecularly altered cell type. PCR primers were designed for a dozen early developmental markers and used to compare expression levels between compound-treated and direct control ES cells using qPCR. The change in RNA levels with respect to the DMSO-treated direct controls was determined for each marker for each of the 21 compounds that passed the second phenotypic screen. The molecular markers were selected based on normal expression patterns in embryos. They represent a temporal progression in terms of their normal onset and also mark different germ layer derivatives in embryos. All but Nodal (secreted signal protein), Noggin (secreted signal protein), Nestin (intermediate filament), and Claudin6 (membrane protein) are SSTFs of the homeodomain (Oct4, Nanog, Gsc, Pax2), bHLH (Twist1, Twist2), and HMG (Sox2, Sox7) classes. SSTF codes, particularly those involving homeodomain-containing SSTFs, are operationally used to follow the birth, death, and movement of cell types in embryonic developmental studies. 10 None of the selected markers changed consistently in one or another direction for all drugs ( Fig. 2 ). Each of the selected compounds induced unique changes to the expression profile of embryonic markers, indicating that the developmental trajectory of the ES cells was altered in a distinct way by each drug ( Table 1 ).
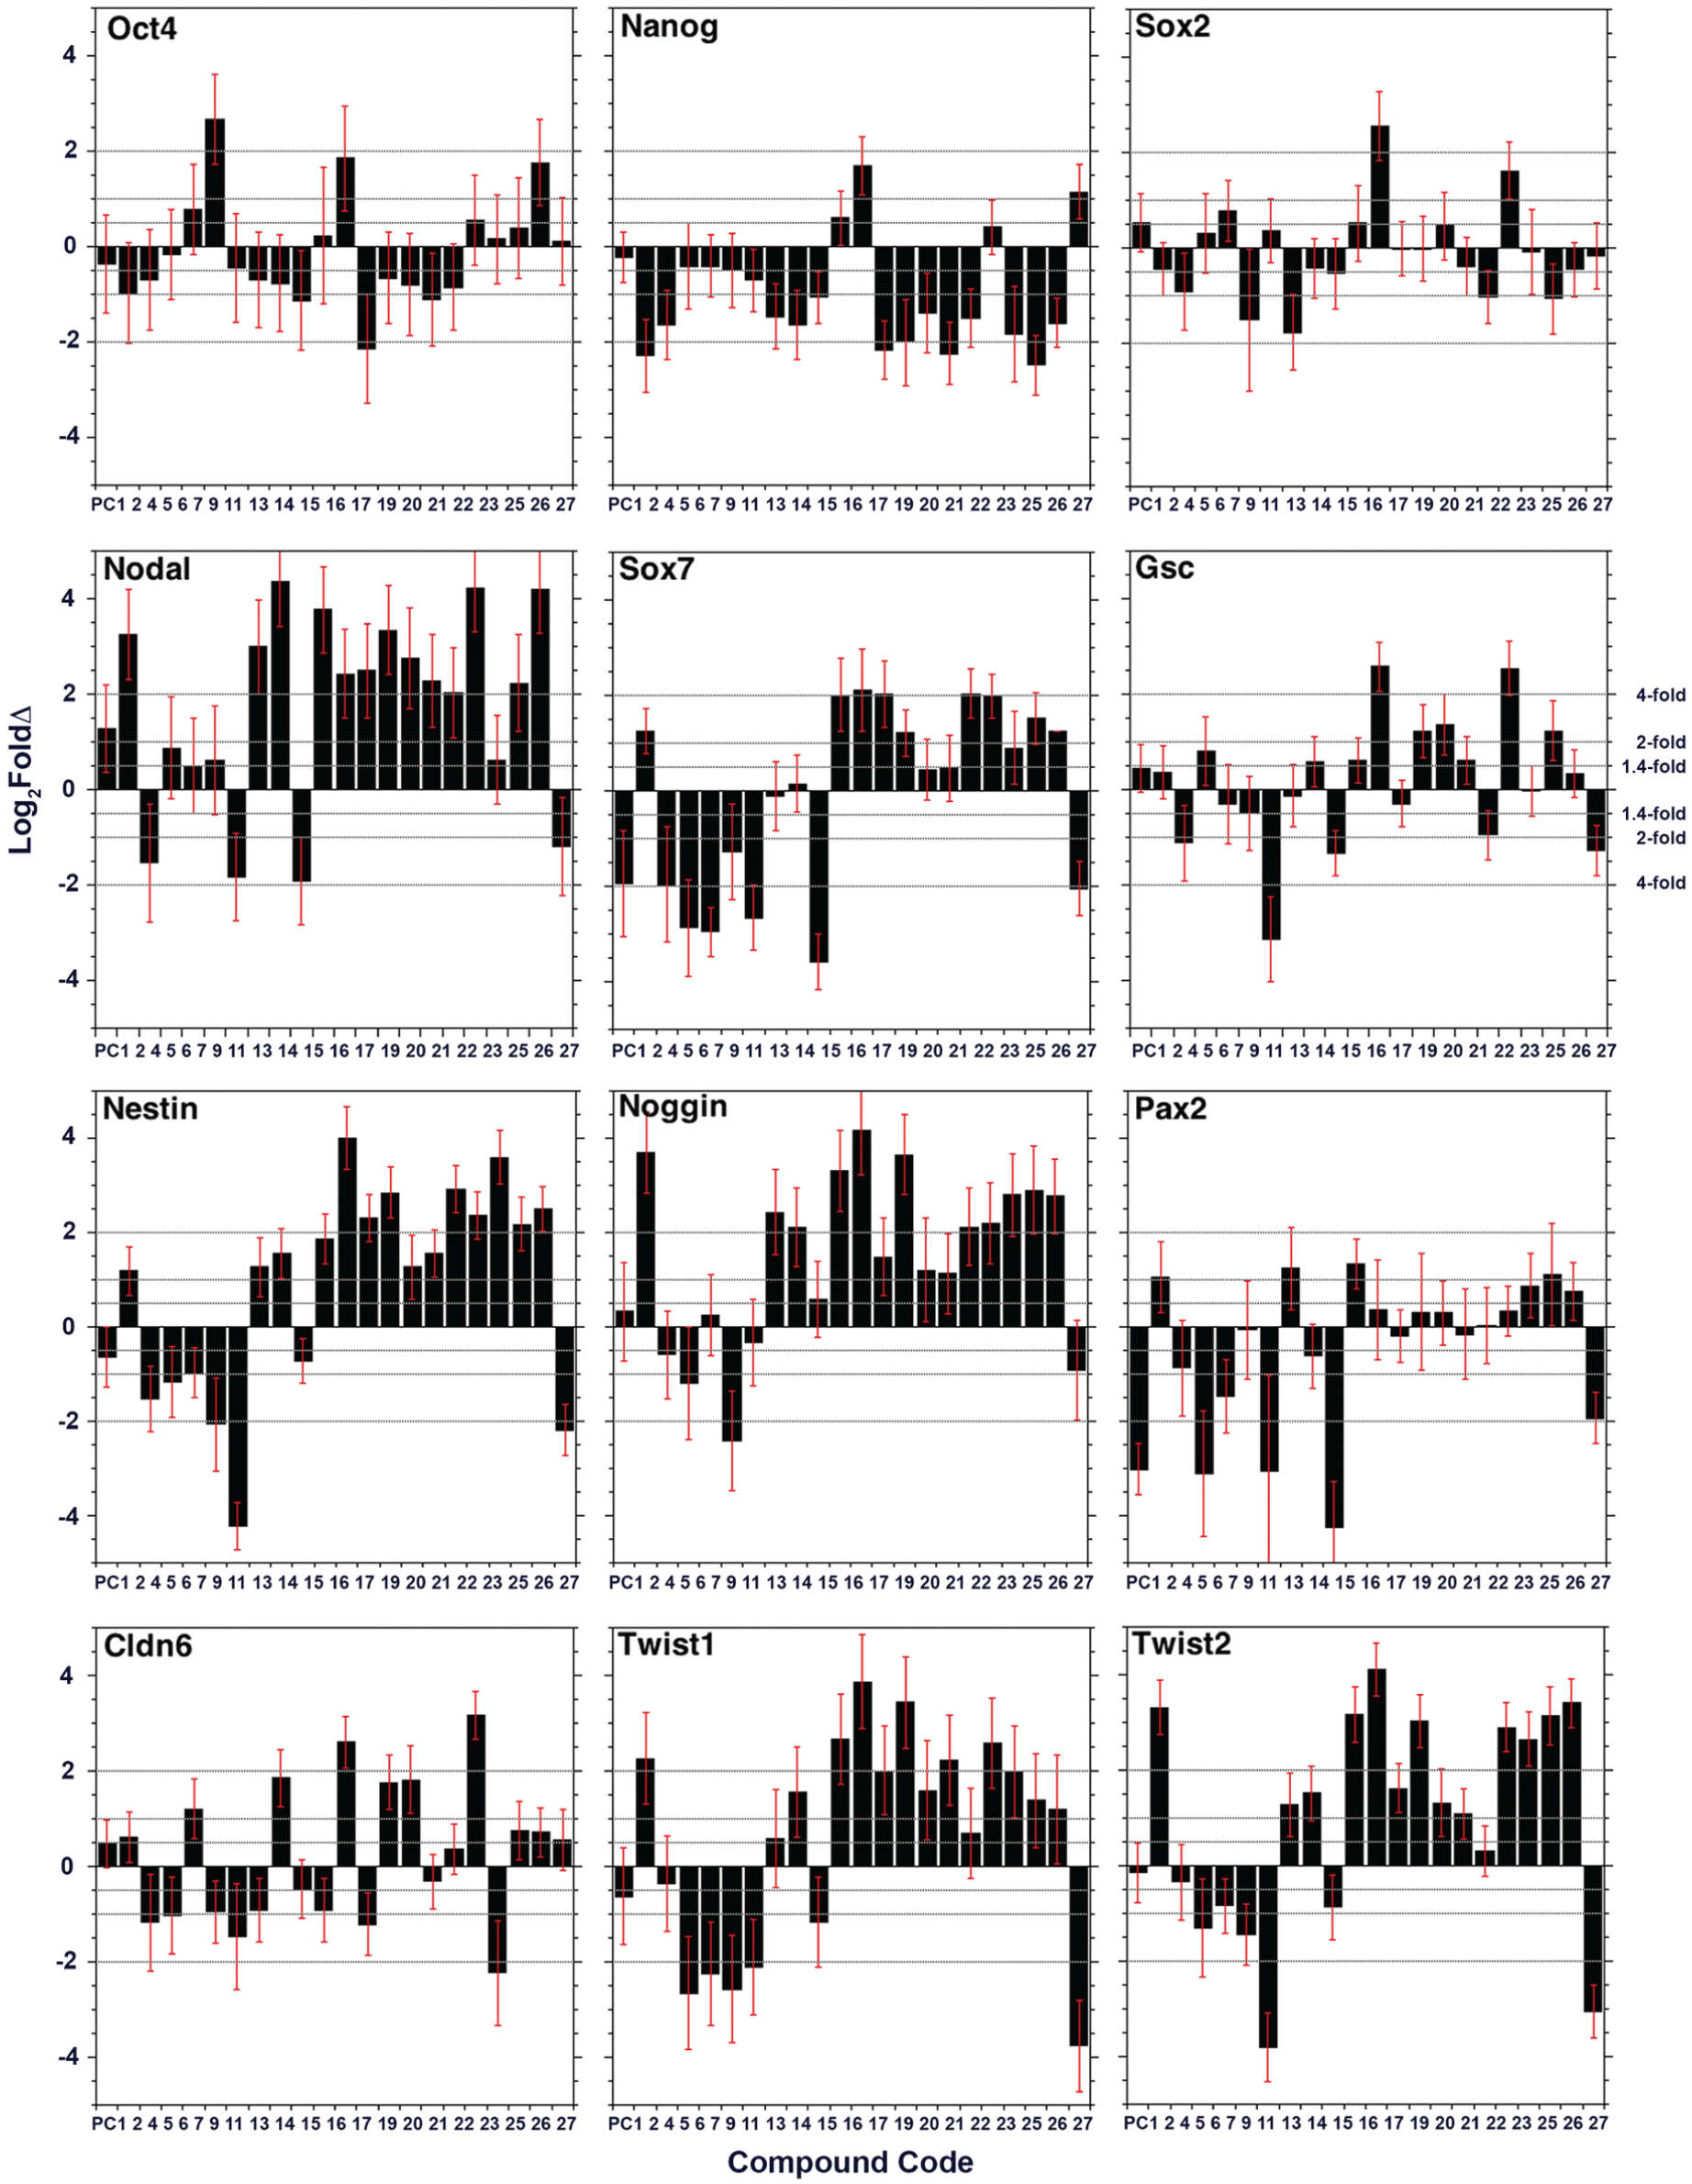
Gene expression profiling of lineage-specific markers. RNA levels have been determined by qPCR in ES cells grown for 3 days in the presence of specific compounds on the Y axis. The log base 2 of the 18S input-normalized fold change is given by ∆∆Ct*log2E. E is the efficiency of amplification (set at 1.9 for all primer pairs). Marker changes were based on the fold-change range in which the lowest end of the error bar fell. Oct4, Nanog, and Sox2 were used as ES cell pluripotency markers. Gsc, Cldb6, and Sox7 were used as endoderm lineage markers. Nodal, Twist1, and Twist 2 were used as mesoderm lineage markers. Nes, Nog, and Pax2 were used as ectoderm lineage markers. Compound number is indicated on the X axis.
Developmental Marker Changes by Compound. a
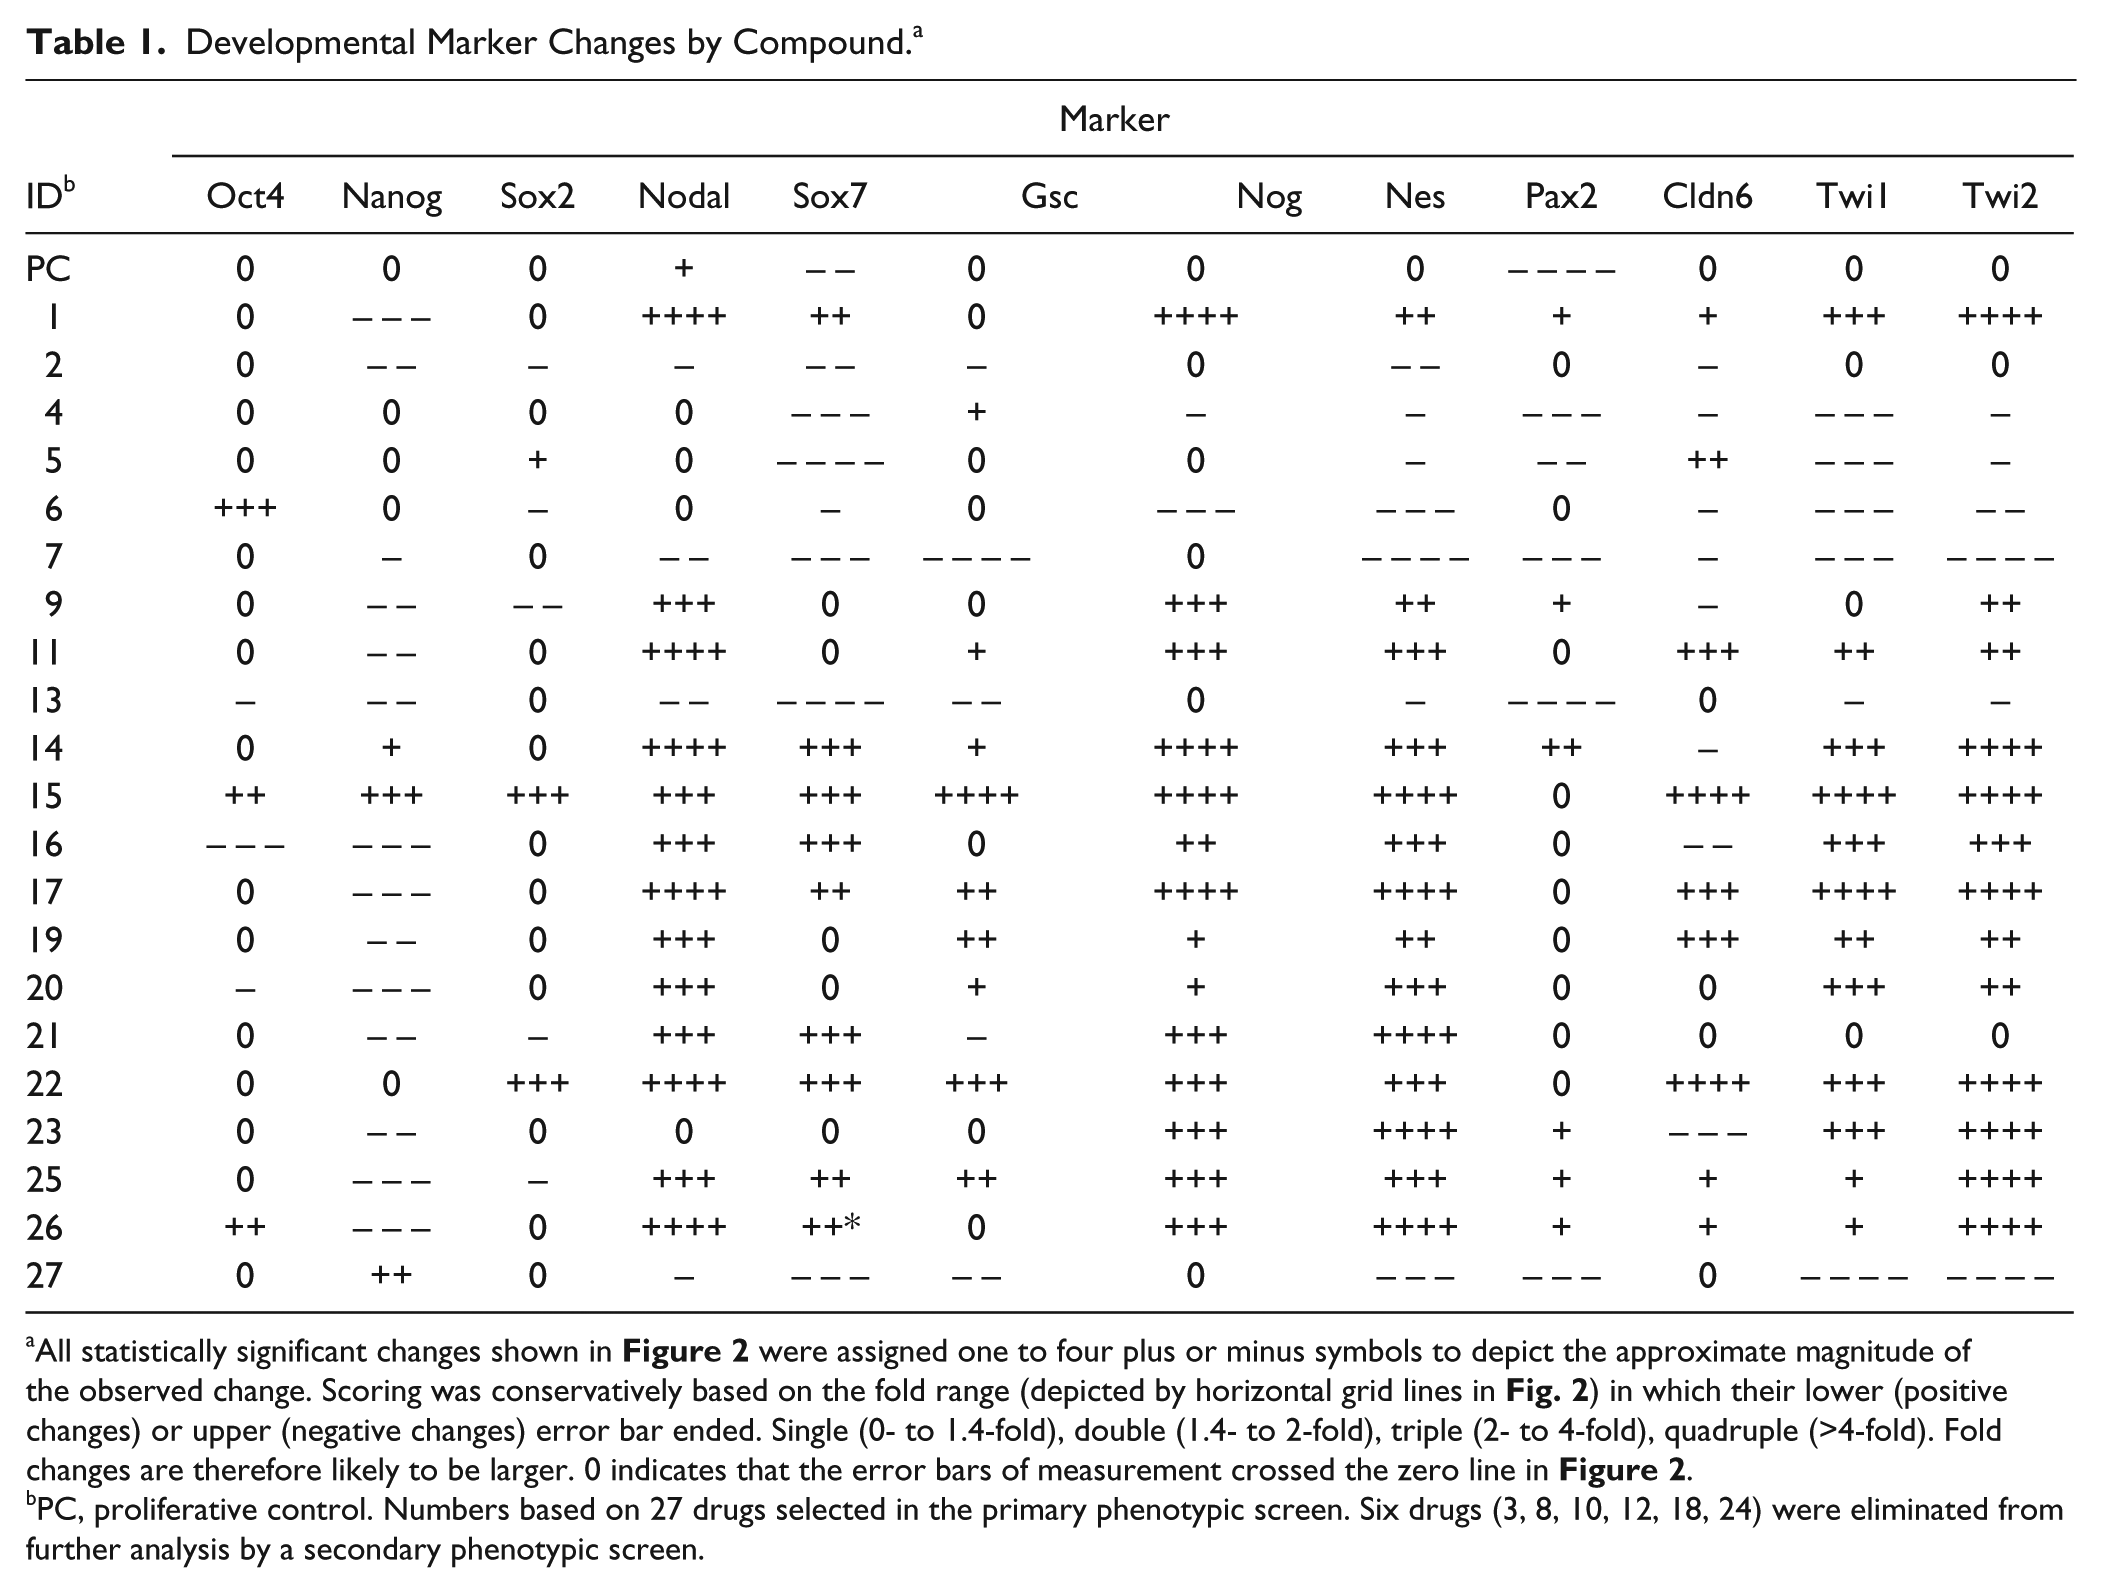
All statistically significant changes shown in
Figure 2
were assigned one to four plus or minus symbols to depict the approximate magnitude of the observed change. Scoring was conservatively based on the fold range (depicted by horizontal grid lines in
PC, proliferative control. Numbers based on 27 drugs selected in the primary phenotypic screen. Six drugs (3, 8, 10, 12, 18, 24) were eliminated from further analysis by a secondary phenotypic screen.
The three markers that constitute the SSTF code (Oct4+Nanog+Sox2+) of undifferentiated ES cells 1 behaved differently, in response to the 21 selected compounds, from the nine markers of derivative lineages. Fewer (7 ± 1.4) significant drug effects (induction or repression) were observed on Oct4 and Sox2 expression than on lineage markers (16 ± 4), and the magnitude of these effects was far smaller (13 ± 1 vs. 42 ± 13 plus or minus symbols in Table 1 ). In contrast, Nanog showed a similar number (17) and magnitude (39) of effects as the nine lineage markers, but they were predominantly in the repressed direction (82% of significant effects lowered Nanog RNA levels), while those of the nine lineage markers were predominantly in the induced direction (66 ± 11% of significant effects raised lineage marker levels). The ratio of positive to negative effects on Oct4 and Sox2 was close to 1 (0.8 ± 0.3). Taken together, these data indicate that phenotypic selection has yielded a selection of compounds that generally increases RNA expression of differentiated lineage markers while lowering, or not affecting, the RNAs of ES markers.
The observation that Nanog is significantly downregulated by 67% of the selected drugs suggests that this is the main control point for destabilizing the pluripotent ES network kernel. The SSTF code of ES cells has not been observed in non-ES cells, and enforced expression of this combination can cause heterologous cells to become induced pluripotent stem cells. 11 All three SSTFs are coexpressed in all cells from zygote to morula stages and then become restricted to the pluripotent cells of the inner cell mass from which ES cell lines are derived. They form a network kernel by being connected in a feedforward regulatory loop, which allows them to maintain each other’s expression levels. 2 Destabilizing this network kernel is a prerequisite for allowing an ES cell to move from the pluripotent ES cell’s regulatory state (cell type) to any other regulatory state (cell type). In embryonic development, only Oct 4 is maintained throughout the totipotent germ lineage. 12 Nanog expression is shut down immediately in the first two lineages (trophoectoderm and hypoblast) to split from the stem cells as the morulae become blastocysts.13,14 During gastrulation, Nanog RNA expression remains only in the epiblast adjoining the primitive streak, and is immediately downregulated in the endoderm and mesoderm lineages that emerge from the streak. It is also extinguished in all of the ectoderm except the primordial germ lineages. In contrast, Sox2 expression persists in anterior ectoderm that gives rise to anterior neuro- and surface ectoderm. 15 Of the six compounds that did not reduce Nanog levels significantly, two increased Nanog (compounds 14 and 27), two increased Sox2 (compounds 5 and 22), and one increased all three ES markers (compound 15). Only compound 4 showed no significant effect on any of the three known kernel members. With this exception, it appears that each selected drug can in some way destabilize the ES network kernel at the RNA level and allow cells to progress to other lineages.
Most compounds also raised expression of a wide variety of late lineage markers, rather than selectively inducing one or the other of them. The lack of selectivity in inducing specific late lineage markers may be because different lineages develop in parallel, or because different phases of a single lineage are present simultaneously, in the compound-treated ES cultures. This also occurs in normal embryonic development, and single-cell analyses must be conducted to determine the mix of cell types induced by each compound. An alternate explanation is that differentiation proceeds through a series of artificial network states (cell types) that do not exist in embryos. While the selected compounds, as a group, generally raised expression of most late lineage markers, there were individual compounds that defied this trend ( Table 1 ). Compounds 2, 4, 5, 6, 7, and 13 generally repressed late markers rather than activating them. Two of these, compounds 4 and 5, selectively activated either Gsc or Claudin6, suggesting that these compounds selectively promote the organizer or mesodermal cell types that express these markers, respectively. Compound 15, arsenic oxide, activated all markers but one, suggesting a nonspecific upregulation.
ES cells grown in the presence of compound 26 were unusual in that they showed the only stalled (class II) phenotype of the screen, suggesting that compound 26 stalls the normal progression of differentiation. Compound 26 significantly raised levels of Oct4 (3.4-fold), but also significantly lowered levels of Nanog RNA (3.0-fold), while Sox2 levels remained unaffected. It also significantly raised levels of all other lineage markers except Gsc. One possibility is that pluripotent and differentiated cells coexist in the presence of compound 26.
The chemical and pharmacological nature of the identified compounds was reviewed in literature and web resources ( Table 2 ). A wide range of drug uses were associated with the selected compounds. None of the known functions were determined previously in ES cells. Taken together, we conclude that many of the selected compounds, which act as drugs on specific macromolecules in specific differentiated tissues or cells in adult humans, are likely to interact with similar molecules in ES cells. The precise nature of each molecular target in ES cells remains to be determined by more detailed studies. However, such studies would be premature at this point because dose response and expression analyses are missing. Moreover, further phenotypic screening along different developmental lineages, coupled with high-throughput expression analyses, will provide a more robust means for narrowing down the possible macromolecular targets in this system.
Compounds Identified in Primary Phenotypic Screen. a
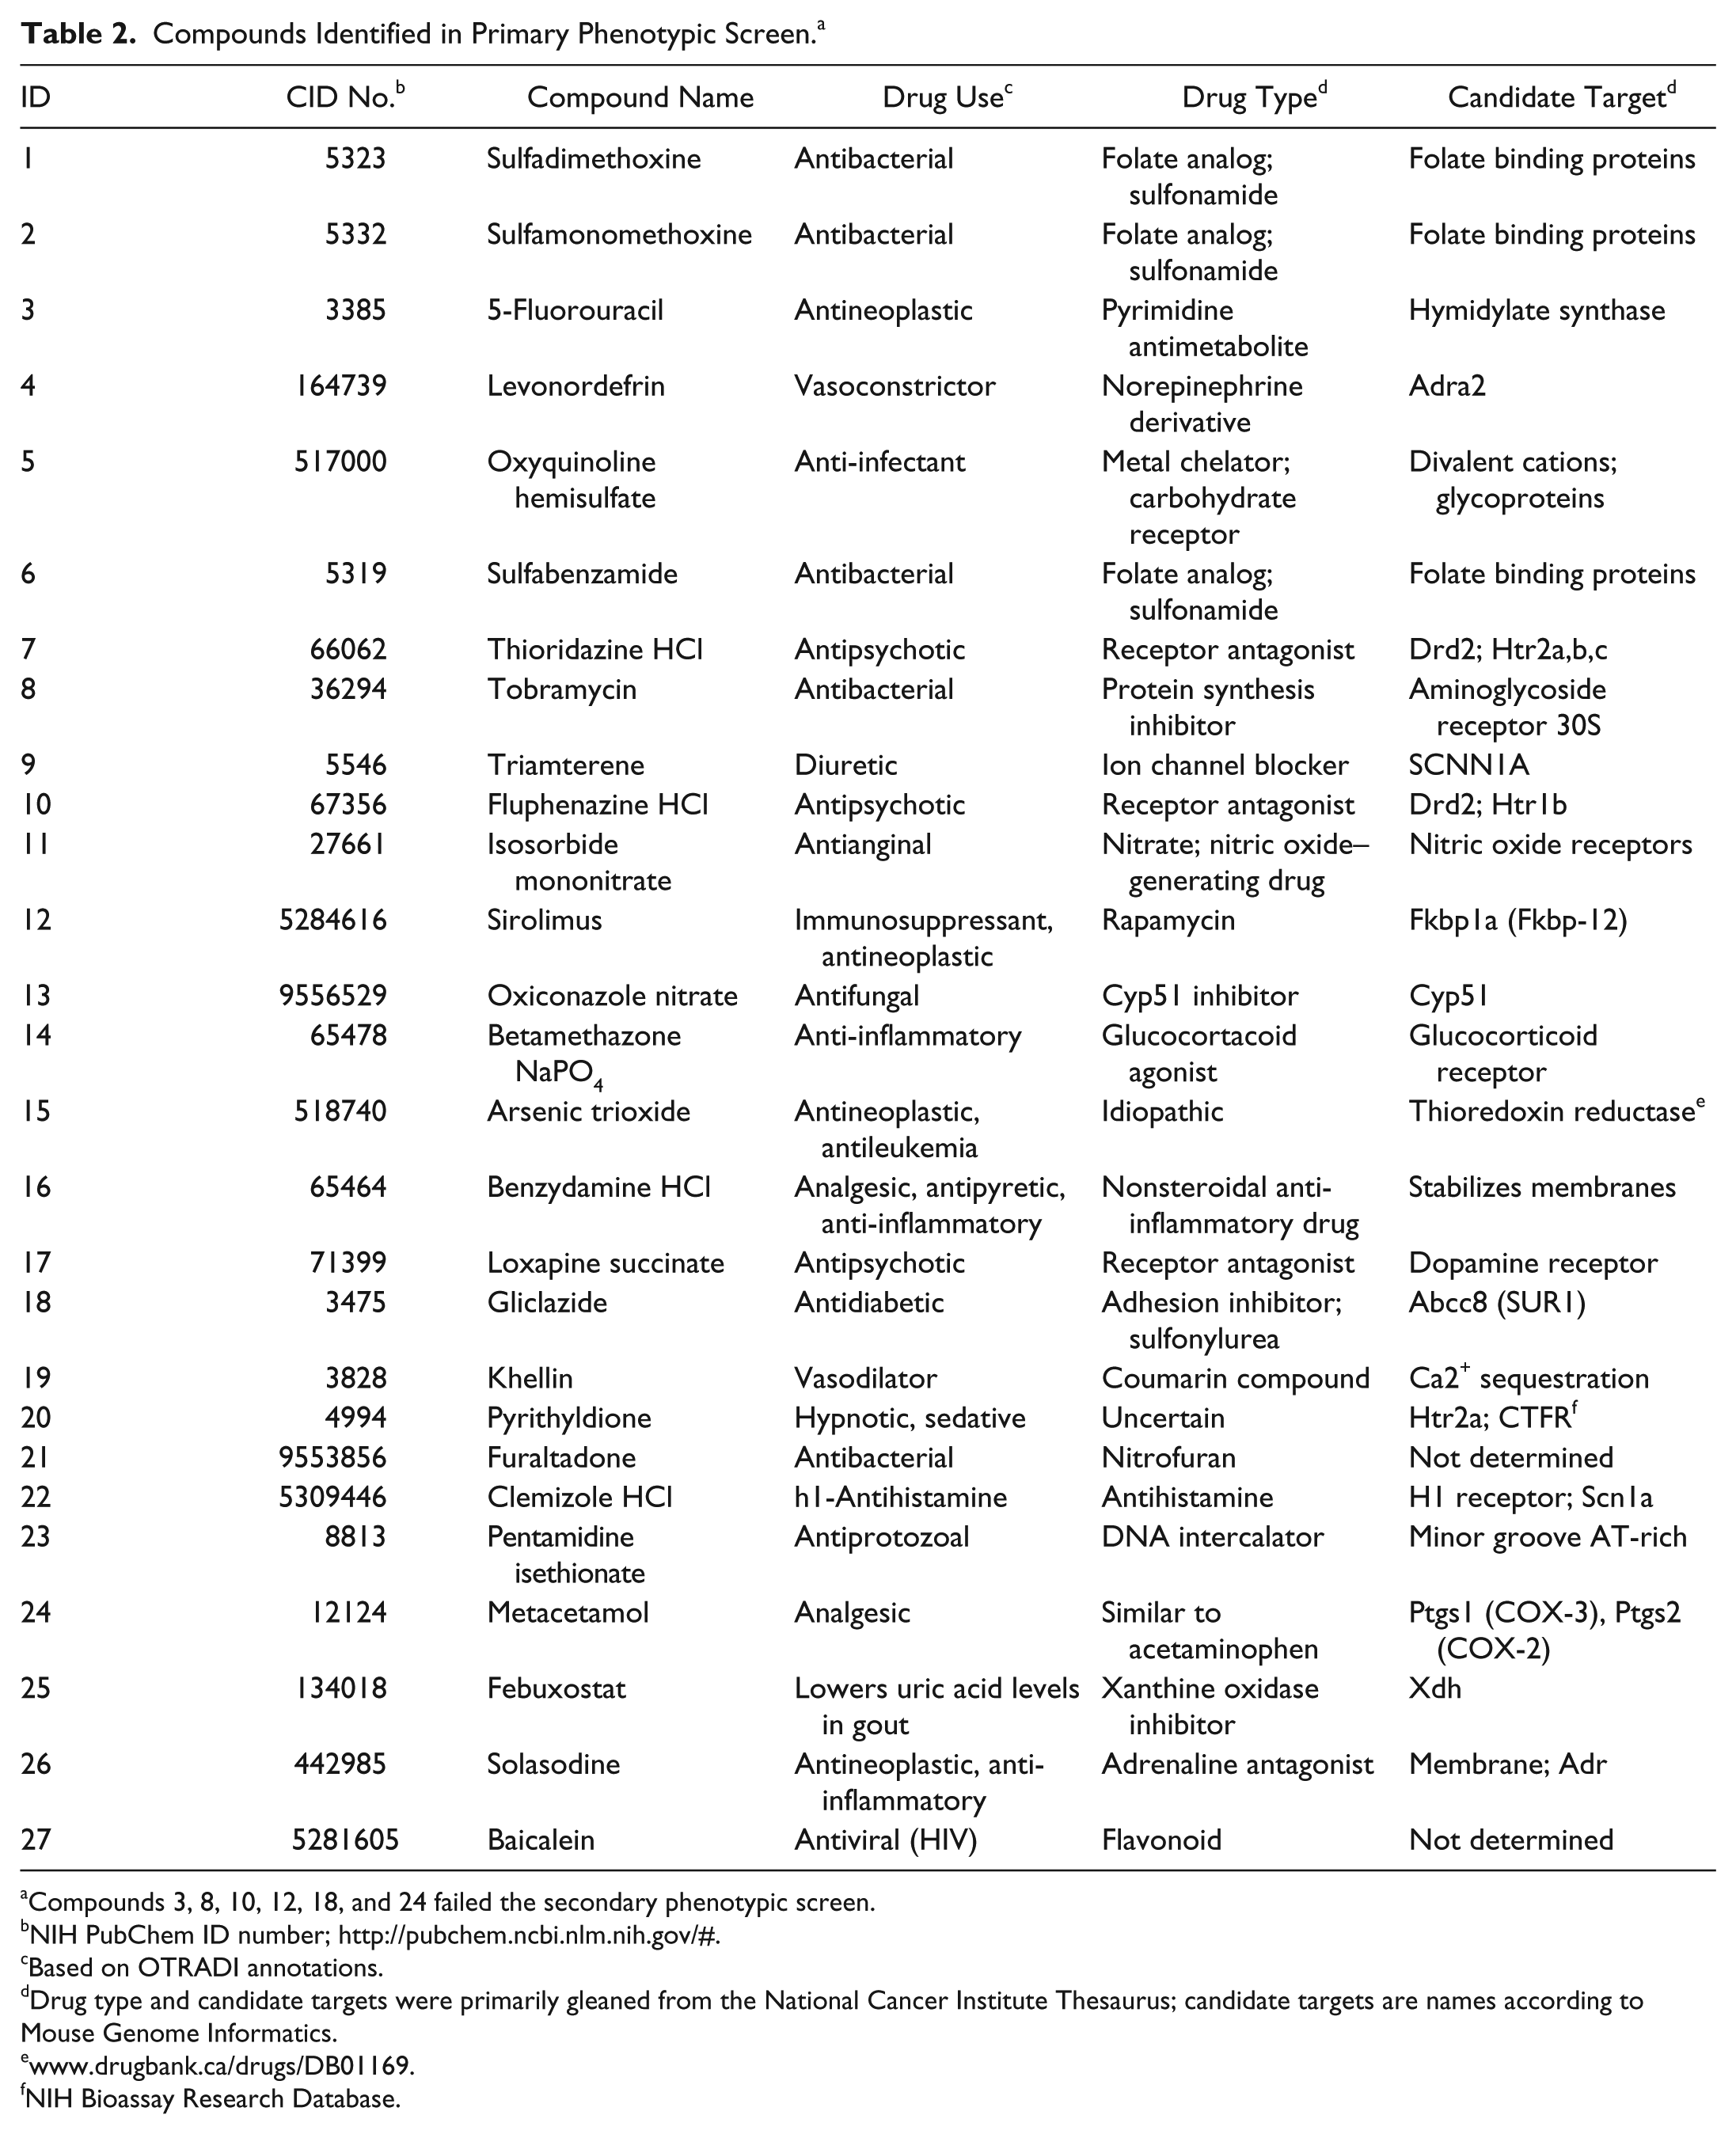
Compounds 3, 8, 10, 12, 18, and 24 failed the secondary phenotypic screen.
NIH PubChem ID number; http://pubchem.ncbi.nlm.nih.gov/#.
Based on OTRADI annotations.
Drug type and candidate targets were primarily gleaned from the National Cancer Institute Thesaurus; candidate targets are names according to Mouse Genome Informatics.
NIH Bioassay Research Database.
Footnotes
Acknowledgements
The authors thank the OTRADI personnel for technical assistance.
Declaration of Conflicting Interests
The authors declared no potential conflicts of interest with respect to the research, authorship, and/or publication of this article.
Funding
The authors disclosed receipt of the following financial support for the research, authorship, and/or publication of this article: This research was supported by funds of the College of Pharmacy, Oregon State University to CK.