
Abstract
G protein–coupled receptors (GPCRs) play stimulatory or modulatory roles in numerous physiological states and processes, including growth and development, vision, taste and olfaction, behavior and learning, emotion and mood, inflammation, and autonomic functions such as blood pressure, heart rate, and digestion. GPCRs constitute the largest protein superfamily in the human and are the largest target class for prescription drugs, yet most are poorly characterized, and of the more than 350 nonolfactory human GPCRs, over 100 are orphans for which no endogenous ligand has yet been convincingly identified. We here describe new live-cell assays that use recombinant GPCRs to quantify two general features of GPCR cell biology—receptor desensitization and resensitization. The assays employ a fluorogen-activating protein (FAP) reporter that reversibly complexes with either of two soluble organic molecules (fluorogens) whose fluorescence is strongly enhanced when complexed with the FAP. Both assays require no wash or cleanup steps and are readily performed in microwell plates, making them adaptable to high-throughput drug discovery applications.
Keywords
Introduction
Assays that detect molecular events triggered by ligand binding to particular G protein–coupled receptors (GPCRs) (e.g., activation/inhibition of adenylyl cyclases or phospholipases, or mobilization of β-arrestin) have been a mainstay of GPCR drug discovery for many years. 1 However, when one is screening for agonists to orphan receptors 2 or screening for biased or allosteric ligands to nonorphan receptors,3,4 one may not know with confidence what event(s) to screen for. In such cases, assays that are directed to a common feature of GPCR biology, rather than to a specific signaling pathway, may be more productive.
Following stimulation with agonists, almost all GPCRs exhibit receptor desensitization, during which receptor molecules are internalized by endocytosis over a period of minutes or tens of minutes. When agonist is removed, resensitization ensues, during which some or all of the internalized receptors may return to the surface by exocytosis, again over a period of minutes. Since receptor desensitization and resensitization are general features of GPCR biology, assays that directly measure these processes present opportunities to uncover responses that standard approaches might miss, for example, heterologous desensitization 5 through another receptor. The drug discovery opportunity may be particularly strong when resensitization is measured, since high-throughput screens for molecules that directly affect resensitization have not been available.
In previous work, we described the application of fluorogen-activating proteins (FAPs) 6 to assays that address receptor downregulation by measuring either changes in surface receptor abundance (surface signal depletion assay) or internalized receptor abundance (internal signal accumulation assay). 7 Here we describe a related new assay system that concomitantly measures receptor loss from the surface and receptor accumulation inside the cell. This system represents an improvement over previous systems for two primary reasons: (1) it is intrinsically self-checking, since in the absence of artifact, receptor loss and receptor accumulation will be reciprocally related, and (2) it provides a straightforward means to measure receptor resensitization as well as desensitization.
Materials and Methods
FAPs, Fluorogens, and GPCR Ligands
The fluorogen-activating protein used in this study was the single-chain antibody (scFv) HL1.0.1-T01. 6 The fluorogens used in this study were the membrane-impermeant molecules T01-2p 6 and TO1-2p-Cy5, both derivatives of thiazole orange.
(–)-Isoproterenol(+)bitartrate, DL-Propranolol HCL epinephrine, and nor-epinephrine were from Sigma-Aldrich (St. Louis, MO). Recombinant CXCL12/SDF-1a and AMD 3100 octahydrochloride were from R&D Systems (Minneapolis, MN).
Mammalian Cell Culture Conditions
U937 cells were grown at 37 °C, 5% CO2 in RPMI 1640 plus 10% heat-inactivated fetal calf serum (FCS), 100 U/mL penicillin, and 100 mg/mL streptomycin. HEK cells were grown under the same conditions in Dulbecco’s modified Eagle’s medium (DMEM) plus FCS, 100 U/mL penicillin, and 100 mg/mL streptomycin. All experiments were performed on cells in their culture medium under their natural growing conditions. Periodically, cell lines were sorted to maintain them at greater than 95% positive for the FAP-tagged GPCR.
Fluorescence Microscopy
For confocal microscopy, cells were imaged on 23-mm glass-bottom dishes (part no. p35G-1.5-14-C; Mattek, Ashland, MA) using either a Zeiss LSM510 META confocal laser scanning microscope (Carl Zeiss, Thornwood, NY) equipped with a 525/50-nm band pass filter (TO1-2p) and a 680/60-nm band pass filter (TO1-2p-Cy5) or an Andor confocal microscope (Andor, Belfast, Northern Ireland) equipped with a 63×, 1.47 NA objective. For both systems, an argon 488-nm laser was used to excite TO1-2p and TO1-2p-Cy5 (via energy transfer). In some experiments, the Cy5 moiety was directly excited with the 623-nm HeNe laser. Emission filters were standard fluorescein (533 nm) and Cy5 (685 nm) emission filters. Growing conditions were maintained on the microscope stage using a 37 °C, 5% CO2, constant humidity specimen chamber (LiveCell; Pathology Devices, Westminster, MD).
For 20× nonconfocal microscopy, imaging was performed using an Olympus IX50 microscope equipped with an HBO 100-watt light source with appropriate filters (TO1-2p HQ470/40ex and HQ500LPem; TO1-2p-Cy5 HQ620/60 ex and HQ700/75em; Chroma Technologies, Bellows Falls, VT) and thermoelectric stage heater (20/20 Technology, Wilmington NC). Images were acquired using a Photometrics CoolSnap HQ CCD camera (Photometrics, Tucson, AZ). Illumination intensity and gain settings on the microscope were held constant for all observations. Because there was variation in illumination intensity across the image fields, cell masks were made using ImageJ (National Institutes of Health, Bethesda, MD) and the masks applied to adjacent cell-free regions in each field. The mean pixel intensity for each cell and its respective background means were tabulated and subtracted from each other, and these values were averaged for 35 cells.
Flow Cytometry
Cells were analyzed using a Becton Dickinson (BD) FACS Vantage SE Flow Cytometer with FACS Diva option (Becton Dickinson, Franklin Lakes, NJ). An argon 488-nm laser was used to excite TO1-2p and TO1-2p-Cy5 (via energy transfer). Emission filters were 530/30 and 695/40 nm, respectively. Quantitation was carried out using BD software with compensation. Primary data points were mean intensity values for 2500 cells. Plots were generated in Excel (Microsoft, Seattle, WA) and replotted in GraphPad Prism (GraphPad Software, San Diego, CA) using single-phase exponential and sigmoidal curve fits as appropriate. EC50 values were generated in GraphPad Prism from the same data. All experiments were repeated several times with nearly identical results. The peaks in the fluorescence-intensity histograms were similar in aspect to those shown in Fisher et al. 7
Results and Discussion
All receptors used in this study were tagged at their extracellular N-termini with FAP HL1.0.1-TO1 as previously described 7 and were expressed in U937 cells (a nonadherent human lymphoma line) and HEK 293 cells (an adherent human embryonic kidney cell line). Two membrane-impermeant fluorogens specific to HL1.0.1-TO1 were used ( Fig. 1A ), TO1-2p (“exchange fluorogen”) and TO1-2p-Cy5 (“pulse fluorogen”). When bound to the FAP and excited by an argon gas laser (488- and 514-nm lines), the exchange fluorogen emits in the green (530 nm). With the same excitation, the pulse fluorogen emits in the far red (670 nm) due to energy transfer from the TO1 moiety to the Cy5 moiety.
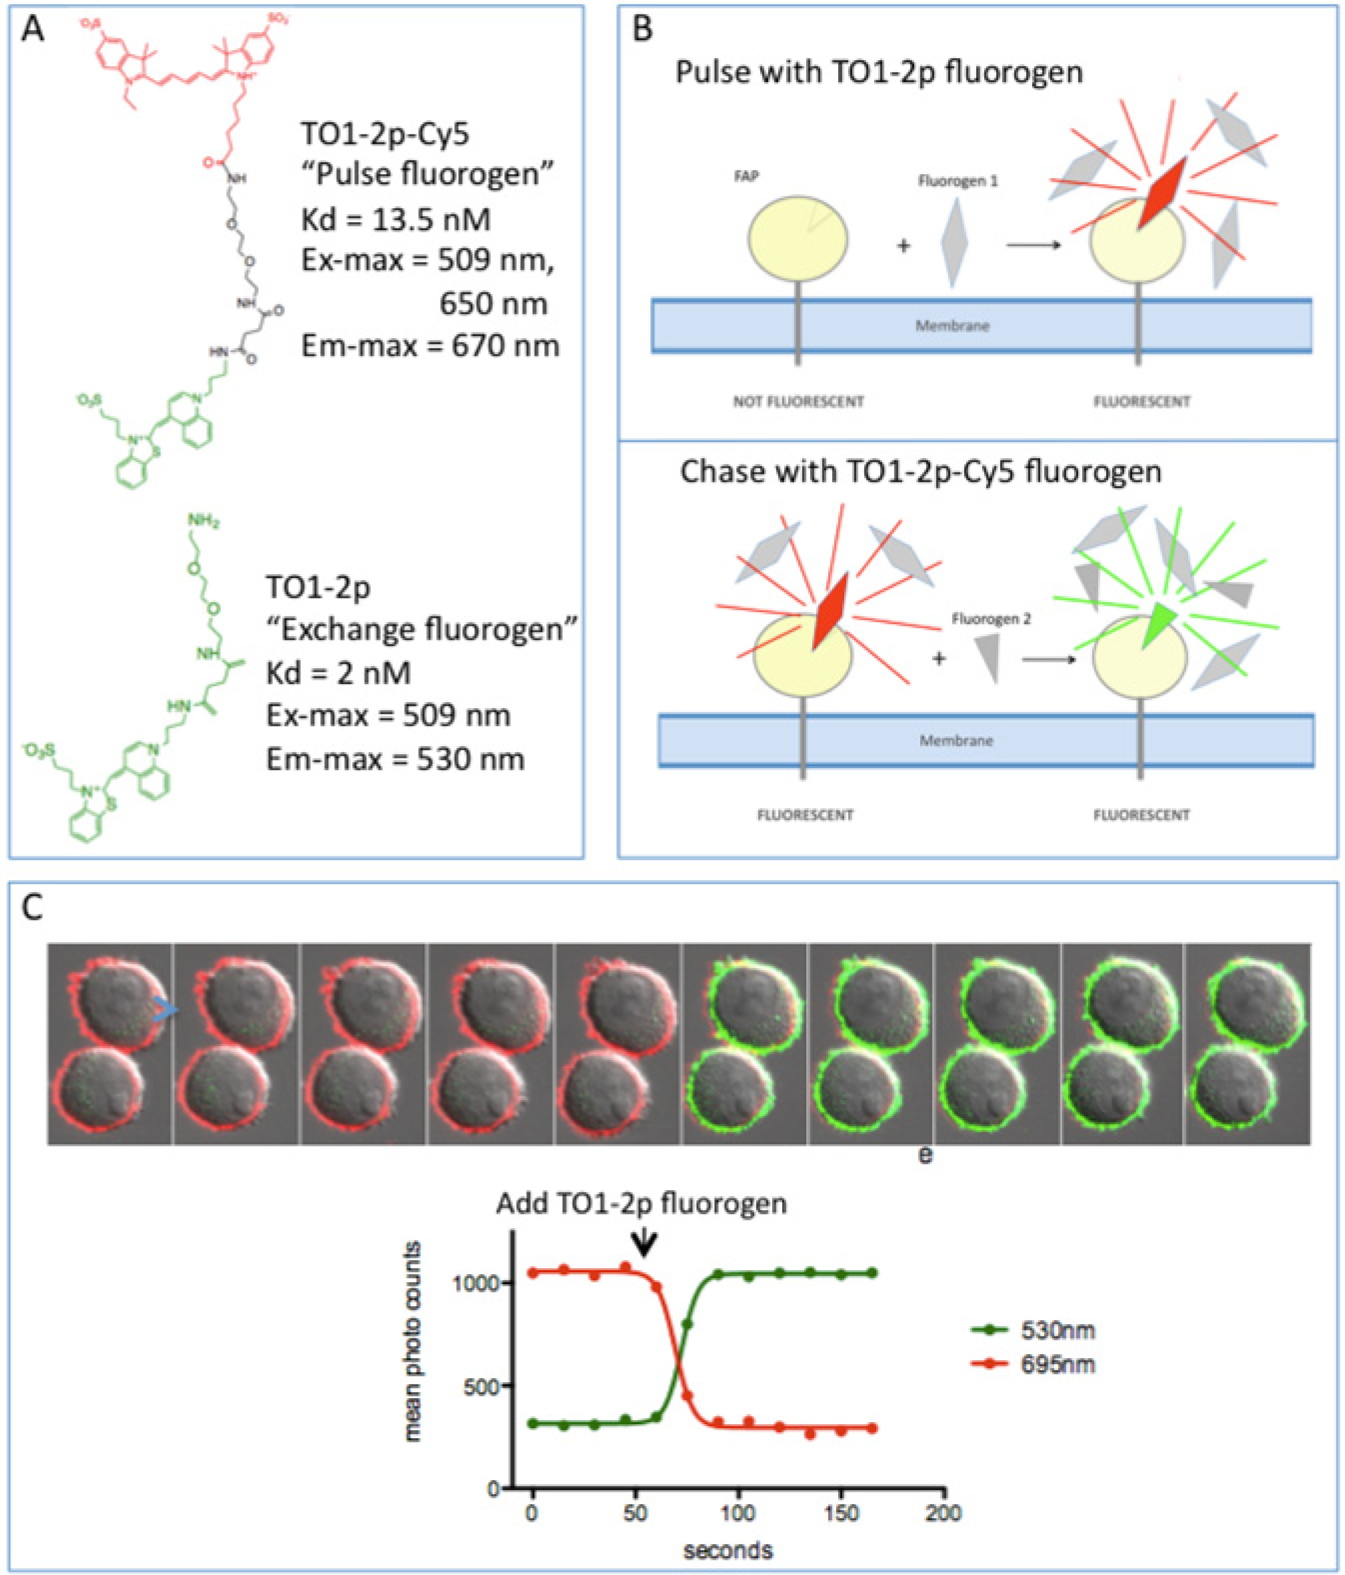
Rapid exchange of TO1-2p for TO1-2p-Cy5 at the cell surface. (
When incubated with pulse fluorogen, cells expressing FAP-tagged receptors rapidly acquire red fluorescence, with signal confined to the cell surface due to the membrane-impermeant nature of the fluorogen. Titration experiments with FAP-tagged U937 cells showed that maximal signal intensity is obtained with 5 nM or greater concentrations of fluorogen. When excess exchange fluorogen is added, the exchange fluorogen displaces the pulse fluorogen by mass action, and the surface fluorescence changes from red to green ( Fig. 1B ). To drive the exchange rapidly, we used 350 nM exchange fluorogen—a concentration more than 100-fold above the Kd for the FAP. With this protocol, displacement of the pulse fluorogen reached completion in less than a minute ( Fig. 1C ), yet there was no spurious signal from fluorogen in solution because the exchange fluorogen exhibits essentially no fluorescence except when bound to the FAP.
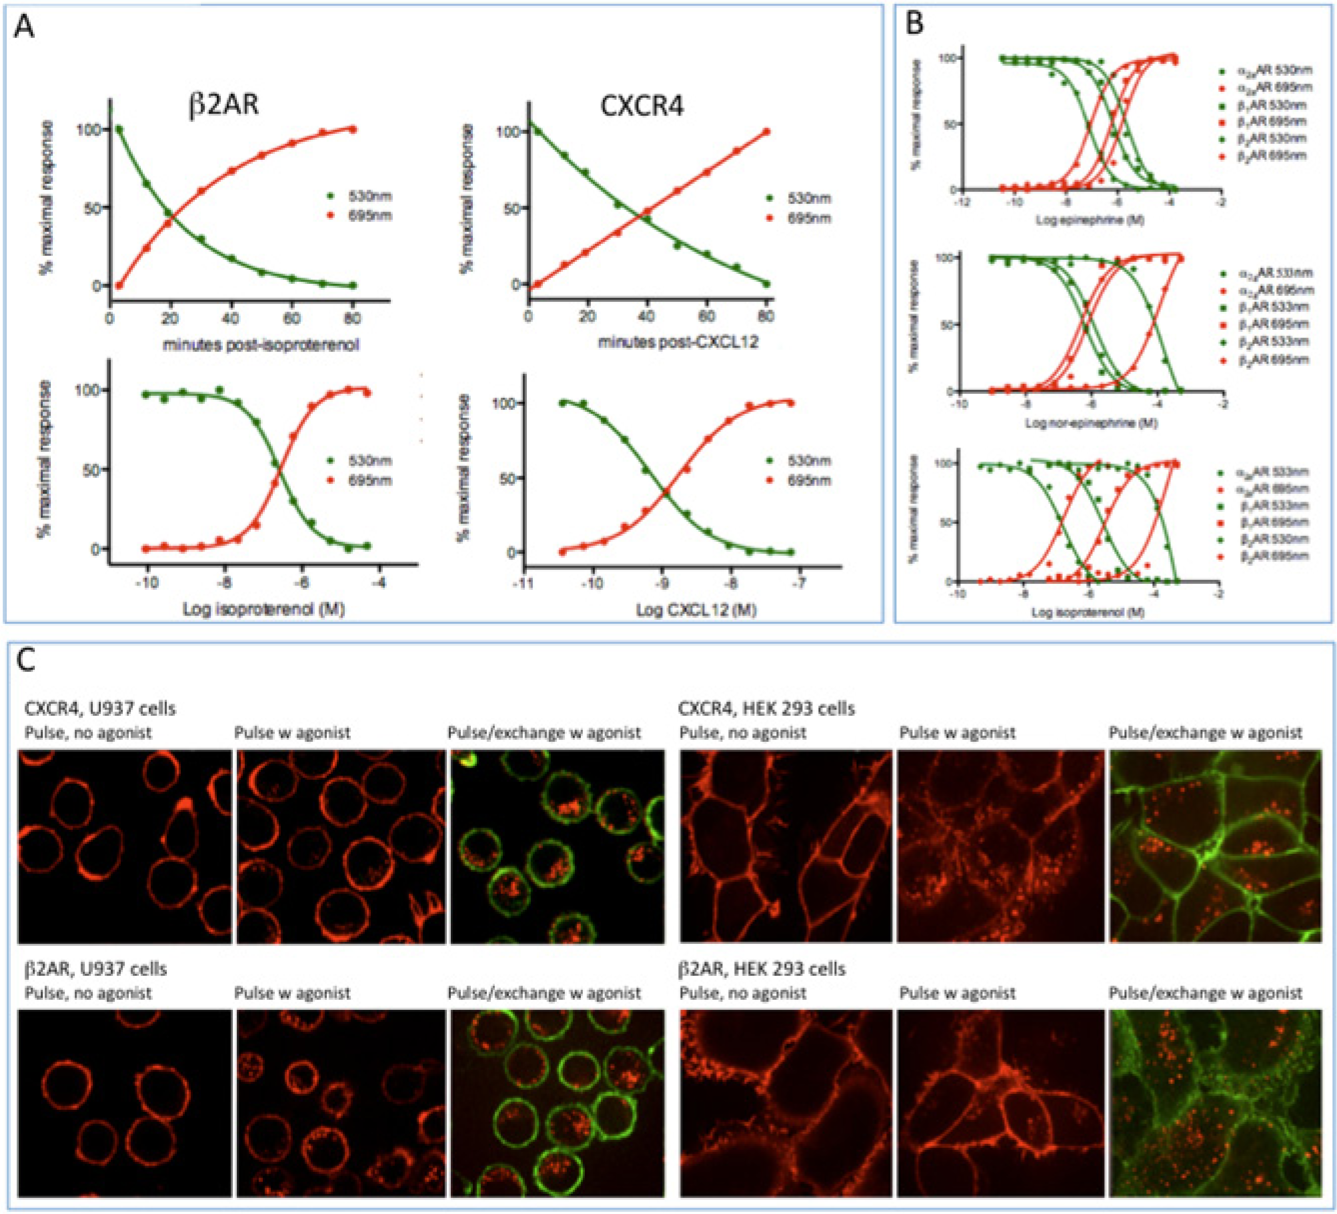
We chose four human GPCRs for assay development and validation: the adrenergic receptors α2A, β1, and β2 (encoded by the genes ADRA2A, ADRB1, and ADRB2) and the chemokine receptor C-X-C type 4 (encoded by the gene CXCR4). Recombinant genes encoding each receptor with the HL1.0.1-TO1 FAP at the N-terminus were stably expressed in U937 and HEK 293 cells.
To quantify agonist-stimulated receptor internalization, we developed simple kinetic and dose-response protocols that take advantage of the membrane-impermeant nature of the two fluorogens. Cells are incubated with agonist at a fixed concentration for a variety of times, or at a range of concentrations for a fixed period. Pulse fluorogen is added at the beginning of each incubation and exchange fluorogen is added at the end, and signal in the red and green channels is measured shortly thereafter. The protocols thus have the following steps: (1) add pulse fluorogen plus agonist, (2) allow time for response, (3) add exchange fluorogen, and (4) measure fluorescent signal. Note that when exchange fluorogen is added at step 3, exchange is expected to occur for all receptor molecules at the cell surface, resulting in a change in surface color from red to green. No exchange is expected for receptor molecules that were internalized in response to agonist because the fluorogens are membrane impermeant. Thus, the red signal should provide a quantitative measure of internalized receptor and the green signal a quantitative measure of uninternalized receptor.
For CXCR4, we used the natural polypeptide agonist CXCL12, also known as SDF-1. For each of the three adrenergic receptors, we used the natural catecholamine agonists epinephrine and norepinephrine and the synthetic agonist isoproterenol. Data were collected two ways: by flow cytometry and by confocal microscopy.
Flow cytometric data from representative experiments are plotted in
Figure 2A
,
B
. The curves show a simple reciprocal relationship: when exchange fluorogen signal (green, representing surface receptor) goes down, pulse fluorogen signal (red, representing internalized receptor) goes up. Accordingly, the point at which the curves cross represents the ET50 or EC50 values for the particular receptor/agonist pair. The EC50 values for CXCL12 on CXCR4 in these experiments were similar to what has been reported for other cell-based assays that measure second messengers or other downstream events, but the EC50s for the adrenergic receptor agonists (see legend to
Fig. 2
and
Agonist-stimulated desensitization. (
Representative confocal micrographs for CXCL12-stimulated CXCR4 cells and for isoproterenol-stimulated β2AR cells are shown in Figure 2C . The postexchange images (panels labeled “pulse/exchange w agonist”) show clearly that the pulse fluorogen signal represents internalized receptor and the exchange fluorogen signal represents surface receptor.
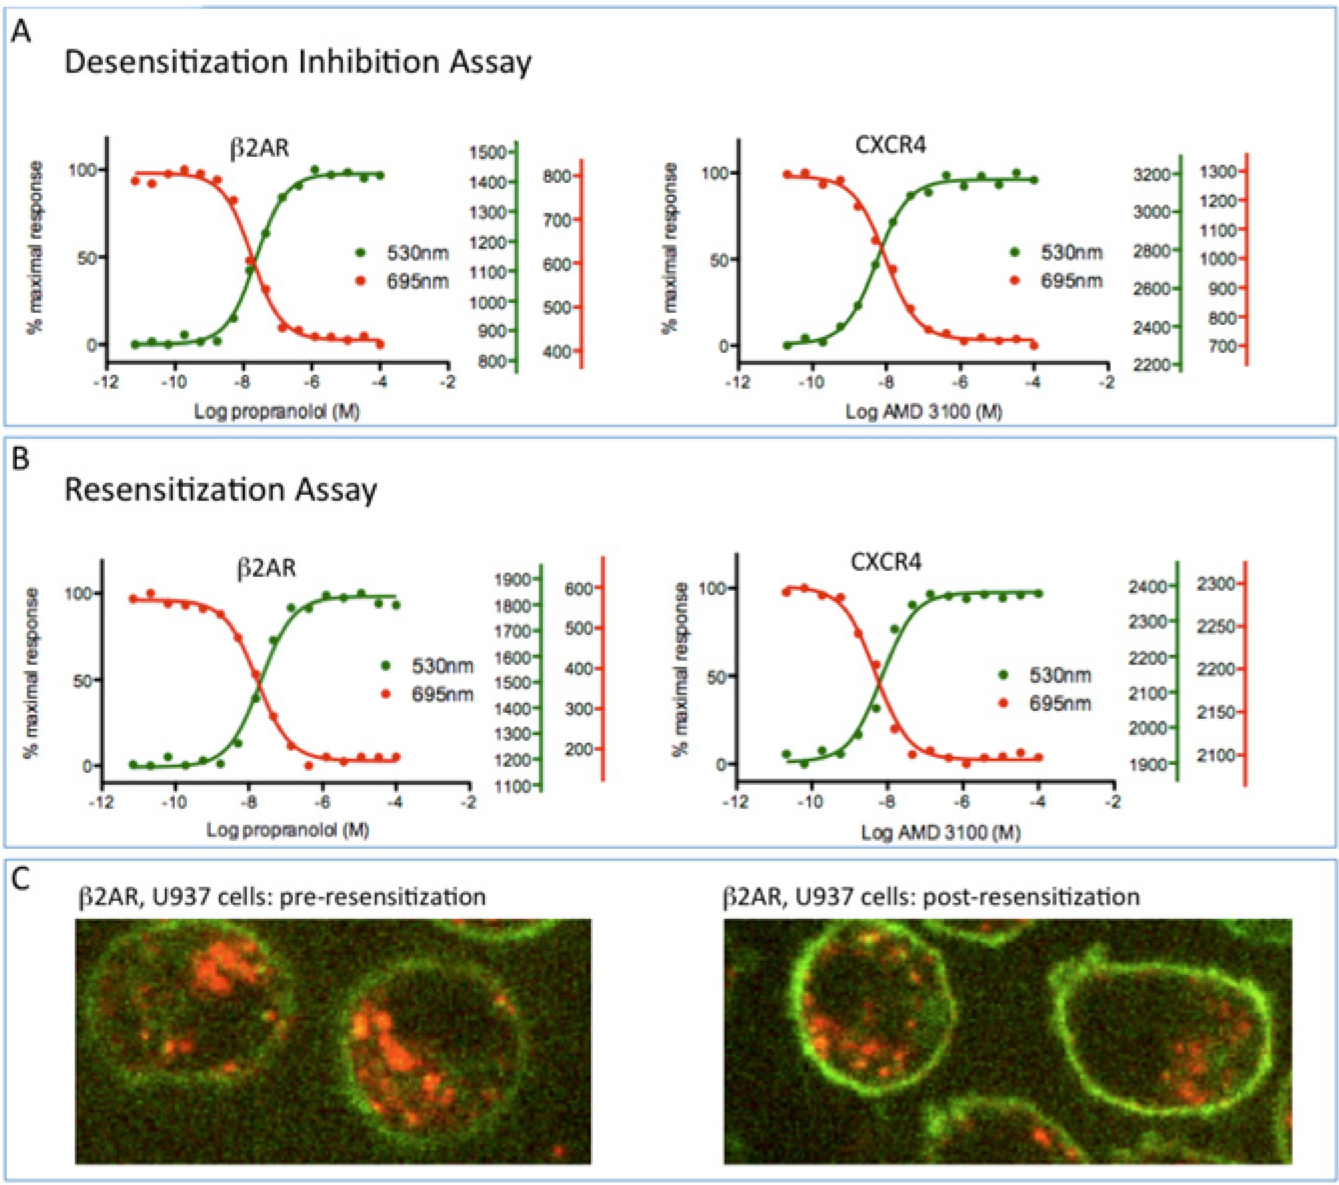
To measure antagonist activity, we modified the protocol to quantify inhibition of agonist-stimulated receptor internalization—a classic measure of antagonist activity. Cells were treated for a fixed period with a known agonist at a constant concentration along with antagonist at a range of concentrations. Then, 5 nM pulse fluorogen was added at the beginning of each incubation, and 350 nM exchange fluorogen was added at the end. The antagonist dose-response protocol thus has the following steps: (1) add pulse fluorogen plus agonist and antagonist, (2) allow time for response, (3) add exchange fluorogen, and (4) measure fluorescent signal.
Flow cytometric data for dose-response experiments of this kind are plotted in Figure 3A for inhibition of epinephrine-stimulated β2AR internalization by the β-adrenergic receptor antagonist propranolol and for inhibition of CXCL12-stimulated CXCR4 internalization by the antagonist AMD 3100. Additional experiments (not shown) showed that propranolol also inhibited internalization of the β1 receptor but was ineffective in inhibiting α2A receptor internalization, reflecting the known selectivity of propranolol for these receptors.
Antagonist-stimulated desensitization-inhibition and resensitization. (
In addition to measuring classic antagonist activity as described above, we also developed a protocol to detect and quantify receptor resensitization. In these experiments, cells were desensitized with agonist and then treated with antagonist at a variety of concentrations. The protocol has the following steps: (1) add pulse fluorogen plus agonist, (2) allow time for response, (3) add antagonist, (4) allow time for response, (5) add exchange fluorogen, and (6) measure fluorescent signal.
Experiments in which cells expressing the adrenergic receptors were exposed to epinephrine for 40 min followed by addition of propranolol showed the return of most previously internalized receptors to the surface with dose-response properties indistinguishable from those obtained in the desensitization assay ( Fig. 3B , left panel). Similar resensitization experiments with CXCR4 gave somewhat different results ( Fig. 3B , right panel); antagonist addition did not result in redistribution of already internalized receptors to the surface, although it did prevent internalization of receptor molecules that were still at the surface with the same dose-response values as in the desensitization assay. This is evident from inspection of the raw photocount values shown at the right of each graph. Figure 3C shows representative micrographs of non-resensitized (left panel) and resensitized (right panel) β2AR cells.
Finally, we used low-resolution fluorescence microscopy to show that the fluorogen exchange system is suitable for high-throughput analysis by imaging cytometry. U937 cells expressing FAP-tagged β2AR were subjected to the desensitization time-course protocol described previously, and fluorescence images in the red and green channels were acquired using a 20× low numerical-aperture air objective. Robust results were obtained from the analysis of a small number of cells (35) at each time point ( Fig. 4 ), indicating that the assays are well suited for automated data collection and analysis using currently available imaging cytometry systems.
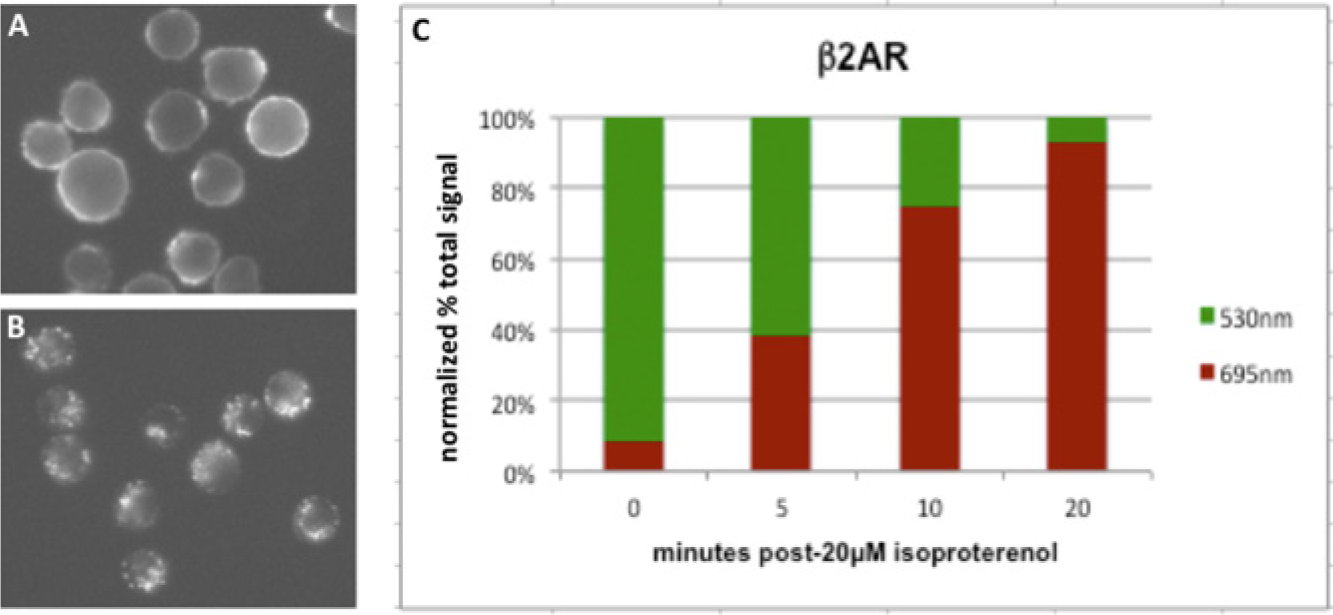
Time course of desensitization quantified by fluorescence microscopy at 20×. U937 cells expressing fluorogen-activating protein (FAP)–tagged β2AR were incubated with 5 nM pulse fluorogen and 20 µM isoproterenol for the indicated times, and then 350 nM exchange fluorogen was added and images were acquired and analyzed as described under Materials and Methods. (
A unique feature of the assays described here is that they are intrinsically self-checking: in the desensitization assay, signal from the pulse fluorogen goes up and signal from the exchange fluorogen goes down equivalently, and in the resensitization assay, signal from the exchange fluorogen goes up and signal from the pulse fluorogen goes down, again equivalently. This reciprocality gives the assays a self-checking quality (i.e., if reciprocality is not observed for a given compound, an off-target effect is likely). Reciprocality also means that relatively small effects, as expected for certain partial agonists, for example, may be taken seriously if both signals change in concert, whereas the equivalent small effect in a single-dimension assay might appear to be without significance. We note that if the internalized receptor is degraded at longer times, 8 this will be reflected in a reduction of the pulse fluorogen signal, an assay output that could be used to quantify receptor lifetime.
We and colleagues recently described a related single-color FAP-based assay for loss of receptor at the cell surface 7 that has been was applied to a number of screens against GPCRs using high-throughput flow cytometry,9,10 including a screen of approximately 350,000 compounds against the human β2 adrenergic receptor. 11 In addition to bona fide agonists, the screen identified a number of compounds that reduce surface signal not by stimulating the receptor but by inhibiting fluorogen activation by the FAP. These compounds are interesting in their own right, but in the context of drug screening, they represent undesired false-positive hits. With the fluorogen exchange assay, such compounds would not be scored as hits in the primary screen due to absence of reciprocality.
The assays described here can be applied to any receptor whose biology includes desensitization, irrespective of whether the desensitization mechanism is known and irrespective of whether the receptor is well characterized or is an orphan. Not only might new agonists, reverse agonists, and antagonists be discovered in this way, but the system offers opportunities to discover molecules that potentiate or inhibit receptor internalization or recycling independent of signaling—molecules that are likely to be missed by standard approaches. Such molecules would be expected to alter the sensitivity and/or the intensity of the response governed by the receptor on a time scale measured in tens of minutes or longer, and as such they might represent new classes of drugs to be used in combination with known drugs or by themselves.
Footnotes
Acknowledgements
We thank Brigitte Schmitt for the synthesis of TO1-2p-Cy5, Yehuda Creeger for assistance with flow cytometry, and Haibing Teng for assistance with confocal microscopy.
Declaration of Conflicting Interests
The authors declared the following potential conflicts of interest with respect to the research, authorship and/or publication of this article: CS-G and ASW are shareholders in Sharp Edge Labs Inc, and JWJ is a shareholder in SpectraGenetics Inc. Both companies have licensed certain rights to the FAP technology from Carnegie Mellon University.
Funding
The authors disclosed receipt of the following financial support for the research, authorship, and/or publication of this article: This work was supported by grant U54 GM103529 from the National Institute of General Medical Sciences, National Institutes of Health.
References
Supplementary Material
Please find the following supplemental material available below.
For Open Access articles published under a Creative Commons License, all supplemental material carries the same license as the article it is associated with.
For non-Open Access articles published, all supplemental material carries a non-exclusive license, and permission requests for re-use of supplemental material or any part of supplemental material shall be sent directly to the copyright owner as specified in the copyright notice associated with the article.