
Abstract
Ligand-dependent receptor internalization is a feature of numerous signaling systems. In this article, the authors describe a new kind of live-cell biosensor of receptor internalization that takes advantage of fluorogen-activating protein (FAP) technology. Recombinant genes that express the human beta2 adrenergic receptor (β2AR) with FAP domains at their extracellular N-termini were transduced into mammalian cells. Exposure of the cells to membrane-impermeant fluorogens led to a strong fluorescent signal from the cell surface. Agonist-dependent translocation of the receptor from the surface to the cell interior was readily observed and quantified by fluorescence microscopy or flow cytometry in a homogeneous format without wash or separation steps. The approach described here is generalizable to other receptors and cell surface proteins and is adaptable to a variety of fluorescence-based high-throughput screening platforms.
Keywords
Introduction
R
For many GPCRs, internalization is known to depend on the activity of a GPCR-kinase (GRK) that phosphorylates amino acids in the C-terminal tail of the receptor. This is followed by recruitment of β-arrestin to the phosphorylated receptor, clathrin pit formation, and internalization of the GPCR by endocytosis. 1 Internalized receptor molecules can have a variety of fates; they may rapidly recycle to the cell surface, they may slowly recycle, or they may not recycle at all. The complexities of postendocytic sorting are not fully understood and can vary considerably depending on the particular GPCR, the particular agonist, and/or the particular cell type. 2
Cell-based assays have been developed that measure many different components of GPCR response. These include second-messenger production or mobilization, 3 activation of reporter genes, 4 modification of downstream proteins, 5 changes in cell morphology or structure, 6,7 and β-arrestin translocation to the cell cortex. 8,9 All of these assays are useful, but because they look at downstream events and not at the GPCR itself, they are susceptible to off-target artifacts when used in high-throughput screening applications.
Some cell-based assays do look directly at the GPCR of interest. In the case of the human beta2 adrenergic receptor (β2AR), assays have been described that use antibodies to detect the protein at the cell surface, 10 but these assays are difficult to adapt to high-throughput formats because a number of wash steps are required prior to readout. Other approaches use green fluorescent protein (GFP)–GPCR fusion proteins. 11,12 In principle, these can be adapted for use in image-based high-content screens, but because signal intensity per cell does not change during cellular response, they are intrinsically unsuitable for high-throughput applications that measure signal intensity rather than subcellular location.
In this article, we describe a new kind of GPCR biosensor that can detect receptor internalization as a change in signal location or intensity. The sensor makes use of a set of recently described bipartite fluoromodules, each comprising a fluorogen-activating protein (FAP) and a small molecule (fluorogen) whose fluorescence increases dramatically when noncovalently bound by the FAP. 13
As a model for biosensor development, we chose β2AR, a catecholamine-responsive GPCR that is expressed in brain, heart, lung, and a number of other tissues. 14 As one of the most-studied GPCRs, β2AR provides an excellent test bed for FAP-based biosensor development.
A variety of β2AR fusion proteins with FAPs at their extracellular N-termini were expressed in NIH 3T3 mouse fibroblasts and in U937 human lymphoblasts. Receptor internalization consequent to agonist treatment was monitored by fluorescence microscopy and by flow cytometry. In both of these modes, the new biosensors provided a robust readout of receptor internalization.
Materials and Methods
Reagents
(−)-Isoproterenol(+)bitartrate and DL-Propranolol HCL were from Sigma-Aldrich (St. Louis, MO). Cellstripper was purchased from Mediatech (Manassas, VA).
Plasmids and retroviral vectors
Expression vector pDisplaySacLac2 was constructed as follows. The SacB gene was PCR-amplified from the vector pDNR-1r (Clontech, Mountain View, CA) using primers TATATAGGCCCAGCCGGCCC CACATATACCTGCCGTTCAC and TATATAGGCCCCTGCGGCCA CGTCAATGCCAATAGGATATCG. The amplicon was cut with SfiI and cloned into SfiI-digested pDisplayBlue 13 to produce pDisplaySac. Primers AGAGGATCTGAATGCTGTGG and CTCGAGCTAACGCCACCTGCTGGCATCGTCCAGGCTGTGGACGTGGCT TCTTCTGCCAA were used to generate an amplicon from a pDisplayBlue template that contained the transmembrane domain; the amplicon was cut with BsmI and XhoI and ligated into BsmI/XhoI-digested pDisplaySac. The resulting construct was digested with PflMI. Primers CCACAGCCTGGGTTAG CTCACTCATTAGGCA and CCACCTGCTGGCTAA CGCCAGTTTGAGGGGACGACGA were used to generate an amplicon from a pDisplayBlue template that contained the lacZ alpha-complementing fragment, and PflMI-digested amplicon was ligated into the construct to create pDisplaySacLac2.
Expression vector pBabeSacLac2 was constructed as follows. pBabe-puro-H-Ras-V12 (Addgene, Cambridge, MA), which carries an SfiI site upstream of the puromycin resistance gene, was linearized with SfiI, treated with T4 polymerase to create blunt ends, and self-ligated to create a derivative without an SfiI site. This plasmid was digested with BamHI and SalI to produce a recipient fragment. pDisplaySacLac2 was digested with BamHI and XhoI, and a 650-bp BamHII/XhoI fragment was recovered and ligated into the recipient fragment to produce pBabeSacLac2.
Fosmid G248P86156H5 containing the complete human ADRB2 gene (encoding β2AR) was obtained from the BacPac Resources Center (Oakland, CA). The β2AR-encoding ORF was PCR amplified from the fosmid using primers GATCTGAATGCTATGGGGCAACCCGG and CCCACAGCATTCTACAGCAGTG AGTCATTTCTACTACAATT and cloned into the BsmI site of pBabeSacLac2 to produce pBabeSacADRB2Lac2. Vectors pBabeHL4-MG-ADRB2Lac2 and pBabe-HL1.0.1-T01-ADRB2Lac2 were generated by cloning HL4-MG and HL1.0.1-T01 13 sequences flanked by SfiI sites into SfiI-digested pBabeSacADRB2Lac2. Sequence analysis of the β2AR coding sequence revealed that the parent fosmid contained the following amino acids at positions of known polymorphisms: Arg (AGA codon) at position 16, Gln (CAA codon) at position 27, T (ACC codon) at position 164, and S (TCC codon) at position 220.
Mammalian cells and culture conditions
NIH 3T3 cells were grown at 37°C, 5% CO2 in Dulbecco’s modified Eagle’s medium (DMEM) plus 10% calf serum, 100 U/mL penicillin, and 100 µg/mL streptomycin. U937 cells were grown under the same conditions in RPMI 1640 plus 10% heat-inactivated fetal bovine serum (FBS), 100 U/mL penicillin, and 100 µg/mL streptomycin.
Transfection
Transfections were performed using Mirus TransIT®-LT1 Transfection Reagent (product no. MIR 2300; Mirus Bio, Madison, WI) and pDisplaySacLac2 vectors. For 35-mm dishes: DNA (2.5 µL, concentration of 1 µg/mL) was added to 7.5 µL TransIT®-LT1 in 250 µL DMEM. Transfection complexes were allowed to form for 30 min and subsequently added to cells grown in antibiotic-free DMEM with 10% FBS for NIH 3T3 cells or added to U937 cells grown in antibiotic-free RPMI-1640 with 10% FBS. Transfection complexes were removed and medium changed after 24 h.
Transduction
NIH 3T3 cell lines stably expressing pBabeSacLac2 constructs were generated using the Phoenix Ecotropic Packaging System (ATCC product SD 3444; ATCC, Manassas, VA). Phoenix-Ecotropic cells were plated at 1.3 × 10⁶ cells/75-cm2 flask in DMEM with FBS without antibiotics. pBabeSacLac2 DNA was transfected as described above, scaled to surface area. After 24 h, transfection complexes were removed and replaced with 8 mL DMEM with FBS and incubated for 48 h at 32°C/5% CO2. Medium was removed and filtered through a Millex-HV 0.45-µm syringe filter and flash frozen in liquid nitrogen. U937 cell lines stably expressing pBabeSacLac2 constructs were generated using the Phoenix-GP Packaging system (ATCC product SD 3514). The transfection of the Phoenix-GP cells was the same as that of the Phoenix-Eco cells, except that the Phoenix GP cells were plated at 1.6 × 10⁵ cells/75-cm2 flask in DMEM with FBS without antibiotics, and pseudotyping was accomplished by adding 1 mg VSV-G DNA for every 10 mg pBabeSacLac2 DNA used. NIH 3T3 cells or U937 cells were plated at 2 × 10⁵ cells/35-mm dish 3 h prior to transduction. NIH 3T3 cells were infected by adding viral supernatant and 6 µg/mL hexadimethrine bromide. U937 cells were infected by adding viral supernatant diluted 1:1 with RPMI-1640 with FBS and 6 µg/mL hexadimethrine bromide. All cells were incubated for 24 h at 32°C/5% CO2, replated in 75-cm2 flasks, and screened for expression 48 h later.
FAPs and fluorogens
The fluorogen-activating proteins used in this study were the scFvs HL1.0.1-T01 and HL4-MG. The fluorogens used in this study were the membrane-impermeant molecules T01-2p, a derivative of thiazole orange, and MG-11p, a derivative of malachite green. Detailed information about the structures and properties of these FAPs and fluorogens is given in Szent-Gyorgyi et al. 13
Fluorescence microscopy
Cells were grown in DMEM plus 10% calf serum (NIH 3T3) or in RPMI-1640 with FBS (U937) in 23-mm glass- bottom dishes (part no. p35G-1.5-14-C; MatTek, Ashland, MA). For cells expressing FAP HL1.0.1-T01, 100 nM T01-2p was added 10 min prior to imaging; for cells expressing FAP HL4-MG, 100 nM MG-11p was added 10 min prior to imaging. Imaging was performed using an Olympus IX50 microscope equipped with a spinning disk confocal imaging system (Solamere Technology Group, Salt Lake City, UT). For T01-2p, excitation was a 488-nm Argon laser and a 500-nm long-pass filter for emission (HQ500LP; Chroma Technologies, Santa Fe Springs, CA). For MGL-11p, an HBO 100-watt light source was used with appropriate filters (HQ620/60 ex and HQ700/75 em; Chroma Technologies), with the emitted light passing to the camera through the spinning disk. Images were acquired using a Photometrics CoolSnap HQ CCD camera (Photometrics, Tucson, AZ). Illumination intensity and gain settings on the microscope were held constant for all observations.
Flow cytometry
Cells were analyzed using a Becton Dickinson FACS Vantage SE Flow Cytometer with FACS Diva option (Becton Dickinson, Franklin Lakes, NJ). Argon 488-nm and HeNe 623-nm lasers were used to excite T01-2p and MG-11p, respectively. Emission filters were 530/30 and 685/35 nm. Quantitation was carried out using FlowJo software (TreeStar, Inc., Ashland, OR). Mean intensity values were determined by gating 60% or more of the total cell population. In experiments where multiple samples were compared, the same gate was applied to all. Curve fitting of kinetic and dose-response data was done using GraphPad Prism (GraphPad Software, La Jolla, CA).
Results and Discussion
Selective labeling of receptors at the cell surface using membrane-impermeant fluorogens
Stable transductants expressing FAP-tagged β2AR were generated in NIH 3T3 mouse fibroblasts and U937 human lymphoblasts.
When imaged by fluorescence microscopy in the presence of membrane-impermeant fluorogens, cells expressing FAP-tagged receptor showed signal exclusively at the cell surface ( Figs. 1A1 , B1 ). Signal appeared within seconds of T01-2p addition to cells expressing the HL1.0.1-T01 FAP and within 1 to 2 min of MG-11p addition to cells expressing the HL4-MG FAP.
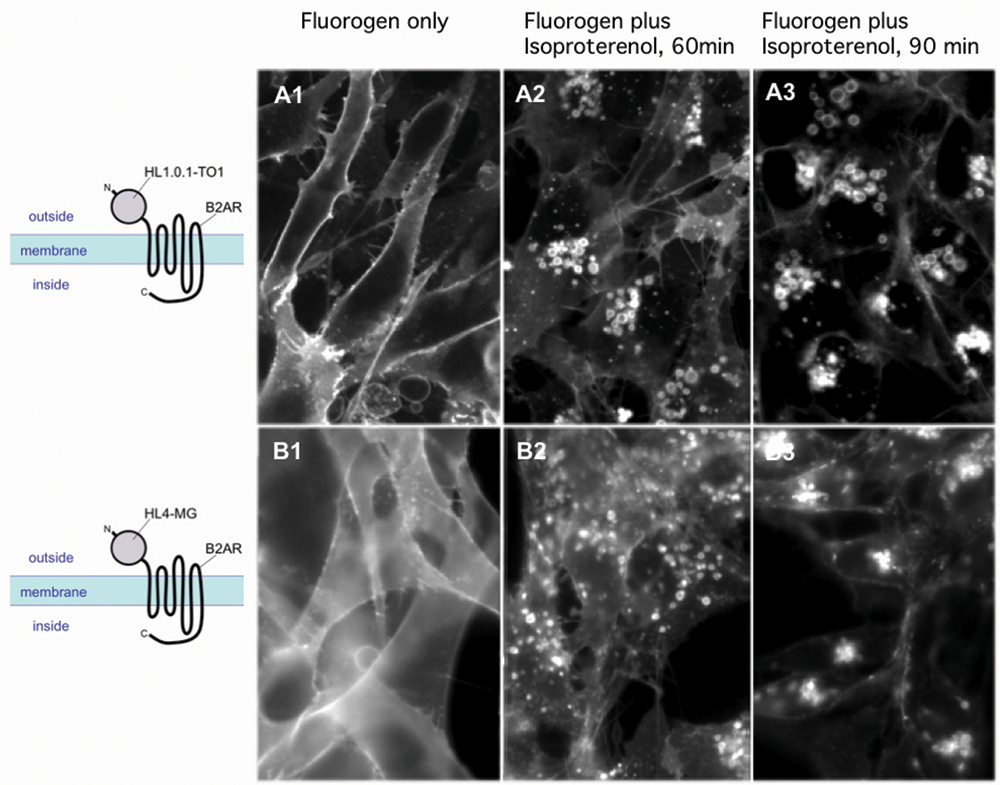
Agonist-stimulated internalization of human beta2 adrenergic receptor (β2AR) fusion proteins in NIH 3T3 cells. NIH 3T3 transductants stably expressing (
Agonist-stimulated internalization of FAP-tagged β2AR
When FAP-tagged NIH 3T3 transductants were exposed to 10 µM isoproterenol, a strong β2AR agonist, and observed at intervals by fluorescence microscopy, translocation of signal from the surface to cytoplasmic vesicles was apparent within minutes, with much of the internalized protein coalescing into relatively large cytoplasmic units (vesicles) over 60 min ( Figs. 1A2 , B2 ) that became perinuclear by 90 min ( Figs. 1A3 , B3 ). For U937 cells, the results were largely the same. In the absence of agonist, fluorescence was limited to the cell surface early after fluorogen addition ( Fig. 2A ) or at later times ( Fig. 2B ). Stimulation with 10 µM isoproterenol resulted in reduction of surface intensity and appearance of signal in large cytoplasmic vesicles ( Fig. 2C ).
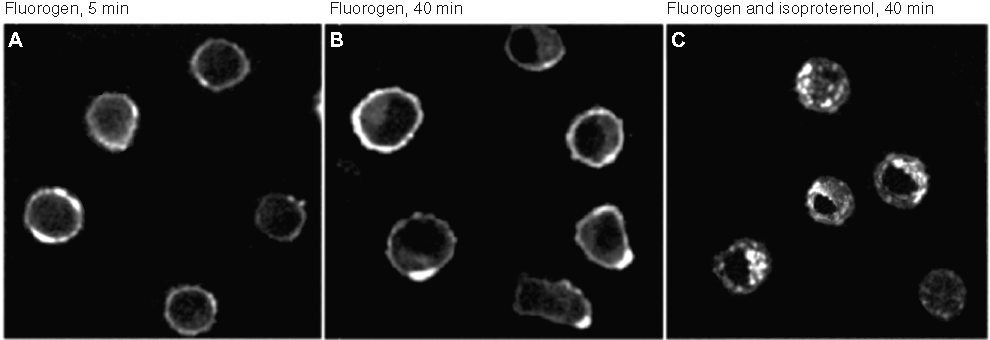
Agonist-stimulated internalization of human beta2 adrenergic receptor (β2AR) fusion proteins in U937 cells. U937 cells stably expressing HL1.0.1-T01-β2AR were imaged (
Quantitation of receptor internalization: the surface fluorescence depletion assay and the internal fluorescence accumulation assay
To quantify receptor internalization, we developed 2 complementary approaches, both using membrane-impermeant fluorogen.
In the first approach, which we call the surface fluorescence depletion assay, fluorogen is added to cells that have been stimulated with agonist and to unstimulated control cells, and fluorescence is measured. Signal intensity is expected to fall in the stimulated cells as a consequence of receptor internalization, with the extent of signal reduction relative to the control representing a quantitative measure of receptor internalization.
In the second approach, which we call the internal fluorescence accumulation assay, fluorogen plus agonist is added to cells; controls receive fluorogen without agonist. Trypsin is subsequently added to each culture to remove surface FAPs, and fluorescence is measured. Signal intensity is expected to rise in the stimulated cells as a consequence of receptor internalization, with the extent of signal increase relative to the control representing a quantitative measure of receptor internalization.
In the surface fluorescence depletion assay experiment shown in Figure 3A , HL1.0.1-T01-tagged U937 cells were incubated with 10 µM isoproterenol for 40 min, nonpermeant fluorogen was added, and the cells were analyzed by flow cytometry. Signal from the stimulated cells (blue peak) was diminished by about 800 intensity units compared to control cells that did not see agonist (red peak). Images of control and agonist-stimulated cells collected during the experiment are shown in Figures 3B , C .
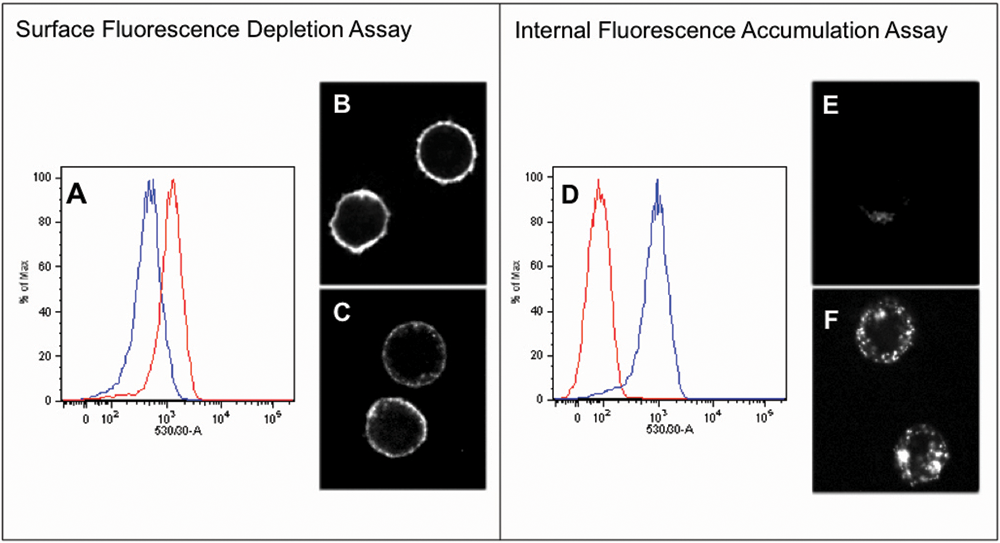
Surface fluorescence depletion and internal fluorescence accumulation assays. (
In the internal fluorescence accumulation assay experiment shown in Figure 3D , cells were incubated with isoproterenol and fluorogen for 40 min, trypsin was added to remove surface FAPs, and the cells were analyzed by flow cytometry. Average signal from the stimulated cells (blue peak) was about 850 intensity units greater than from the unstimulated control cells (red). Images of control and agonist-stimulated cells from the experiment are shown in Figures 3E , F .
Surface depletion and internal accumulation experiments were also performed with U937 cells expressing HL4-MG tagged receptor and with NIH 3T3 cells expressing both HL1.0.1-T01 and HL4-MG tagged receptor. NIH 3T3 cells were brought into suspension using Cellstripper so that surface proteins remained intact. In each case, the results were qualitatively the same as for the HL1.0.1-T01 experiments.
Time course of agonist-stimulated receptor internalization
Figure 4A shows the results of a surface depletion time-series experiment in which cells were stimulated with 10 µM isoproterenol at time zero and assayed by flow cytometry in the presence of fluorogen at a number of times thereafter. Signal began to fall after a few minutes and continued to fall over the next 45 min or so and then leveled off at about one third of the initial value. This time course is consistent with many previous observations 8,11,13 and reflects the fact that internalization is a slow process relative to G-protein-mediated signaling or biochemical desensitization via receptor phosphorylation and arrestin mobilization.
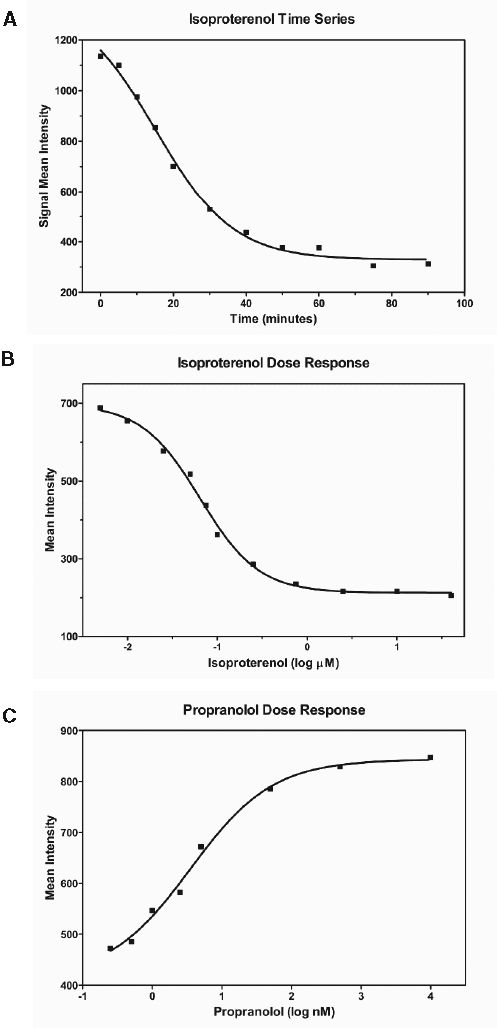
Kinetic and dose-response assays. (
Dose-response measurements for isoproterenol stimulation
Figure 4B shows the results of a dose-response experiment in which surface depletion assays were performed on cells treated with a range of isoproterenol concentrations. Fluorescence was determined by flow cytometry 45 min after stimulation for each concentration of drug.
The dose-response EC50 is approximately 65 nM, significantly greater than published EC50 values obtained when rapid signaling events such as G-protein-mediated increases in cAMP levels 11 have been measured. Our results should not be viewed as contradictory to those results, however, because our assay looks directly at the receptor rather than at signaling events that may proceed to completion even when many or most of the receptor molecules do not participate.
Dose-response measurements for the β2AR antagonist propranolol
Figure 4C shows dose-response data for inhibition by the beta-adrenergic receptor antagonist propranolol of isoproterenol-mediated receptor internalization. FAP-tagged U937 cells were treated with 10 mM isoproterenol plus a range of concentrations of propranolol, and surface signal was assayed by flow cytometry 45 min later. Propranolol inhibited the isoproterenol response with an IC50 of approximately 3.5 nM. FAP-tagged receptors thus provide a means for detecting receptor antagonists and, by extension, other molecules that change agonist response.
Homogeneous nature of the new assays and relevance to GPCR screening programs
Both the surface fluorescence depletion assay and the internal fluorescence accumulation assay are homogeneous in nature, with no separation steps (e.g., filtration or centrifugation) intervening between reagent addition and readout. This feature makes them particularly well suited to automated high-content applications or to automated assay platforms that do not depend on imaging at all, such as fluorimetry in microplate formats or high-throughput flow cytometry. 15 Such assays could contribute to a variety of drug development objectives, including identifying new agonists or antagonists for receptors of interest, de-orphanizing orphan receptors, evaluating known drugs to confirm or establish their GPCR targets, and measuring cross-reactivity of compounds to multiple GPCRs.
Footnotes
Acknowledgements
We thank Yang Wu, Larry Sklar, and Chris Szent-Gyorgyi for useful discussions.
This work was supported by grant U54 RR022241 from the National Center for Research Resources, National Institutes of Health.