
Abstract
G protein–coupled receptors (GPCRs) are one of the most popular and proven target classes for therapeutic intervention. The increased appreciation for allosteric modulation, receptor oligomerization, and biased agonism has led to the development of new assay platforms that seek to capitalize on these aspects of GPCR biology. High-content screening is particularly well suited for GPCR drug discovery given the ability to image and quantify changes in multiple cellular parameters, to resolve subcellular structures, and to monitor events within a physiologically relevant environment. Focusing on the sphingosine-1-phosphate (S1P1) receptor, we evaluated the utility of high-content approaches in hit identification efforts by developing and applying assays to monitor β-arrestin translocation, GPCR internalization, and GPCR recycling kinetics. Using these approaches in combination with more traditional GPCR screening assays, we identified compounds whose unique pharmacological profiles would have gone unnoticed if using a single platform. In addition, we identified a compound that induces an atypical pattern of β-arrestin translocation and GPCR recycling kinetics. Our results highlight the value of high-content imaging in GPCR drug discovery efforts and emphasize the value of a multiassay approach to study pharmacological properties of compounds of interest.
Introduction
G protein–coupled receptors (GPCRs) represent the largest superfamily of membrane proteins in the body. Given their versatility and their widespread expression throughout the body, GPCRs have long been considered to be attractive targets for therapeutic intervention. In the classic paradigm, agonist stimulation of a GPCR stabilizes an active receptor conformation, which in turn results in the activation of a heterotrimeric (αβγ) G protein. G protein activation catalyzes the release of guanosine 5′-diphosphate (GDP) followed by the subsequent binding of guanosine 5′-triphosphate (GTP) to the Gα subunit. The Gα and Gβγ subunits then dissociate from each other and relay signals to downstream effectors, such as second messenger–generating enzymes and ion channels, ultimately initiating signaling cascades that mediate a variety of cellular functions. 1
Following agonist activation, GPCRs undergo desensitization and internalization, limiting the duration and magnitude of the response despite continued agonist availability and thereby preventing overstimulation of the receptor. These events are mediated predominantly by two classes of proteins: GPCR kinases (GRKs) and β-arrestins. GRKs phosphorylate serine and threonine residues on the intracellular domains of the GPCR, and these posttranslational modifications initiate the recruitment and binding of β-arrestin to the GPCR.2,3 Binding of β-arrestin to the receptor sterically hinders G protein coupling, thereby terminating G protein–mediated signaling to “desensitize” the receptor. 3 In addition, β-arrestins target the GPCR for endocytosis in clathrin-coated pits by acting as a scaffold to link the GPCR with clathrin and AP-2. 4 Once internalized, the GPCR can be either recycled back to the cell membrane for further activation or targeted for degradation. 5
In addition to their role in desensitization, β-arrestins are now recognized for their ability to mediate signaling cascades independent of G protein activation. 6 Specifically, β-arrestins serve as molecular scaffolds bringing together specific components of a signaling network, thereby facilitating access of those components to one another and ensuring fidelity of a signaling response (reviewed in DeWire et al. 7 ). Multiple examples have been described whereby agonist activation of a GPCR causes β-arrestin–dependent signaling with little or no G protein–dependent signaling. Similarly, agonists capable of producing a G protein–mediated response without a β-arrestin–dependent response have also been described (reviewed in Whalen et al. 6 ). The ability of agonists to selectively activate either β-arrestin– or G protein–mediated signaling pathways has been termed biased agonism. Importantly, the existence of biased agonism has been shown to be therapeutically relevant for several GPCRs, 6 generating significant interest in the identification of biased agonists with preference for either β-arrestin– or G protein–mediated signaling.
With a growing interest in identifying biased ligands, there is increased need for assay platforms that can monitor events such as β-arrestin recruitment and receptor internalization in a high-throughput manner. One approach for monitoring β-arrestin recruitment to activated GPCRs is to use cells that express fluorescently tagged β-arrestin. By overexpressing a specific GPCR in these cells, agonist-induced redistribution of β-arrestin can be quantified using a high-content imaging instrument with accompanying image analysis software. 8 Focusing on the sphingosine-1-phosphate (S1P) receptor 1, we evaluated this approach alongside an aequorin assay by screening a diverse compound library using both assay formats. The aequorin assay uses the aequorin photoprotein as a reporter to monitor dynamic changes in intracellular Ca2+ and is a commonly used platform for hit identification of GPCR compounds. Select compounds identified in this parallel screening effort were then further characterized using a panel of assays. This multipronged approach identified compounds with unique profiles; one compound showed a profile suggestive of a G protein–biased agonist, and another appears to be a complete β-arrestin–biased agonist. The latter compound also caused a distinct subcellular localization pattern for β-arrestin and altered the trafficking properties of the S1P1 receptor. Our results emphasize the advantages of using high-content imaging to identify compounds with unique endocytic properties, and they highlight the value of a parallel assay approach to best characterize the pharmacological properties of compounds of interest.
Materials and Methods
High-Content β-Arrestin Redistribution Assay
U2OS β-arrestin–RrGFP, expressing a rat-β-arrestin–RrGFP (Renilla reniformis green fluorescent protein), was obtained from Molecular Devices Corporation (Sunnyvale, CA). Cells were maintained in minimum essential medium (MEM) supplemented with L-glutamine, 10% heat-inactivated fetal bovine serum (FBS), and 800 µg/mL G418. Baculovirus stocks were used to overexpress the S1P1 receptor (GenBank ID: 1901; NCBI accession NM_001400.4).
For quantification of β-arrestin–GFP internalization, cells diluted to 7.5 × 10⁴ cells/mL in assay medium (MEM supplemented with 10% heat-inactivated FBS) were plated at 20 µL/well in 384-well black, clear-bottom tissue culture plates (BD Falcon, San Jose, CA) for a final cell density of 1500 cells/well. Cells were incubated overnight at 37—°C in a humidified CO2 incubator. The following day, 5 µL of baculovirus was added directly to the cells using a Combi dispenser (Thermo Fisher, Waltham, MA) for a final viral titer of 1 × 10⁷ pfu/mL, and cells returned to the incubator overnight. On day 3, media were aspirated using a microplate washer (Elx405; BioTek, Winooski, VT) and replaced with 25 µL of serum-free media. After 30 min, 167 nL of compound in neat DMSO (columns 1–23) or DMSO alone (column 24) was acoustically dispensed using an Echo 550 (Labcyte, Sunnyvale, CA) into the cell plates to obtain a final compound concentration of 20 µM. Plates were returned to the incubator following compound addition for 45 min prior to addition of a solution containing formaldehyde and Hoechst (1.6% final formaldehyde, 2 µg/mL final Hoechst stain) for 15 min. Fixative/Hoechst stain was washed twice with 50 µL phosphate-buffered saline (PBS) using the microplate washer, plates were sealed, and then images were acquired and processed using the Opera HCS reader (PerkinElmer, Waltham, MA) and the Acapella Spot Detection algorithm (PerkinElmer), respectively.
GPCR Internalization Assay
CHO-K1 cells overexpressing the S1P1 receptor (GenBank ID: 1901; minus the stop codon) fused to the coding sequence for enhanced green fluorescent protein (EGFP) were used for monitoring receptor internalization. Cells were harvested and diluted to 6 × 10⁴ cells/mL in assay medium (F12 with L-glutamine, 5% charcoal-treated serum, 1% penicillin-streptomycin, 25 mM HEPES). Cells were plated at 25 µL/well in 384-well black, clear-bottom tissue culture plates (BD Falcon) for a final density of 1500 cells/well. Cells were incubated overnight at 37—°C in a humidified CO2 incubator. Using a source plate containing serially diluted compound, 150 nL was transferred to the assay plate using an Echo 550 (Labcyte) providing 10-point concentrations starting at 60 µM final and serially diluted 3-fold. Plates were returned to the incubator for 45 min, fixed, and washed as described for the Transfluor protocol, and images were acquired on the Opera and analyzed using a custom algorithm designed to quantify spots within a perinuclear region.
High-Content Assay to Monitor GPCR Recycling Kinetics
Detailed methods for monitoring the GPCR recycling kinetics have been described previously. 9 Briefly, cells were plated as described above for the internalization assay. Cells were then treated with compound and incubated for 45 min to allow for receptor internalization. The cells were then washed using a gentle dilution washing method and then incubated for various durations (0, 1, 4, 8, and 24 h) to allow receptor recycling back to the membrane. Cells were then fixed and washed as described earlier and images acquired.
Aequorin Assay for Mobilization of Internal Calcium Stores
The aequorin assay used a clone of Chinese hamster ovary (CHO) cells stably expressing the full-length S1P1 receptor complementary DNS (cDNA), as well as the pcAEQ plasmid (PerkinElmer), which contains the full coding sequence for the mitochondrially targeted apo-aequorin protein. These cells were maintained in F12 medium (1765-047; Invitrogen, Carlsbad, CA) supplemented with 10% FBS, 1 mg/mL G418, and 300 µg/mL Zeocin (Thermo Fisher/Life Technologies, Waltham, MA). Approximately 8 to 12 h prior to each experiment, cells were harvested and resuspended to a final density of 3 × 10⁶ cells/mL in loading medium (DMEM/F12, 0.1% bovine serum albumin [BSA], and penicillin-streptomycin). Cells were then incubated in the presence of 5 µM Coelenterazine h (DiscoveRx, Fremont, CA) with gentle shaking. To identify compounds with agonist activity, 1536-well clear-bottom plates (Corning, Corning, NY) were preplated with compound followed by a 2-µL dispense/well of cells using the Lumax (CyBio, Jena, Germany) for a final density ranging from 1000 to 1500 cells/well. Luminescent measurements were captured for 15 s immediately following cell dispensation, and the integrated area under the curve was recorded using the CyBi-Lumax software (CyBio).
GPCR Filtration Binding
CHO-K1-GPCR Membrane Preparation
The GPCR binding filtration assay used a pool of CHO cells stably expressing full-length S1P1 receptor cDNA from the MYC_PCDNA_GATE_IRES plasmid full length (similar to that described for aequorin but without the pcAeq plasmid). Cell pellets were resuspended in cold homogenization buffer (20 mM HEPES [pH 7.5], 50 mM NaCl, 2 mM EDTA, and protease inhibitor tablet) and homogenized for 10 s on ice with a Polytron LS10-35 (KineMatica GmbH, Luzern, Switzerland) homogenizer. Lysates were then centrifuged at 20,000 rpm (48,000 g) for 12 min at 4—°C, supernatant was removed, and pellets were resuspended in buffer (50 mM HEPES [pH 7.5], 100 mM NaCl, 1 mM MgCl2, 2 mM EDTA, and protease inhibitor tablet). Protein concentrations were determined using the bicinchoninic acid (BCA) procedure, and membrane homogenates were diluted in buffer (50 mM HEPES [pH 7.4], 5 mM MgCl2, 1 mM CaCl2, 0.5% BSA, and 1 mM NaF) to a stock concentration of 20 µg/mL before storage at −80—°C.
GPCR Filter Binding Assay
For competition experiments, 50 µL of the CHO-K1-S1P1R membrane suspension was added to 384-well plates containing compound. [33P]-S1P1 was diluted to 0.09 nM in assay buffer, and 25 µL of the radioligand solution was added to the compound plate for a final concentration of 0.03 nM. Plates were incubated at room temperature for 1 h. The entire mixture was transferred onto a 384-well FB filter binding plate (Millipore, Billerica, MA), and the filter was washed four times with water before drying plates at 60—°C for 45 min. Plates were sealed on the bottom, and 30 µL scintillation fluid per well was added, followed by sealing on the top. One hour later, the membrane-bound [33P]-S1P1 was measured using a scintillation plate reader (Top-Count; PerkinElmer).
Measurement of Intracellular cAMP Concentration
Given that the GPCR of interest is a Gi-coupled receptor, the compound-induced inhibition of forskolin-stimulated cAMP accumulation was measured. To quantify cAMP levels, we used HTRF (Homogenous Time-Resolved Fluorescence) technology from CisBio International (Codolet, France). Cryopreserved CHO cells that overexpress the S1P1 receptor were thawed, diluted in PBS, and plated at 5000 cells/well/5 µL on 384-well Optiplates containing 100 nL of compound (in neat DMSO) and 5 µL of a solution containing 1 µM forskolin and 100 µM 3-isobutyl-1-methylxanthine (IBMX) in PBS. Incubation was performed at room temperature for 30 min, and then 5 µL of d2-conjugated cAMP was added, followed by addition of 5 µL of europium cryptate–conjugated anti-cAMP antibody. Plates were incubated in the dark for 60 min, and the ratio of fluorescence emission at 665 nm/620 nm was obtained using an EnVision plate reader (PerkinElmer).
Tango GPCR Assay
The Tango GPCR-bla U2OS cells were obtained from Invitrogen. These cells contain the human S1P1 receptor cDNA linked to a TEV protease site and a Gal4-VP16 transcription factor integrated into the Tango GPCR-bla U2OS parental cell line. Cells were maintained in McCoy’s 5A medium containing 10% dialyzed FBS, 0.1 mM nonessential amino acids (NEAA), 25 mM HEPES, 1 mM sodium pyruvate, 100 U/mL penicillin, 100 µg/mL streptomycin, 200 µg/mL Zeocin, 50 µg/mL hygromycin, and 100 µg/mL Geneticin (Life Technologies). Cells were plated 48 h before the assay in FreeStyle Expression Medium (Life Technologies, Carlsbad, CA) with no supplements in black, clear-bottom 384-well plates at 10,000 cells/40 µL/well. Following incubation for 48 h in a 37—°C/5% CO2 incubator, 200 nL of compound in neat DMSO was added by acoustic dispensing with an Echo 555, and plates were returned to the incubator for 5 h. Following compound incubation, 8 µL of substrate mix containing the LiveBLAzer-FRET B/G substrate (Life Technologies) was added to each well, and plates were incubated in the dark at room temperature for 2 h. Reporter activity was determined using the EnVision (PerkinElmer) to measure fluorescence in the blue and green channels using 409-nm excitation and 460-nm (blue) and 530-nm (green) emission filters. The average emission from cell-free control wells at both 460 nm and 530 nm was subtracted from the blue and green emission data, respectively, and the blue/green emission ratio for each well was calculated.
Agonist-Stimulated [35S]-GTPγS Binding Assays
The membrane preparation protocol for the GTPγS binding assay was the same as described earlier for the receptor binding assay with a few modifications. The composition of the homogenization buffer was 10 mM Tris (pH 7.5), 5 mM EDTA, and a protease inhibitor tablet. The resuspension buffer comprised 50 mM Tris (pH 7.5), 1 mM EDTA, and a protease inhibitor tablet. Finally, the assay buffer was made up of 20 mM HEPES (pH 7.5), 10 mM MgCl2, 150 mM NaCl, 1 mM EGTA, 1 mM dithiothreitol (DTT), 10 µM GDP, 0.1% BSA, and 10 µg/mL saponin and was filtered through a 0.22-µm filter. The membrane homogenates were resuspended to a final stock protein concentration of 75 µg/mL prior to storage at −80—°C. Then, 40 µL of this membrane suspension was added to each well of a 384-well plate containing test compound, followed by the addition of 40 µL of 0.4 nM [35S]-GTPγS diluted in assay buffer for a final concentration of 0.2 nM. After 45 min of incubation at room temperature, the entire mixture was transferred onto a 384-well filter binding plate, and the filter was washed four times with water before drying plates at 60—°C for 45 min. Plates were sealed on the bottom, and 30 µL scintillation fluid per well was added, followed by sealing on the top. Twelve hours later, the membrane-bound [35S] GTPγS was measured using a scintillation plate reader (Top-Count; Perkin-Elmer).
Results
Establishment of High-Content Assays: Distinct Localization Patterns for β-Arrestin and the S1P1 Receptor
To monitor the β-arrestin translocation response upon agonist stimulation of S1P1 receptor, the U2OS–β-arrestin–GFP cells were transduced using baculoviral stocks containing either the parent plasmid alone or the plasmid with the full coding sequence for the S1P1 receptor. The redistribution of β-arrestin–GFP was monitored using confocal microscopy. Two types of agonist-stimulated responses for β-arrestin translocation have been described in the literature, depending on the affinity of β-arrestin for the GPCR. 10 Agonist activation initially causes the β-arrestin–GFP to localize, with the GPCR, to clathrin-coated pits. If the β-arrestin–GPCR interaction is weak, the two proteins will dissociate, and the β-arrestin–GFP will remain at the clathrin-coated pits, resulting in a sustained punctate pattern of β-arrestin–GFP expression (“class A” receptors). In contrast, if there is a high-affinity interaction between β-arrestin and the GPCR, the two proteins will eventually internalize as a complex into endocytic vesicles, resulting in a perinuclear, endosomal pattern of β-arrestin–GFP expression (“class B” receptors). 10 Images of unstimulated U2OS–β-arrestin–GFP cells with or without overexpression of the S1P1 receptor are shown in Figure 1Ai and iii , respectively. For stimulation, a known synthetic small molecular agonist for the S1P1 receptor was used, herein referred to as “reference compound”; specifically, this compound is 3-azetidinecarboxylic acid 11 (CAS Registry number 635701-59-6). In the absence of stimulus, the β-arrestin2:GFP is homogeneously distributed throughout the cytoplasm. Following stimulation with the reference compound, the β-arrestin:GFP fusion protein is localized to small puncta only in those cells that overexpress the S1P1 receptor ( Fig. 1Aii vs. iv ). This pattern persisted, with no subsequent internalization to endocytic vesicles, suggesting a weak interaction between β-arrestin and S1P1 receptor.
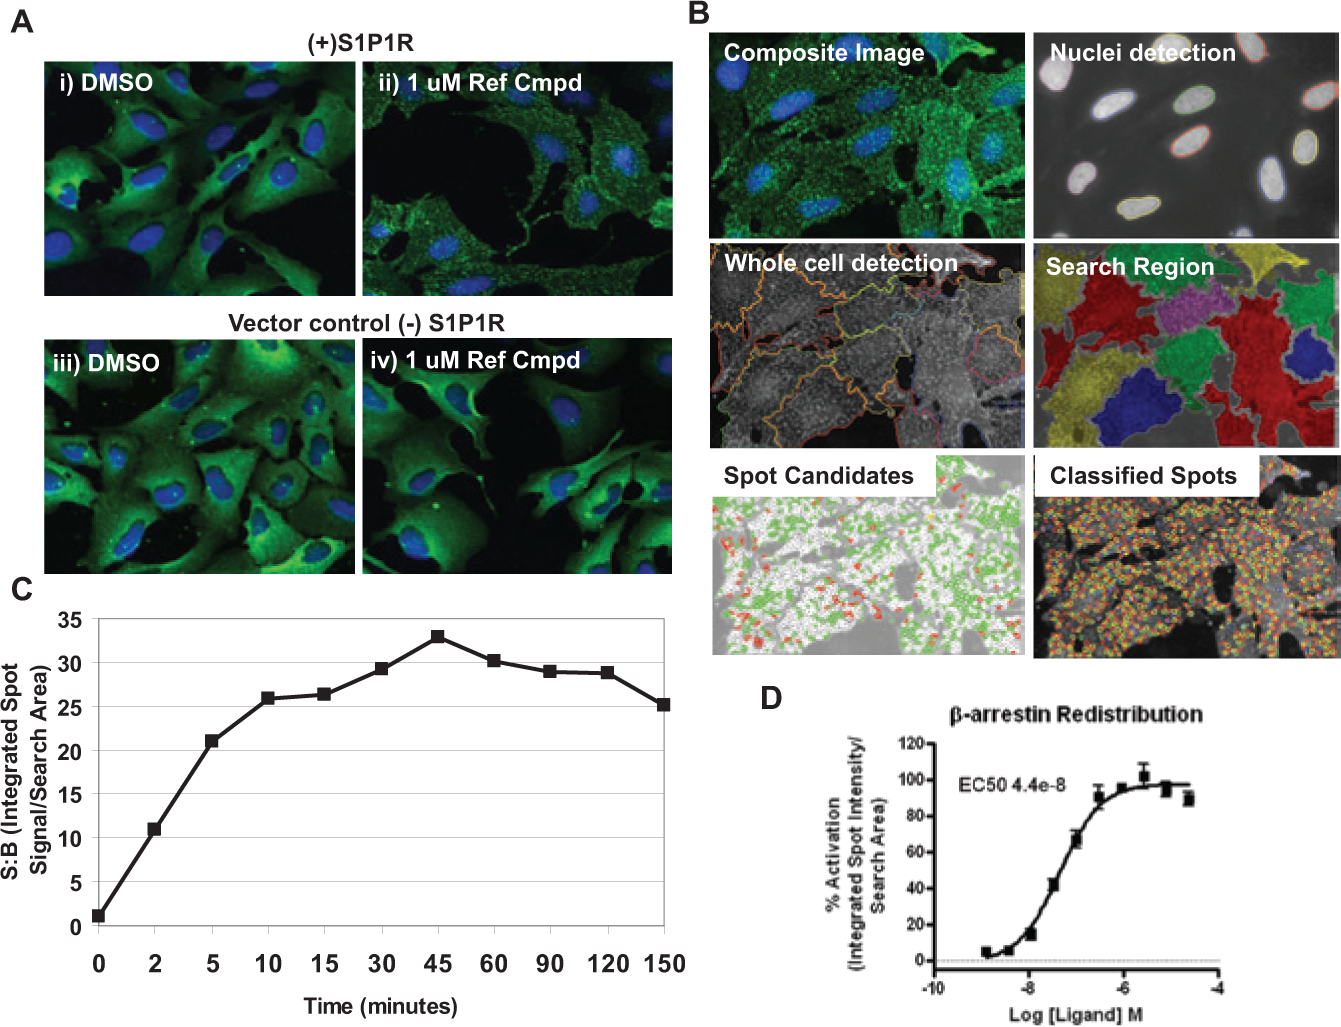
Development of a high-content imaging assay to monitor translocation of β-arrestin upon agonist binding to the sphingosine-1-phosphate (S1P1) receptor. (
To quantify the β-arrestin–GFP redistribution response, cells were imaged using the Opera (PerkinElmer) and analyzed using the Acapella Spot Detection software module (PerkinElmer). For quantification, the whole cell was defined as the search area, and the “integrated spot intensity per search area” was chosen as the most robust feature to monitor the β-arrestin2:GFP redistribution signal ( Fig. 1B ). A time course study to select the optimal time point for monitoring the redistribution response was conducted using the endogenous ligand, sphingosine-1-phosphate (S1P). A redistribution response was observed within approximately 10 min of ligand addition with a maximal response observed at ~45 min. The response persisted for at least 150 min ( Fig. 1C ). Given the kinetics of the observed response, 45 min was chosen as the optimal compound incubation period in all subsequent redistribution experiments. A concentration-response curve for the reference compound was generated using the spot detection algorithm following 45 min of agonist stimulation ( Fig. 1D ).
To fully understand the utility of the high-content β-arrestin redistribution assay relative to other approaches, and to relate changes in β-arrestin distribution to changes in S1P1 receptor distribution, a CHO-K1 cell line overexpressing the S1P1 receptor with a C-terminal GFP tag was developed to monitor translocation of the GPCR itself. The change in S1P1 receptor–GFP distribution elicited by the reference compound is shown in Figure 2Aii relative to the distribution in unstimulated cells ( Fig. 2Ai ). Images shown were captured 45 min after ligand addition. Unlike the β-arrestin–GFP, which exhibited a punctate pattern across the cell upon agonist treatment ( Fig. 1Aii ), the GFP-tagged S1P1 receptor was specifically localized to the perinuclear region ( Fig. 2Aii ), consistent with an endosomal localization. This perinuclear pattern is most pronounced around 45 min following agonist addition (similar to the β-arrestin response) but is clearly visible within the first 15 min (data not shown).
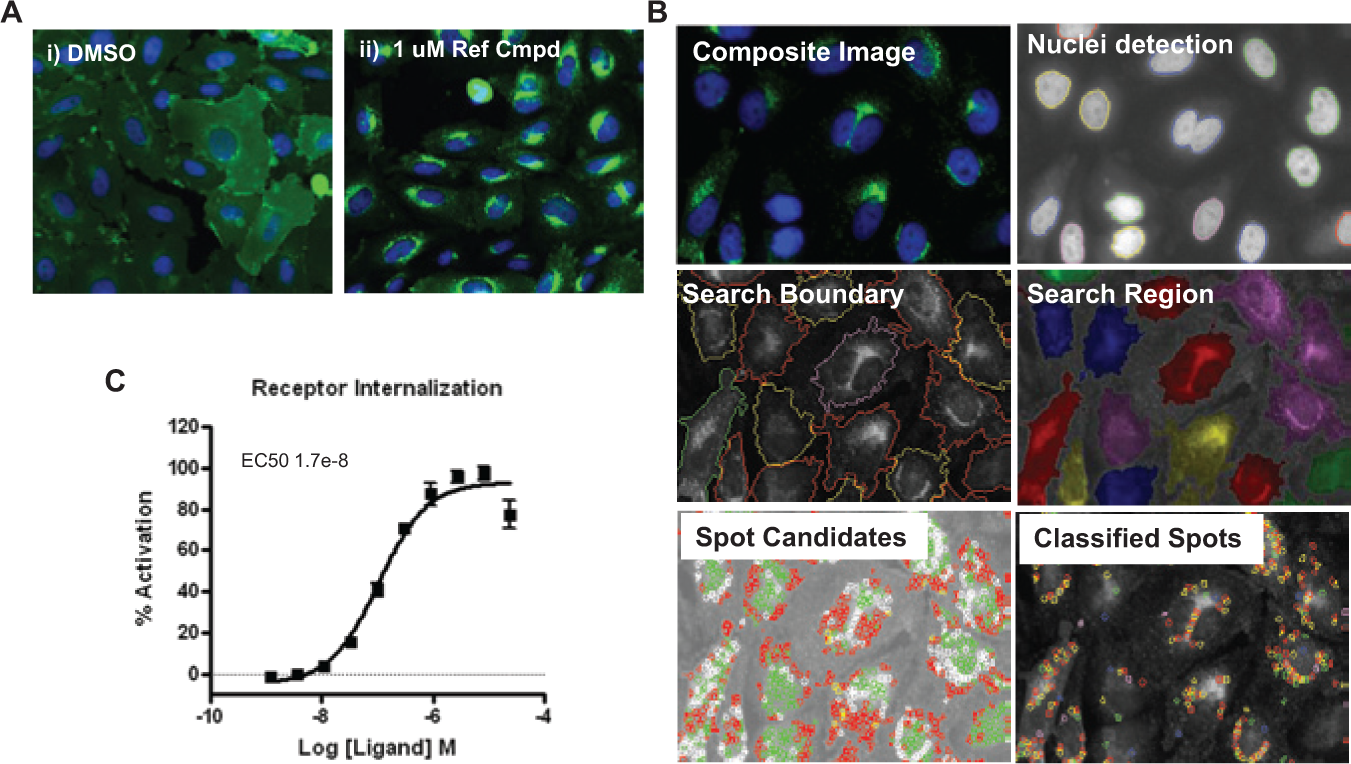
Development of a high-content imaging assay to monitor internalization of the sphingosine-1-phosphate (S1P) receptor 1. (
As outlined earlier, two patterns of β-arrestin translocation have been described, and accordingly, GPCRs have often been categorized into two categories: class A and class B. The S1P1 receptor exhibits a profile typical of a class A receptor given that stimulation with the reference compound results in localization of β-arrestin–GFP to clathrin-coated pits, where it remains for a prolonged period ( Fig. 1 ). In contrast, within 15 min of ligand addition, the GFP-tagged S1P1 receptor is localized to endosomal vesicles surrounding the nucleus. These distinct patterns of spatial expression imply that the β-arrestin–GPCR complex that initially forms to facilitate receptor internalization is not stable, and the two proteins dissociate soon after agonist treatment to reside in separate cellular compartments, as seen in images taken at 45 min ( Figs. 1 and 2 ).
An algorithm to quantify “integrated spot intensity,” which is similar to that used for β-arrestin distribution, was used to monitor receptor internalization, but the quantification was restricted to a defined region surrounding the nucleus ( Fig. 2B ). Using this algorithm with the appropriate CHO-K1-S1P1-GFP cells, a concentration-response curve for the reference compound was obtained ( Fig. 2C ).
A Parallel Screening Approach: High-Content Monitoring of β-Arrestin Redistribution vs the Aequorin Platform
To examine the utility of the high-content β-arrestin assay relative to more traditional platforms for GPCR hit identification, we screened a diverse library of 32,026 small-molecule compounds for agonist activity using the high-content platform for β-arrestin redistribution, as well as the aequorin method. Agonist activation of the S1P1 receptor increases intracellular free calcium in some cell systems through Gi-dependent activation of PLCβ. 12 Conducting a Ca2+-based assay alongside the β-arrestin assay allowed us to evaluate the potential for this parallel approach to identify G protein–biased and/or β-arrestin–biased compounds. The high-content β-arrestin translocation assay was consistent with an average fold-change of 26 between DMSO-treated cells and cells treated with the reference compound at a concentration eliciting a maximal response. The mean for all compounds tested was 3.8% of control, and the mean plus 3 standard deviations was 8.4% of control (in this context, control refers to the activity of an EC80 concentration of the reference compound in this same assay). The assay exhibited minimal plate-to-plate variability and z-prime values were consistently greater than 0.5. In total, 76 “confirmed positive” compounds from the high-content β-arrestin assay were identified by rescreening all compounds that elicited responses greater than 8% of the DMSO with a 10-point concentration series and by viewing the images individually to confirm the redistribution of β-arrestin. None of these hits caused β-arrestin translocation in cells overexpressing an unrelated GPCR, suggesting their specificity for the S1P1 receptor, and all of these showed activity in the Tango assay. With the exception of one of those compounds, all hits from the high-content assay were also active in the aequorin assay. The hit rate of compounds active in the β-arrestin assay was low (0.24%) relative to the aequorin method, which identified 448 compounds (a 1.4% hit rate). The active compounds from the aequorin assay met each of three criteria: (1) they exhibited greater than 50% activation compared with the reference compound, (2) they exhibited less than 30% activation in an aequorin assay using a cell line expressing a different GPCR (implying specificity for the S1P1 receptor), and (3) they were active in a follow-up assay using a 10-point concentration series of compound. Unlike the β-arrestin assay hits, which had a 100% confirmation rate in the Tango assay, however, only 367 (~82%) of the aequorin hits were active in a second assay format (GTPγS binding).
In reviewing the concentration-response data from the aequorin and β-arrestin screens, some noteworthy observations were made. First, and most obvious, was the much higher hit rate in the aequorin assay versus the β-arrestin assay. This implies that the β-arrestin assay sensitivity is too low to identify weaker compounds but could also reflect compounds with bias for G protein signaling over β-arrestin recruitment. Second, of those compounds that were active in both assay formats, their potency in the β-arrestin assay was always lower compared with that in the aequorin assay. Interestingly, however, there were inconsistent potency shifts between the two assays, with some compounds exhibiting 100-fold greater potency in the aequorin assay while others showed only a modest 2-fold shift. Third, one compound identified in the β-arrestin screen was completely inactive in the aequorin assay. Given that one objective of this study was to explore the ability to identify biased agonists, we used multiple assay formats to further explore compounds showing bias across the two platforms.
The Use of Multiple Assays Reveal Biased Agonism at the S1P1 Receptor
To further study compounds showing potential bias, a panel of additional assays was used; these include a competition radioligand binding assay, a GTPγS binding assay, and a cAMP accumulation assay. We also evaluated the Tango platform as an alternative β-arrestin redistribution assay. 13 Concentration-response curves generated with the reference compound are shown for each of these assays in Figure 3 . This compound (structure shown in Fig. 3A ) shows clear activity across all of these assays ( Fig. 3B ), indicating that it is a nonbiased agonist. In contrast, Figure 4 highlights a compound (compound B; Fig. 4A ) found to exhibit receptor binding and to have activity in the aequorin and GTPγS binding assays but no observable activity in either the high-content or Tango formats monitoring β-arrestin or the S1P1 receptor internalization assay ( Fig. 4B ). These data suggest that this compound B is a G protein–biased agonist; however, given the lower sensitivity described for the β-arrestin platform and the relatively low potency for this compound in the aequorin assay, these data do not conclusively support the notion of compound B being a complete G protein–biased compound. The lack of activity in the β-arrestin and internalization assays strongly suggests that this compound exhibits some bias, but the possibility that these assays are not sufficiently sensitive to reveal β-arrestin–mediated activity cannot be dismissed.
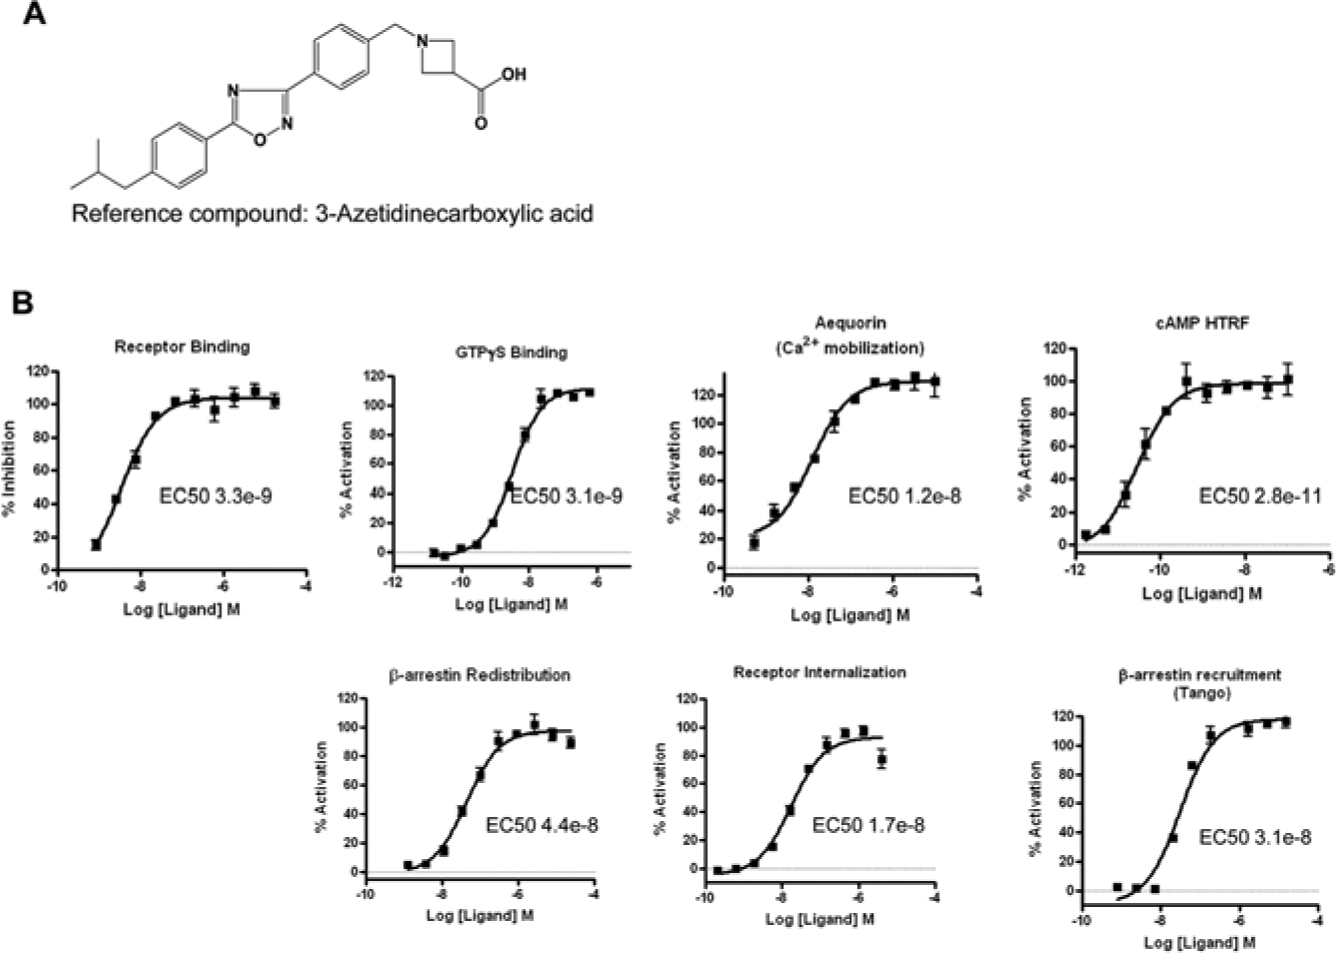
Establishment of multiple assay formats to evaluate compound pharmacology. Multiple assays were applied to further study compounds of interest. The structure of the reference compound is shown in
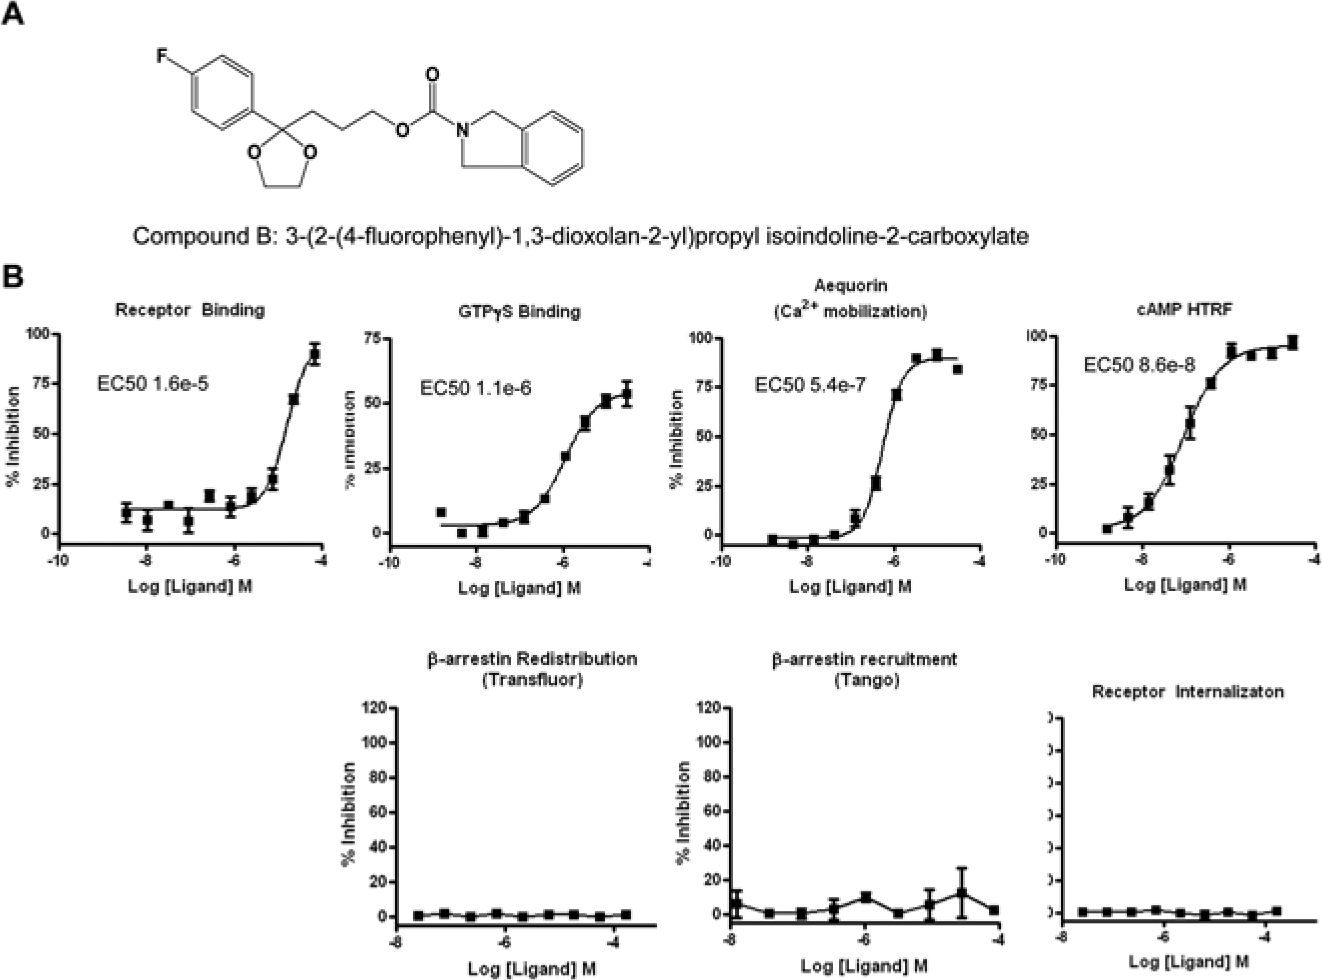
Identification of a potential G protein–biased agonist (compound B). An agonist (structure in
Figure 5 shows concentration-response curves generated using the compound, which was identified initially using the high-content β-arrestin assay but was inactive in the aequorin assay (compound C). Compound C was also active in the Tango assay, the receptor binding assay, and the receptor interalization assay ( Fig. 5 ). Importantly, compound C did not induce redistribution of β-arrestin in cells that overexpress a different, unrelated GPCR, implying that this response is specific to the activation of the S1P1 receptor. Compound C, however, showed no activity in any of the G protein–based platforms (aequorin, GTPγS binding, and cAMP accumulation), suggesting that this compound is a complete β-arrestin–biased agonist.
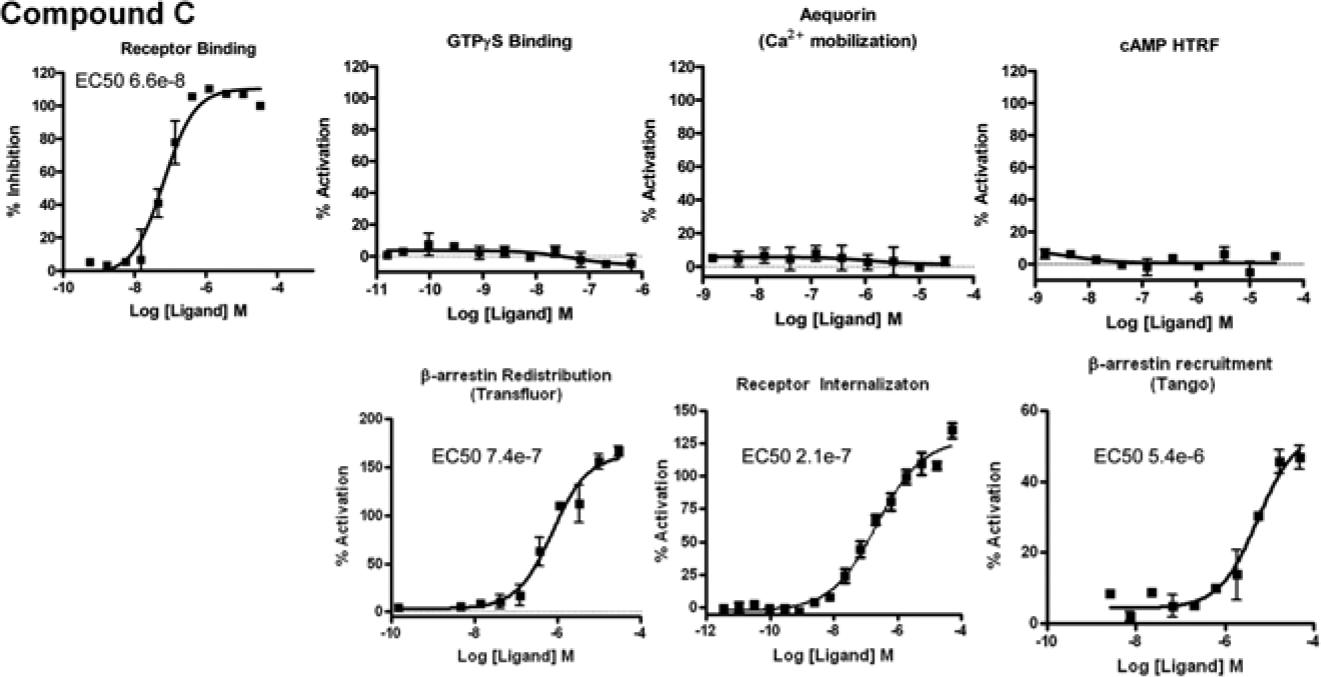
Identification of a complete β-arrestin–biased agonist (compound C). A compound identified as a hit in the Transfluor screen is shown to effectively displace ligand binding at the sphingosine-1-phosphate (S1P) receptor 1 but has no detectable activity in the aequorin, GTPγS, and cAMP assays. In contrast, activity of this compound in the β-arrestin assay was confirmed (albeit weak) in both the high-content assay and the Tango format, and this compound was shown to cause receptor internalization.
An Atypical Pattern of β-Arrestin Distribution
In addition to exhibiting pharmacology consistent with being a completely β-arrestin–biased agonist, compound C elicited an unusual pattern of β-arrestin distribution ( Fig. 6 ). Specifically, S1P and the reference compound caused translocation of β-arrestin–GFP to small puncta (clathrin-coated pits) producing the fine spot distribution as shown in Figure 1A and Figure 6Aii,v . The pattern of β-arrestin–GFP fluorescence in response to compound C, however, was strikingly distinct, in that the fluorescence was localized to a region surrounding the nucleus ( Fig. 6Aiii and 6Avi ), closely resembling the pattern normally seen for the internalized receptor ( Figs. 6Aviii and 2Aii ). The distribution of GFP-tagged receptor, caused by compound C, is shown in Figure 6Aix and is very similar to the β-arrestin distribution pattern in Figure 6Aiii and 6Avi . These results suggest that unlike the normal segregation that takes place, with β-arrestin localizing to pits and the receptor localized to the endosomes, compound C evokes a response whereby both β-arrestin and the GPCR appear to co-localize, potentially as a complex, to the endosomal compartment. Given that the internalization assay and the β-arrestin translocation assay use distinct cell lines, it was not possible to confirm co-localization of β-arrestin and the S1P1 receptor; however, their similar spatial patterns within the cell suggest that compound C confers class B–like properties upon the S1P1 receptor that typically displays a pattern consistent with a class A receptor. Compound C was added to U2OS and CHO-K1 parental cells (e.g., with no overexpression of the receptor) to confirm that the endosomal distribution of GFP is reflective of the β-arrestin–GFP or S1P1 receptor–GFP molecules and not simply an internalization of a fluorescent compound (data not shown).
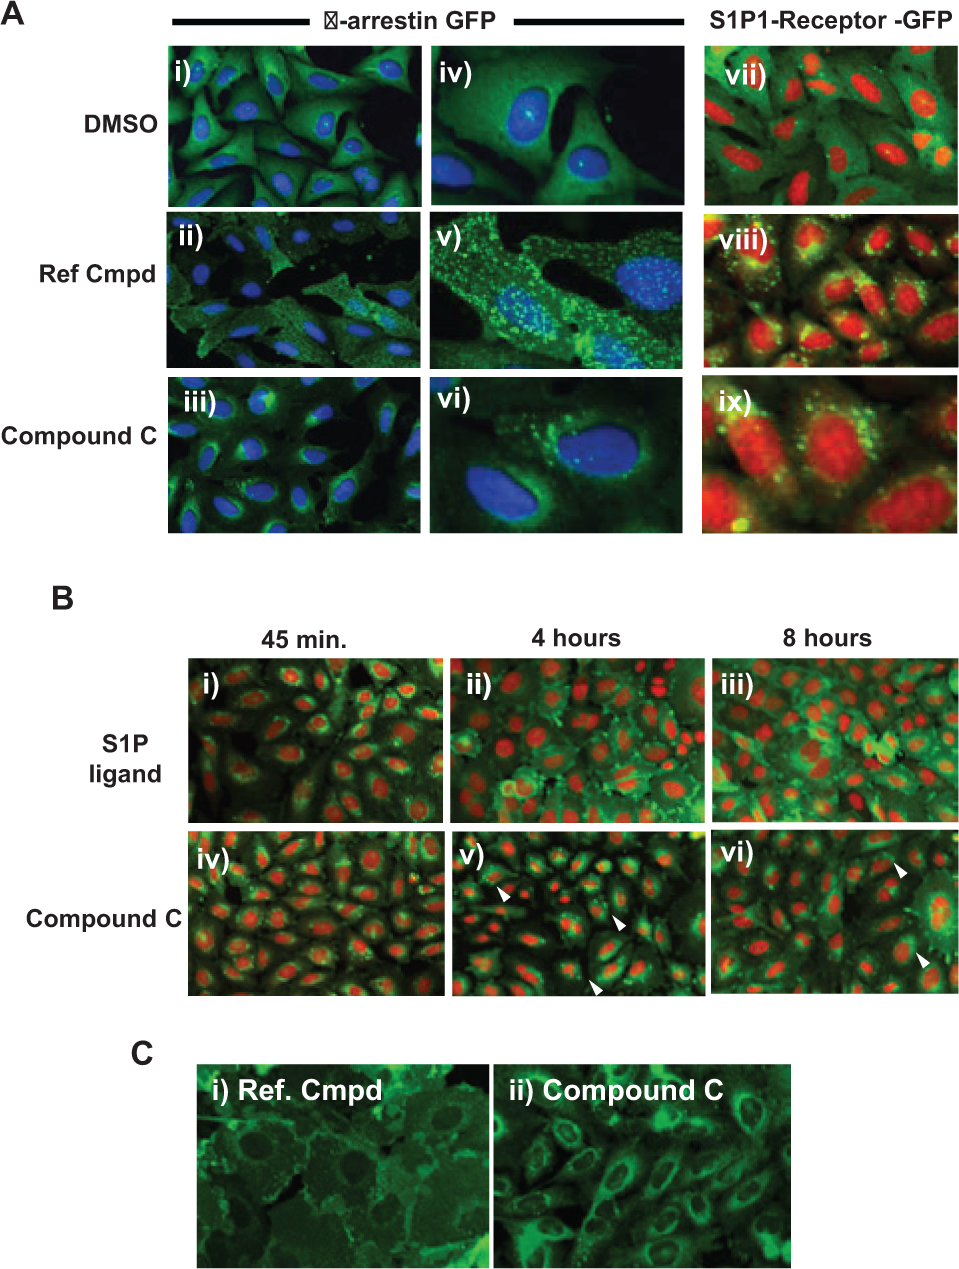
Compound C induces an atypical pattern of β-arrestin distribution and alters receptor trafficking properties. (
Identified Agonist Alters S1P1 Receptor Trafficking Kinetics
Divergent endocytic trafficking routes can affect the fate of the GPCR, either by altering the kinetics of the GPCR recycling back to the membrane or by causing the degradation of GPCRs that have been brought to the lysosome. Given the dramatic effects of compound C on β-arrestin distribution, we hypothesized that this compound may alter S1P1 receptor trafficking. We therefore applied a high-content assay that monitors the recycling of the GPCR back to the membrane following agonist-induced internalization. 9 Briefly, this assay involves inducing a maximal GPCR internalization response with agonist treatment, then applying a series of washes to remove the compound, followed by additional incubations at 37—°C for up to 8 h to examine the degree of receptor recycling back to the cell membrane.
Figure 6Bi shows internalization of the S1P1 receptor following 45 min of incubation with the S1P ligand. This pattern of receptor internalization is similar to that induced by compound C ( Fig. 6Biv ). Following washing and a 4-h incubation, however, most S1P-treated cells have GFP localized back at the cell membrane ( Fig. 6Bii ), while in cells treated with compound C, the pattern of GFP fluorescence remains predominantly within the cytoplasm in the perinuclear region ( Fig. 6Bv ). The lack of membrane localization of receptor persists even up to 8 h in response to compound C ( Fig. 6Bvi ), while by contrast, the majority of GFP staining in the S1P-treated cells is at the cell membrane at this stage ( Fig. 6Biii ). These data indicate that compound C is effective at inducing a prolonged state of internalized receptor. Of interest, maximal receptor internalization was achieved within the first 5 min of adding the test compound ( Fig. 6Cii ), in contrast to the 45 min it took for both S1P and the reference compound to reach a peak in the internalization response, revealing distinct changes in the kinetics of internalization of the S1P1 receptor in addition to changes in recycling kinetics.
Discussion
Until recently, drug discovery efforts for GPCR targets have focused primarily on receptor blockade and G protein–mediated responses. However, GPCR pharmacology clearly extends well beyond receptor binding and G protein activation to include a number of processes that influence GPCR activation and downstream signaling. Here we show that compounds that elicit similar pharmacology in one GPCR assay format can exhibit very distinct profiles from one another when evaluated across a panel of assays. Our data highlight the importance of employing a multiassay approach to fully characterize compounds that alter GPCR activity.
To date, multiple studies have demonstrated that ligands showing bias for either G protein– or β-arrestin–mediated signaling can induce distinct cellular consequences compared with nonbiased ligands. Importantly, in vivo data support the strategy of discovering and developing biased agonists to selectively target a specific function. One of the most notable examples for this is the demonstration by Violin et al. 14 that TRV120027, a potent and selective β-arrestin–biased ligand of the angiotensin II type I receptor (AT1aR), not only reduced blood pressure similar to unbiased ligands but increased cardiac performance and preserved cardiac stroke volume unlike unbiased ligands, which decreased cardiac performance.
With the concept of biased agonism coming to the forefront, it is becoming increasingly important to develop hit identification strategies that can differentiate biased from nonbiased agonists. Here, using a parallel screening approach, we demonstrated the ability to identify both G protein– and β-arrestin–biased agonists. Specifically, we used the aequorin assay format to monitor changes in intracellular calcium and a high-content assay to follow the redistribution of GFP-tagged β-arrestin. While this parallel approach was successful in uncovering biased agonists, the relatively low hit rate in the β-arrestin assay was surprising, indicating that as a primary assay on its own, the sensitivity of this format might be too low to identify weak compounds. Whether the use of distinct cell types for these two assays contributes to this potency shift or if differential receptor expression is a factor is not known, but going forward, matching the cell background and receptor expression levels is ideal for a parallel screening effort or, where possible, multiplexing a G protein and β-arrestin readouts within the same cell is optimal. Despite the overall lower sensitivity of the β-arrestin redistribution assay, the inconsistent potency shifts between the two assay formats was of interest. Some compounds exhibited a potency shift of greater than 100-fold between the aequorin and β-arrestin assays, while there was only a 2-fold shift in assay potencies for other compounds. Whether those compounds with a larger fold-shift represent incompletely biased compounds was not examined but is an interesting possibility. Despite the assay differences, screening a diverse library of compounds with both platforms, then following up on compounds of highest interest with a panel of different assay formats, proved to be a useful strategy for uncovering biased agonists.
Receptor Internalization and Trafficking
In addition to highlighting the value of a multiplexed screening approach to characterize GPCR agonists, we demonstrate the utility of high-content analysis for monitoring receptor internalization and recycling. Specifically, we demonstrated the ability of a high-content assay to identify an agonist (compound C) that alters the pattern of β-arrestin redistribution that is normally observed upon activation of the S1P1 receptor. Based on the observed perinuclear pattern of β-arrestin–GFP, which mirrors that of the GFP-tagged S1P1 receptor in response to agonist treatment, we hypothesize that compound C is an agonist that induces a high-affinity interaction between β-arrestin and the S1P1 receptor, which leads to their co-localization in the endosomes. Confirming this hypothesis would require that both molecules are monitored within the same cell. While we attempted this using our established cell lines, we were unable to multiplex the β-arrestin and S1P1 receptor readouts given a lack of appropriate antibodies for immunofluorescent detection of either β-arrestin or the S1P1 receptor.
The ability to identify compounds that modify GPCR internalization and/or recycling has major implications for GPCR drug discovery efforts, as it provides an opportunity to develop small-molecule agonists that exhibit precise endocytic and recycling profiles. Compounds can induce diverse patterns of GPCR trafficking between intracellular membrane compartments, and these patterns alter GPCR responsiveness. For instance, an agonist may lose potency if it induces degradation of the GPCR, whereas desensitization may be minimized by a compound that induces fast recycling of the receptor or that does not induce endocytosis. While the endocytic patterns control GPCR availability at the cell membrane, these patterns are equally important in regulating β-arrestin–induced signaling, as prolonged internalized receptor–β-arrestin complexes can lead to prolonged activation of pathways that are mediated by β-arrestin.
A clear demonstration whereby drug efficacy is linked to receptor internalization is outlined by Pradhan et al., 15 who studied the pain-relieving effects of two delta opioid receptor (DOR) agonists that exhibit similar signaling potencies and efficacies but induce vastly different internalization properties of the receptor. While initial treatment of mice with the agonists caused an equivalent reduction in inflammatory pain, the response to subsequent dosing differed among the two agonists. The “high-internalizing” compound that elicits endocytosis and lysosomal targeting of the DOR failed to induce an analgesic response upon second dosing, whereas the “low-internalizing” compound, which fails to cause DOR endocytosis, retained its analgesic effects upon subsequent dosing. 15 These studies unambiguously demonstrate the link between receptor trafficking and agonist efficacy, and they highlight the ability to pharmacologically modulate receptor occupancy at the cell membrane and in turn alter the cellular effects of GPCR agonism. In addition to the DOR, multiple other GPCR responses have been associated with the β-arrestin–receptor complex affinities and the receptor trafficking patterns for many other GPCRs (reviewed in Whalen et al. 6 ). Modifying these features pharmacologically is clearly an opportunity in future GPCR drug discovery efforts, and leveraging this opportunity will require further in vivo studies, like the DOR study by Pradhan and colleagues. 15
Unfortunately, the physiological relevance of receptor trafficking kinetics is poorly understood for a majority of GPCRs. To fully capitalize on the promise of biased agonism and on the ability to pharmacologically alter receptor trafficking, it will be necessary to more thoroughly relate these features to efficacy and to undesirable target-mediated side effects. To date, very few drug discovery programs are initiated with this information in hand. One of the key hurdles for this is a lack of tool compounds to tease apart the relative contributions of distinct pathways to physiological end points. In the absence of these tool compounds, however, researchers have effectively used alternative approaches to dissect the roles of G protein– and β-arrestin–mediated pathways in mediating cellular physiology. For instance, RNA interference techniques and knockout animals have been successfully applied to understand various GPCR-mediated events, and many studies report the use of chemicals to block G protein signaling, such as pertussis toxin, which disrupts Gi signaling, and inhibitors of protein kinase C (PKC), to block Gq-mediated pathways.13,16–19 These approaches can provide valuable insights into the physiological relevance of biased signaling, particularly in the absence of ideal tool compounds, and these insights are important in defining a suitable strategy for GPCR drug discovery programs.
The results presented here demonstrate that once a clear understanding of the desired pharmacological fingerprint for a given GPCR has been established, a multiassay approach provides a powerful means to identify, characterize, and optimize GPCR-targeted compounds. Our findings also underscore the advantages of using high-content imaging to uncover compound-induced changes to typical cellular physiology. Combining a multiassay platform, high-content imaging assays, and more up-front studies to understand the mechanistic basis for efficacy will greatly improve efforts to design safer and more efficacious therapeutics.
Footnotes
Acknowledgements
We acknowledge the cell culture support of Lauren Barber, Victoria Yatsula, and George Hansen. We also thank Jennifer Zewinski, Lisa Simoni, Jessica Devito, and Jessica Dodge for support with the automated systems.
Declaration of Conflicting Interests
The authors declared no potential conflicts of interest with respect to the research, authorship, and/or publication of this article.
Funding
The authors received no financial support for the research, authorship, and/or publication of this article.