
Abstract
Target-based high-throughput screening (HTS) has recently been critiqued for its relatively poor yield compared to phenotypic screening approaches. One type of phenotypic screening, image-based high-content screening (HCS), has been seen as particularly promising.
In this article, we assess whether HCS is as high content as it can be. We analyze HCS publications and find that although the number of HCS experiments published each year continues to grow steadily, the information content lags behind. We find that a majority of high-content screens published so far (60−80%) made use of only one or two image-based features measured from each sample and disregarded the distribution of those features among each cell population. We discuss several potential explanations, focusing on the hypothesis that data analysis traditions are to blame. This includes practical problems related to managing large and multidimensional HCS data sets as well as the adoption of assay quality statistics from HTS to HCS. Both may have led to the simplification or systematic rejection of assays carrying complex and valuable phenotypic information.
We predict that advanced data analysis methods that enable full multiparametric data to be harvested for entire cell populations will enable HCS to finally reach its potential.
Keywords
Introduction
There is growing concern that biochemical or cell-based high-throughput screening (HTS) assays with only a single, simplistic, population-averaged readout may yield hits that are relatively poor quality (e.g., in terms of clinical efficacy and toxicity for chemical hits, and in terms of physiological relevance for genetic perturbations), as compared to phenotypic assays. 1 In particular, high-content screening (HCS) by imaging cell populations has been predicted to offer tremendous promise. HCS enables measuring complex phenotypic outcomes that are more closely linked to disease states while also providing preliminary, cell-level assessment of certain aspects of ADMET during a primary screen. Moreover, profiling methods—measurement of multiple parameters integrated at the level of single cells—can facilitate more complex tasks such as target prediction of a drug candidate2,3 or precise identification of proteins involved in biological processes. 4
Despite this promise, HCS is generally not used as the dominant primary screening modality in industry or academia. There may be many reasons for this, including long assay development times, low throughput of microscopy hardware, and the requirement of specialized expertise to carry out HCS, although improvements have been made in these areas in the past decade. In this article, we focus on the information content of HCS experiments; we find that although the number of HCS experiments published each year continues to grow steadily, the information content lags behind. We discuss possible explanations for this, focusing on the hypothesis that data analysis customs are to blame.
The Rate of Discoveries Made Using HCS Is Increasing
We first wanted to observe the trend in discoveries made using HCS throughout time (here, HCS refers only to microscopy-based experiments). We used publication records as our source, which constrains our findings primarily to academia. Recognizing that it is not feasible to exhaustively identify all papers that used HCS to obtain biological results, we sought representative samplings in three ways (see the “Notes” section for details). In the first approach (termed HCS-title here), we searched PubMed for “high-content screening” (including quotes) in the title. The term HCS is by no means used universally to describe high-throughput, image-based experiments, and requiring it in the title is likely biased toward papers on the more simplistic end of the spectrum. Therefore, our second approach (termed Top-tier here) searched PubMed with a much broader combination of words and then constrained the size of this set by limiting it to papers published in Science, Nature, Cell, and the Proceedings of the National Academy of Sciences (see “Notes” for details). Our third approach (termed CellProfiler citers here) was based on a set of papers curated by hand that cite our group’s open-source software for high-throughput image analysis. We expected this group to be somewhat biased toward laboratories willing to use high-end informatics tools in their work. For all three approaches, we excluded book chapters, reviews, and comments, as well as papers in which presenting a method was the main focus (e.g., development of an assay) as opposed to presenting a biological discovery. We find that the number of papers meeting these criteria that are published each year is increasing steadily ( Fig. 1 ).
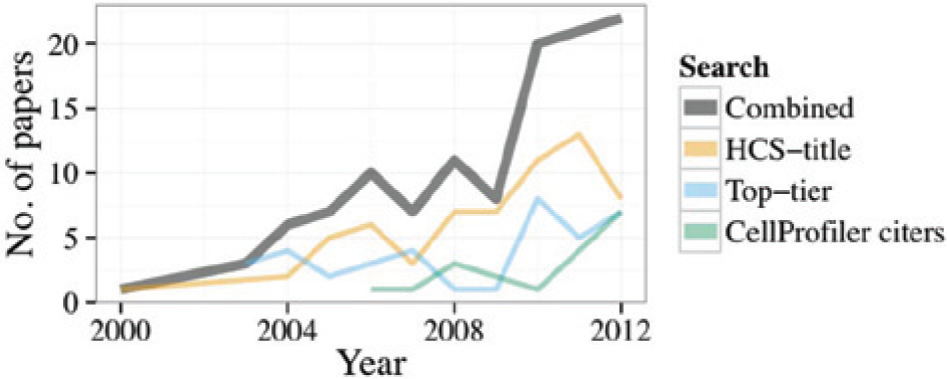
The number of papers in which a high-throughput, image-based experiment was used toward a discovery, by year of publication. Combined indicates the sum of all three searches. Note that the Combined trend line should not be considered as a total, because the literature searches are not at all comprehensive.
The Information Content of the Typical HCS Experiment Is Much Lower than Its Potential
In the resulting 118 papers33–150 based on the search above, we then read the relevant portions to identify the main readout(s) of each high-throughput image-based experiment. Given the power of HCS to provide multiparametric readouts, we were surprised to find that roughly 60–80% of the papers used only one or two measured features of the cells ( Fig. 2 ). Although measuring a single feature was by far the most common, those papers measuring two features typically used the main phenotype under study and cell count as a measure of toxicity. As we suspected, the HCS-title search yielded the highest percentage (83%) of low-content papers (1–2 features), whereas the CellProfiler citers search yielded the highest percentage (29%) of high-content papers (6+ features). Examining the results of all three searches together throughout time, we find the percentage of papers using only 1–2 features has stayed relatively steady during the past decade ( Fig. 3 ).
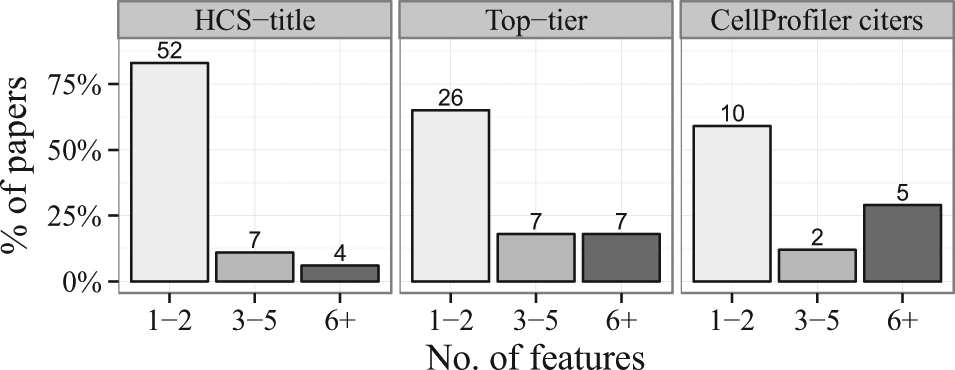
Feature set sizes used in papers throughout the three searches. Numbers at the top of each bar indicate the actual number of papers. Between 60% and 80% of the papers used only one or two measured features of the cells.
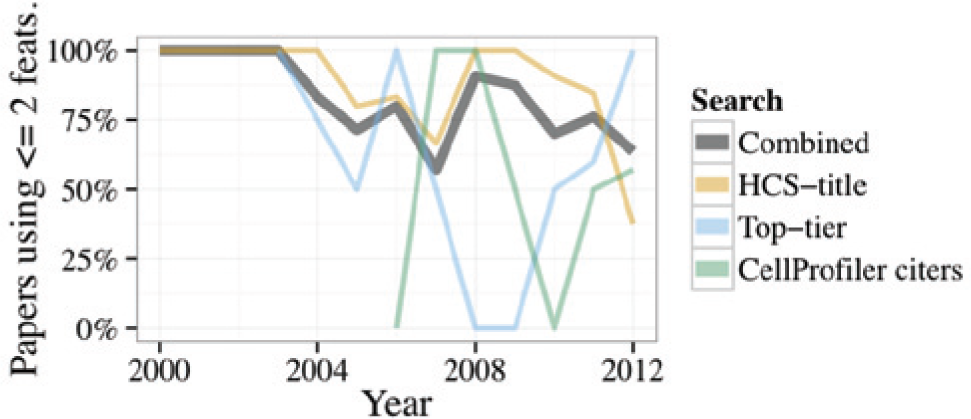
Percentage of papers that use only one or two measured features of the cells, by year of publication.
Certainly measurement of one or two features by microscopy can yield a valuable phenotypic readout, and clearly a complex experiment need not be performed when a simple one will do. Furthermore, researchers may have surveyed several potential features prior to selection, but in the end, only 1–2 features may have been used for the experiment and published in the report. We nonetheless conclude that there is a strong tendency for HCS assays to typically be, in truth, quite low content in terms of the number of different parameters used. Given the additional complexity and time involved in HCS and that the typical outcome is relatively low content, it is perhaps unsurprising that the use of HCS is not increasing more rapidly. In the remainder of this article, we discuss some challenges that have likely driven at least part of this trend toward low-content HCS.
Insufficient Computational Infrastructure for Multidimensional, Single-Cell Data
The field of HTS has made tremendous progress in data handling, resulting in streamlined systems for handling the large amount of data produced in typical HTS screens as long as a small number of values are produced per replicate sample. Although image files are larger in size, a similar trend is true for HCS, because systems dedicated to handling these files have become relatively reliable. In typical HCS, however, hundreds of features can be extracted for thousands of cells in each replicate sample. Storing and manipulating these data matrices requires significant refactoring and expansion of data management systems, and analyzing the large amounts of data from HCS requires alternate multidimensional methods and, often, significant computing power. These challenges have usually been avoided rather than addressed; HCS results are typically collapsed to a single value per replicate sample to avoid having to modify existing HTS data storage and handling systems to cope with the large amount and high dimensionality of HCS.
Workflow Hurdles
Further pressure to reduce rich HCS data has come at other stages of the workflow. For example, hits from a screen are often iteratively improved by chemists once the screen is complete in a process called lead optimization, particularly in a drug-discovery environment. There is no commonly adopted method to handle multiple readouts at this stage; generally, a single readout is preferred to easily fit dose–response curves and discern structure–activity relationships.
Even when lead optimization is not an issue, pressure has come from assay quality requirements that may not be appropriate for truly high-content experiments. Screening centers, in both pharmaceutical and academic settings, typically require that any high-throughput assay meet a minimum value of the Z′-factor
5
(see
Interestingly, the screening community has adopted the Z′-factor as a quality control statistic for HCS as well. Of the 118 papers identified above, 40% used the Z′-factor (
Fig. 4
); the majority of these came from the HCS-title group (
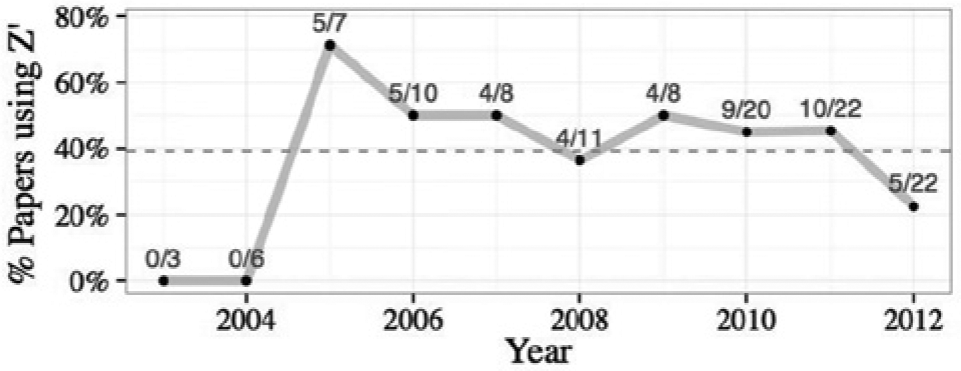
The percentage of papers throughout all three searches that use the Z′-factor, plotted by year of publication. The fractions indicate the number of papers that use the Z′-factor divided by the total number of papers in each year. Overall, 40% use the Z′-factor (dotted line).
There are several problems with using the Z′-factor in HCS ( Fig. 5 ). First, the statistic requires that the readout be univariate, so typically only a single cellular feature is retained. Second, although multivariate extensions to the Z′-factor have been proposed,6,7 they still require that the per-cell readouts be summarized into a single value per replicate sample. By doing so, the rich information captured from single-cell measurements is effectively discarded. Together, these two transformations coerce a matrix of readouts into a single value per sample, thereby losing many of the benefits of HCS.
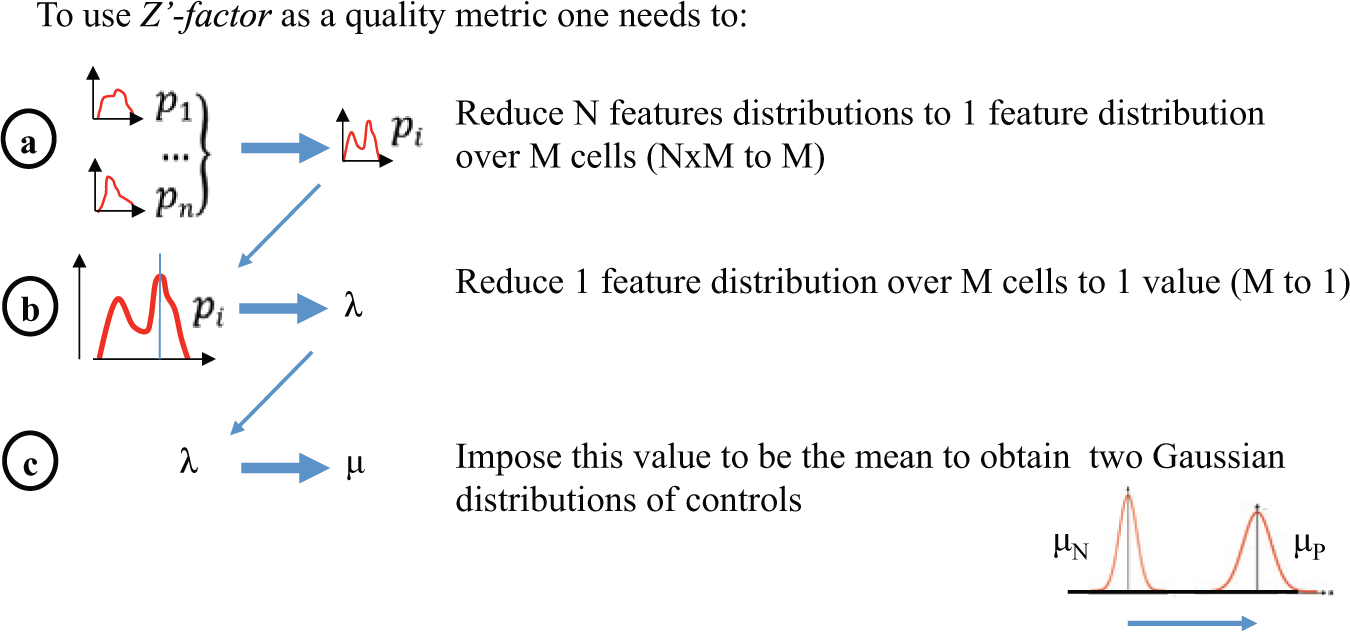
The necessary steps required to use the Z′-factor as a quality metric drastically simplify assay readout and analysis but typically also reduce the power and value of an HCS assay. (
Third, it is usually the mean that is used to summarize per-cell readouts into a single value. This generally results in the transformed data having a Gaussian distribution, meeting the assumptions of the Z′-factor, but it obscures changes that are present only within certain subpopulations of cells. When the per-cell readouts are summarized in other ways (e.g., counting the percentage of cells with a particular phenotype), the summaries may be distributed in a non-Gaussian 8 way, and this generally leads to lower Z′-factors.
The Z′-factor is therefore often not ideal for HCS because there is a mismatch between the purpose of the metric (distinguishing a positive control from a negative control based on a single population-averaged readout that follows a normal distribution) and more sophisticated usage of HCS (see the “Hope for the Future” section). Although advanced data techniques could certainly be used after the Z′-factor hurdle has been crossed, it is possible for an assay to fail to meet a Z′-factor threshold for a single averaged assay readout and nonetheless be of suitable quality for more advanced methods that are based on dozens or hundreds of features on a single-cell level. Conversely, it is possible for an assay to pass the Z′-factor >0.5 threshold for a single population-merged assay readout and nonetheless be poorly suited to further multivariate analyses.
Together, these issues inadvertently nudge scientists toward HCS assays that show a significant shift in the mean of the population and thus yield an acceptable Z′-factor value. In the process, we suspect that complex assays, in which one or more biological processes of interest manifest as changes in the distributions of cellular subpopulations, are often abandoned.
Hope for the Future: Multiparametric Methods for HCS
Overall, we suspect that there has been a trend to choose simpler HCS assays to pass through the bottleneck of existing data infrastructures and approval processes at screening centers and that this has likely had dramatic and largely silent consequences on scientific discovery.
Still, there is hope on the horizon because some pioneering work in this area has begun to carve out use cases for HCS that are more complex and valuable. Laboratories have been working to establish high-dimensional data analysis methods suited specifically to HCS assays and to address the data-handling and infrastructure challenges we have described above. In addition, in practice, HCS assays have also required closer attention to consistency because normalization can be more challenging among samples and experimental batches when working in high-dimensional spaces.
In the remainder of this section, we focus on reviewing the computational methods that have been used in successful instances of multidimensional data analysis for HCS.
Scoring Cellular Phenotypes Using Multidimensional Classification
Machine learning methods to score phenotypes at the individual cell level have been effective in a number of discovery-oriented high-content screens.9–16 Several tools have been created to recognize and sort complex cell phenotypes automatically at high throughput using their high-dimensional image-based cytological profiles and a hand-trained classifier. These include CellProfiler Analyst, 17 CellClassifier, 18 Enhanced CellClassifier, 19 and Advanced CellClassifier. 20 They all enable researchers to choose example cells that represent the phenotype of interest and train machine learning algorithms to distinguish them. They differ from each other in the particularities of their user interfaces and the machine learning algorithms used. CellProfiler Analyst uses GentleBoosting, 21 a method that combines many relatively weak and inaccurate yet simple rules to create a classifier with a significantly higher accuracy. CellClassifier uses support vector machines (SVMs), neural networks, or k-nearest neighbors for classification. Enhanced CellClassifier is a similar framework that also uses SVMs for classification. Advanced CellClassifier interfaces with Weka, 22 which provides a suite of classification algorithms. Finally, CellCognition 23 enables the analysis of time-lapse images to monitor the progression of cells through different functional states using hidden Markov modeling.
Multidimensional Profiling of Samples
More exploratory are methods that can be described as phenotypic profiling—creating signatures or profiles from multiparametric, feature-based analysis of cellular phenotypes of each sample so that the biological similarities among samples are reflected in the similarities among profiles. Mathematically, a profile is simply a set of numerical values that represent a given treatment condition. In this section, we review five phenotypic profiling approaches that have been shown to be effective in previously reported experiments.
Approach 1: Summary of Feature Distributions
Each component of the phenotypic profile for a sample is a simple summary statistic, such as the mean, computed across all the cells in the sample for each feature. Adams et al. 24 used this method to compute profiles for identifying the mechanisms of action of compounds by similarity to those with known mechanisms. Genovesio et al. 4 used it to select hits from a genome-wide loss-of-function screen. Gustafsdottir et al. 25 used it to cluster compounds by similarity. The advantage of this method is its simplicity and ease of implementation. It does not, however, capture heterogeneity in cell populations, and that may prevent it from detecting effects of perturbations when a small fraction of cells are affected.
Approach 2: Summary of Feature Differences between Treatment and Control Distributions
The phenotypic profile is given by the differences in distributions in each cellular feature between the treatment sample and control samples. Perlman et al. 2 use the Kolmogorov–Smirnov statistic, a nonparametric measure of difference between distributions, to construct profiles for identifying the mechanism of action of compounds. By measuring distributional differences in each feature, treatment effects can be detected even when the cellular response is heterogeneous, albeit ignoring changes that are only seen when considering two or more features simultaneously. This approach is very sensitive to the choice of control distribution, because all samples are compared against it, with different controls potentially leading to vastly different signatures for a treatment.
Approach 3: Multivariate Classifier Separating Treatment and Control
The phenotypic profile is constructed by training a multivariate classifier to distinguish samples of treatment and control cells. Using this approach, Loo et al. 3 identified the mechanism of action of compounds by training an SVM and using the normal vector of the classifier’s separating hyperplane as the treatment’s phenotypic profile. This method has the advantage of combining information among all the features in a true multivariate manner. It may, however, emphasize features that distinguish a treatment from control, rather than from other compounds or known compound groups, making the profiles less effective on tasks such as grouping compounds into mechanisms of action. 26 Further, subpopulation information may be lost as all cells from a sample are grouped into a single class when training the classifier.
Approach 4: Normalized Frequency of Cells from Each Subpopulation
It is well known that cellular subpopulations within a sample may respond differently to treatments,27,28 a phenomenon that is unaccounted for in profiling methods that assume homogeneous responses to perturbations. Although Approach 2 partially addresses this problem by measuring population differences per feature, a more comprehensive solution is to model all the subpopulations in the experiment explicitly and to then represent a treatment by the relative frequency of cells that belong to each subpopulation. An example of this approach is presented by Slack et al., 29 in which a clustering algorithm (Gaussian mixture models, or GMMs) is used to identify cellular subpopulations, and the profile is constructed as the percentage of the sample’s cells that fall into each subpopulation. Although considering cells as falling into discrete subpopulations is an imperfect representation of the variation seen among different cells and different features, Slack et al. successfully used this method to identify the mechanism of action of drugs. A potential shortcoming is that GMMs, similar to most clustering algorithms, can fail to give meaningful clusters in high dimensions due to the redundancy of features, the sparseness of data, or the existence of clusters in different subspaces. 30
Approach 5: Data-Driven Feature Reduction
When several hundreds of image-based measurements are extracted per cell, many features tend to be highly correlated with each other. This leads to the redundant features being weighted higher than less redundant features when computing similarities. In such scenarios, feature reduction techniques may help tackle this problem either by selecting a subset of features or by linearly combining features so that correlated features group together. As an example, Young et al. 31 estimate a latent factor model from the data for a certain, small number of factors, resulting in a lower-dimensional representation of the data. A profile for the sample is then constructed by averaging the factor values among all cells. This method can be used as a preprocessing step in combination with the approaches described above. In cases in which the features are highly redundant, profiles thus generated are likely to be more discriminative than those generated from the original, high-dimensional feature set—a phenomenon we have previously observed on the task of identifying mechanisms of action of compounds. 26
Many avenues remain to be explored; a routine method of profiling does not yet exist. For example, for all the methods discussed above to generate profiles, a choice must be made in how to measure profile similarity. It is still actively debated which metrics are best in which contexts, with Reisen et al. 32 recently providing a comparison of several that indicates that Kendall’s τ and Spearman’s ρ perform well in most evaluation scenarios. The comparison of the profiling methods themselves has been addressed only recently; 26 further comparisons are needed to test methods against each other in other contexts, such as with different cell lines, assays and stains, and experimental goals.
What about Quality Control?
The profiling methods described above cannot be reduced to simply aiming at distinguishing positive and negative controls using a single feature, for which quality control (QC) metrics like the Z′-factor were designed. Instead, the methods have various goals, and thus the QC metrics should be appropriate to those goals. Classification accuracy is a reasonable quality metric for experiments in which similarity and difference among samples are the goals—however, calculating this requires a large number of positive controls and in many replicates. This is problematic because these are frequently not available: often, positive controls are not known in advance, or they do not reflect the subtlety expected from samples to be tested in the actual experiment. Replicate reproducibility could theoretically be used as a metric indicating assay quality; this, however, requires defining an appropriate null distribution for the metric and has not been used in practice, to our knowledge.
Conclusion
There are clearly important applications involving high-content screening that require sophisticated data analysis methods. It is encouraging to see emerging research aimed at developing suitable approaches. Perhaps most exciting is the prospect that large data sets from past publications have typically been safely archived and might be reanalyzed with some of these new methods to generate new discoveries. As data analysis approaches for these more complex types of HCS experiments become well developed and incorporated into easy-to-use software, we anticipate more powerful applications of HCS to blossom, the value of a typical experiment to increase, and ultimately the technology to be more widely adopted.
Footnotes
Acknowledgements
The authors thank Paul A. Clemons and members of the Imaging Platform, especially Mark-Anthony Bray, David J. Logan, Margaret Anthony, Matthew Veneskey, and Vebjorn Ljosa, for helpful discussions, critiques, and data compilation.
Declaration of Conflicting Interests
The authors declared no potential conflicts of interest with respect to the research, authorship, and/or publication of this article.
Funding
The authors disclosed receipt of the following financial support for the research, authorship, and/or publication of this article: this work was supported by the National Science Foundation (NSF CAREER DBI 1148823, to AEC).
Notes
References
Supplementary Material
Please find the following supplemental material available below.
For Open Access articles published under a Creative Commons License, all supplemental material carries the same license as the article it is associated with.
For non-Open Access articles published, all supplemental material carries a non-exclusive license, and permission requests for re-use of supplemental material or any part of supplemental material shall be sent directly to the copyright owner as specified in the copyright notice associated with the article.