
Abstract
High-content screening (HCS) allows the exploration of complex cellular phenotypes by automated microscopy and is increasingly being adopted for small interfering RNA genomic screening and phenotypic drug discovery. We introduce a series of cell-based evaluation metrics that have been implemented and validated in a mono-parametric HCS for regulators of the membrane trafficking protein caveolin 1 (CAV1) and have also proved useful for the development of a multiparametric phenotypic HCS for regulators of cytoskeletal reorganization. Imaging metrics evaluate imaging quality such as staining and focus, whereas cell biology metrics are fuzzy logic–based evaluators describing complex biological parameters such as sparseness, confluency, and spreading. The evaluation metrics were implemented in a data-mining pipeline, which first filters out cells that do not pass a quality criterion based on imaging metrics and then uses cell biology metrics to stratify cell samples to allow further analysis of homogeneous cell populations. Use of these metrics significantly improved the robustness of the monoparametric assay tested, as revealed by an increase in Z′ factor, Kolmogorov-Smirnov distance, and strict standard mean difference. Cell biology evaluation metrics were also implemented in a novel supervised learning classification method that combines them with phenotypic features in a statistical model that exceeded conventional classification methods, thus improving multiparametric phenotypic assay sensitivity.
Keywords
Introduction
High-content screening (HCS) technology has evolved to the point where it can accurately describe complex cellular behavior. HCS is increasingly being adopted for drug discovery and basic cell biology research because it permits the identification of small compounds that alter cellular phenotypes and is thus of interest in the discovery of new pharmaceuticals and cell biological tools modifying cell function.1–7 HCS consists of performing an automated cell biology assay to explore complex phenotypes by automated high-throughput microscopy imaging, which delivers a high level of cellular information. HCS is a powerful technology combining physiological complexity with high-throughput (HT) automation; however, the data sets produced are extremely large and complex, which hampers optimal exploitation of the wealth of information contained in them.
The relevance of HCS in the early stages of drug discovery and small interfering RNA (siRNA) genomic screens has led to the development of image and data analysis tools that allow accurate detection of candidate “hits” or “screening positives,” tools that have been extensively reviewed in the context of screening for chemical compounds 8 or RNA interference (RNAi). 9 HCS data mining has made considerable progress from early simple well-based methods, which are often insufficient for elucidating complex phenotypes or subtle phenotypic changes, to current cell-based phenotypic descriptions that make use of the true potential of HCS.9–14 Data mining in HCS aims to identify “hits” and is the final step in the HCS analysis pipeline. Hit identification in primary HCS is usually based on a single readout that reflects the desired biological effect, although there are many reports demonstrating the benefits of multiparametric analysis of HCS data to increase reliability of hit prediction and detailed description of cellular phenotypes. Different approaches have been developed to analyze multiparametric HCS data using powerful analysis techniques conducted at the cell data level, such as clustering or machine learning methods.1,4,6,12,14 –17 However, there is a lack of well-established cell-based procedures for improving the quality of HCS, and the standard practice for checking assay quality is averaging data on a “per-well” or “per-image” basis.
Methods to monitor assay performance measure the ability of an assay to discriminate positive versus negative samples to ensure that data obtained from the assay meet the minimum standard of quality thereby, increasing the reliability of hit prediction. A series of assay quality metrics has been developed, 9 the most commonly used metric being Z′ or Z factor, which applies to monoparametric readouts. 10 Z′ combines the mean and standard deviation of both positive and negative controls, yielding a unique parameter. It is commonly accepted that a Z′ higher than 0.5 is indicative of good-quality screening. Variations of this factor have been reported that integrate multiple readout parameters 18 and siRNA design into account. 19 Other quality metrics common in HCS include strict standard mean difference (SSMD), 20 the expression of which, similar to Z′, combines the mean and standard deviation of the controls, and the Kolmogorov-Smirnov (KS) distance 21 (statistic), which is a nonparametric distance measure avoiding any assumptions on data normality.
We have developed herein a series of “cell-based” imaging- and biology-related evaluation metrics, as well as a novel data exploration pipeline that takes advantage of these metrics for the study of phenotypic effects in HCS assays. The data-mining procedure described here was tested on a monoparametric assay, yielding a consistent rise in Z′ score, KS distance, and SSMD that demonstrates its efficiency in improving assay quality; moreover, this was shown to improve hit identification. We also demonstrate the usefulness of the cell biology evaluation metrics developed here for improving sensitivity of a multiparametric machine learning–based phenotypic classification and show how this approach is useful as an assay readout. A voting model strategy was developed, taking advantage of the ability of the cell biology metrics to stratify cellular populations based on their biological characteristics, thereby improving phenotypic classification and the distance between negative and positive controls used for assay development.
Materials and Methods
Cells, Constructs, Antibodies, and Staining Reagents
Human breast adenocarcinoma (MDA-MB-231) and prostate cancer (PC3) cells (both from ATCC, Manassas, VA) were maintained in 10% fetal bovine serum (FBS)–supplemented Dulbecco’s modified Eagle’s medium (DMEM) and F12K media, respectively. The Rab8Q67L-GFP construct has been described previously. 22 Anti-vinculin (V9131), anti–caveolin 1 (CAV1) (D46G3), anti-tubulin (YOL1/34), and anti–β1 integrin (ITGB1) (K20) mAbs were from Sigma-Aldrich (St. Louis, MO), Cell Signaling Technology (Danvers, MA), Abcam (Cambridge, MA), and Beckman Coulter (Brea, CA), respectively. Alexa 647 phalloidin, Cell Mask Blue, and secondary mAbs labeled with Alexa 546, Alexa 488, and Alexa 647 were purchased from Invitrogen (Carlsbad, CA).
siRNA Assay for Regulators of CAV1 Expression
A collection of siRNA oligos targeting 56 genes (4 siRNA oligos per gene) purchased from Qiagen (GmbH, Hilden, Germany) was assayed in 384-well plates in triplicate. The plates were prepared automatically using the Freedom Evo 2000 robot (TECAN, Männedorf, Switzerland). PC3 transfection with siRNAs was performed using the solid-phase reverse transfection protocol 23 with a 20-nM siRNA concentration. Cells were incubated for 48 h to achieve protein knockdown, then fixed and stained. Immunofluorescence staining was performed using 4 µg/mL anti-CAV1 and anti-ITGB1. Then, 0.1% bovine serum albumin (BSA) in phosphate-buffered saline was used as blocking agent. Anti-rabbit Alexa 546 and anti-mouse Alexa 647 were used as secondary Abs for anti-CAV1 and anti-ITGB1, respectively. Anti-tubulin and anti-rat Alexa 488 were used for revealing a microtubule network, which was used as a staining control. Incubation time for both primary and secondary antibodies was 30 min at a concentration of 4 µg/mL. Cells were also stained with Cell Mask Blue and Hoechst 33342, revealing cytoplasm and nuclei, respectively.
The readout of this assay is the “knockdown state of the cell.” This is the output of a monoparametric linear classifier, based on thresholding the mean intensity of caveolin per cell. Data normalization was performed per plate; this was preferred to per-experiment normalization since there is no per-plate bias given that all experiment plates have the same layout (
Image Acquisition and Analysis
Images were acquired with an Opera automated confocal microscope (PerkinElmer, Waltham, MA) at a magnification of ×20 with water immersion objective NA = 0.7. Images were analyzed with Definiens developer software version XD2 (Definiens AG, Munich, Germany).
Individual nuclei were identified by size and above-background intensity in the Hoechst image using an adaptive threshold. Cells were detected using the detection of nuclei as a seed for an iterative region-growing algorithm. Segmentation of subcellular structures of interest was based on their intensity/contrast with the image containing the fluorescence information.
Phenotypic Assay Development for CSK Rearrangements
Phenotypic classification assay for cellular CSK rearrangements consists of transfecting Hela cells with a constitutively active form of RAB8A Rab8Q67L-GFP using Lipofectamine 2000 (Invitrogen) according to the manufacturer’s instructions. After a 48-h incubation with the DNA construct to allow transfection, cells were fixed with 4% paraformaldehyde, permeabilized with 0.5% Triton X-100, and stained with anti-vinculin and anti-mouse Alexa 546 secondary Ab. Phalloidin labeled with Alexa 647 was then used to stain polymerized actin. Cells were also stained with Cell Mask Blue and Hoechst 33342. Images were acquired and analyzed to identify green fluorescent protein (GFP) positive and negative cells based on intensity thresholding of GFP fluorescence. In addition, the image analysis procedure extracted 162 features descriptive of the organization of actin and focal adhesions (FAs) from each individual cell (
A sample of Hela cells transiently transfected with Rab8Q67L-GFP including cells expressing or not expressing Rab8Q67L-GFP (GFP+ and GFP–, respectively) was used to train classifiers. The GFP+ cells had CSK rearrangements promoted by the expression of the constitutively active mutant of RAB8A. Classifiers ascribed cells that had their CSK rearranged or not to the + and – classes, respectively, based on their phenotypic features. The labeling of GFP+ and GFP– cells coming from the intensity-based image analysis was taken as a ground truth for determining the accuracy of classifier predictions. Supervised classification models trained in this manner were used to classify test samples transfected with Rab8Q67L-GFP. A class prediction of each cell in every test sample was based on phenotypic features exclusively, taking the GFP intensity as a ground truth to determine sensitivity of the classifier to predict the CSK rearrangements promoted by Rab8Q67L-GFP expression.
Voting-Based Model Classification Using Cell Biology Metrics
A voting model strategy was developed to improve the supervised classification sensitivity as an assay readout, taking advantage of the cell biology metrics based on stratification. The training set was divided in quartiles based on each of the seven cell biology evaluation metrics. Then, an LR model specific to the cell patterns on each quartile was built for each evaluation metric, repeating this procedure in 28 quartile-metric LR models. Then, to classify a given test cell, first its quartile was located for each metric and then the corresponding LR model was applied to the cell’s features to obtain a classification probability. Thus, to each of the seven metrics, a corresponding LR “metric model” was associated and a vote obtained from it. The consensus vote of the seven models obtained for each evaluation metric was used to finally classify the cell. In the base model, a cell was classified as positive or negative if it received four or more positive or negative votes. We also strengthened this procedure by setting the threshold to five, six, or seven votes for classification, which omitted a small number of cells left unclassified.
Results
HCS Assays Used for Testing Cell Evaluation Metrics
The cell-based imaging and cell biology metrics we introduce here have been developed and tested in a monoparametric CAV1 siRNA assay aimed to identify genes influencing the expression of the membrane trafficking protein CAV1. PC3 cells were stained with Hoechst (nuclei segmentation), tubulin, and ITGB1, which in combination with Hoechst allowed cell segmentation ( Fig. 1A ). CAV1 staining was used to compute the readout of this assay, scoring the “knockdown status” of examined cells, expressed as a 0/1 value, respectively corresponding to cells with a CAV1 intensity below or above a defined threshold. The metrics were also tested in the development of a multiparametric nonlinear classification-based assay for CSK rearrangements. The phenotypic assay was developed to automatically identify the CSK rearrangements induced by the expression of an activated form of RAB8A GTPase, a potent vesicle trafficking regulator. To this end, HeLa cells were transfected with a constitutively active mutant form of RAB8A fused to GFP (Rab8Q67L-GFP). Identification of nuclei was based on the Hoechst image, and cell segmentation was based on Cell Mask Blue and phalloidin images. In addition, actin-polymerized structures and FAs were segmented based on phalloidin and vinculin images, respectively ( Fig. 1B ). Segmented cells were assigned a class based on GFP fluorescence signal as untransfected cells (GFP–) and Rab8Q67L-GFP–expressing cells (GFP+), and then quantitative features describing cytoskeletal phenotypic rearrangements, consisting of attributes of actin and FA organization from each cell, were extracted. Supervised classification of GFP– (wild-type phenotype) and GFP+ (RAB8A-induced phenotypic rearranged phenotype) was performed using logistic regression. The sensitivity of supervised classification to predict the class of Rab8Q67L-expressing cells was used as an assay readout. This assay was developed with the purpose of testing for cellular perturbations that are able to abolish CSK rearrangements promoted by RAB8A expression, which would render a decrease in the true-positive rate (sensitivity) and could be used to assay for drugs/siRNAs to promote or prevent complex cellular phenotypes.
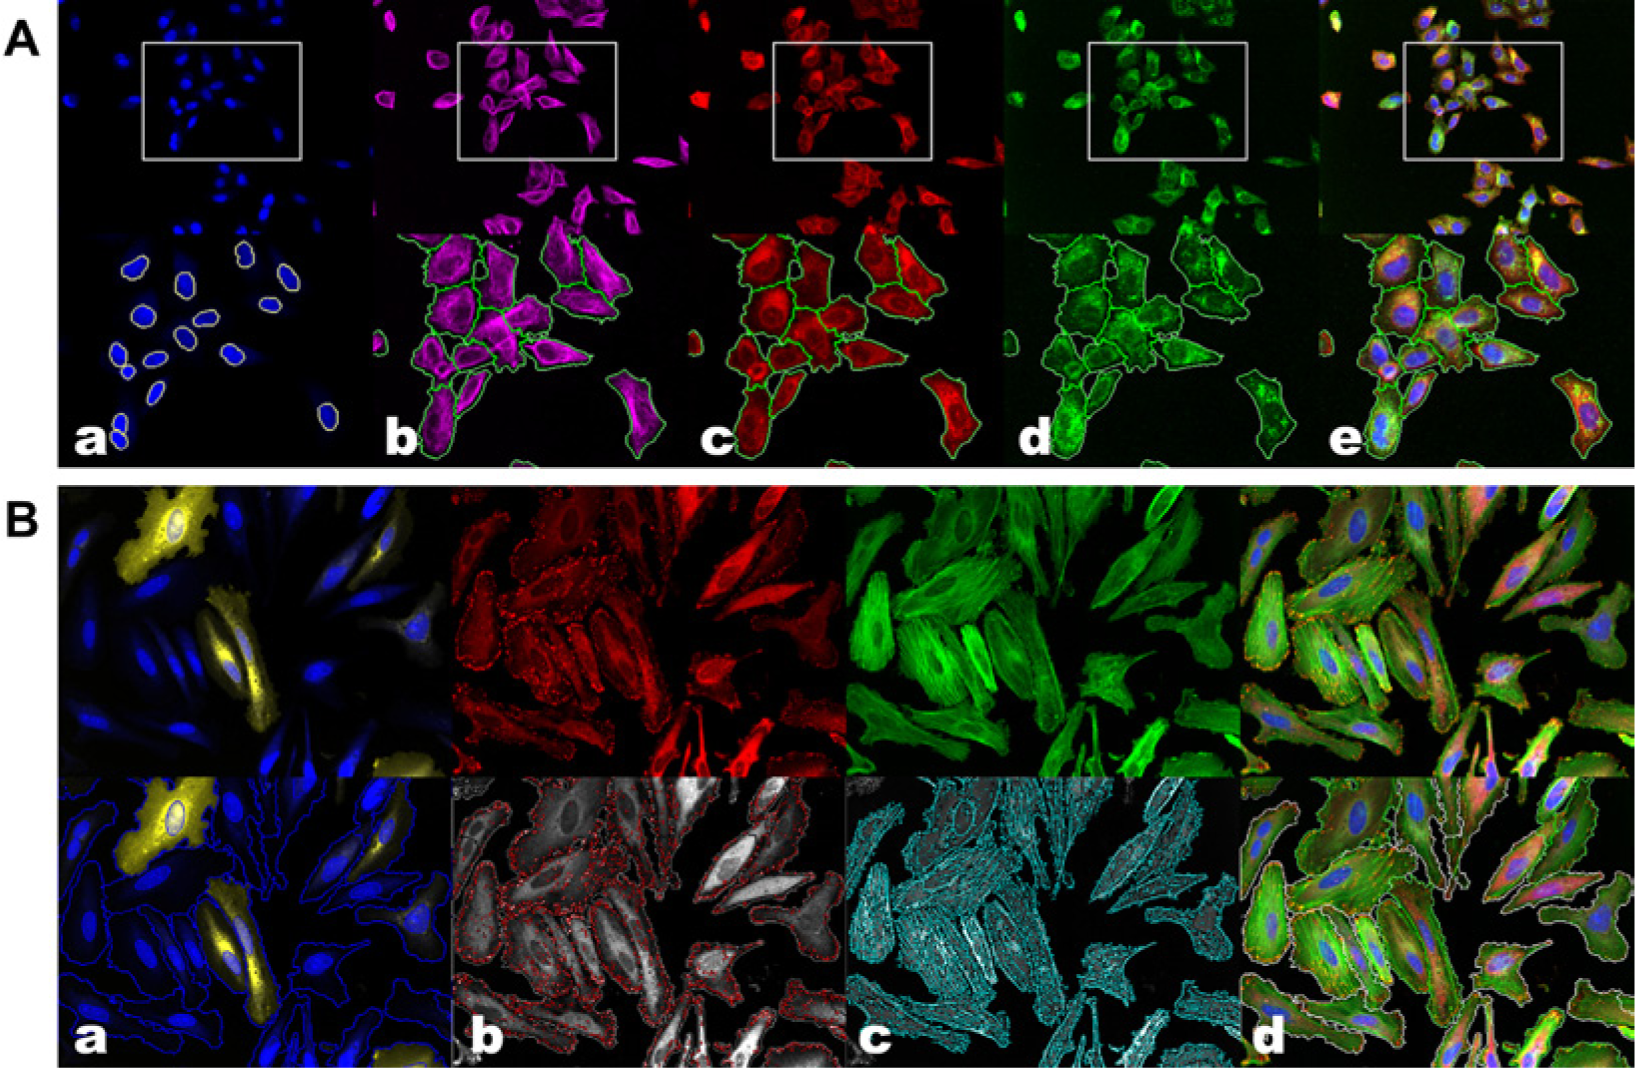
Confocal microscopy images and image segmentation of the two case study assays. Example images of (
Cell Evaluation Metrics Description
A suite of cell-based metrics that count as cell evaluators was developed. For each cell, a set of features was measured, ranging from intensity properties of the different fluorescence stainings to morphological and shape parameters. These features were then mapped to the interval [0, 1]. When features are mapped using a linear function (plate-based linear normalization), we refer to the metric as crisp, and when the mapping uses a nonlinear function, the metric is referred to as fuzzy and the mapping function is referred to as membership function (MF). Fuzzy metrics were defined as a combination (arithmetic mean) of fuzzy quantities, each of which was mapped to the interval [0, 1] using a membership function that was defined empirically from a data subset and that relied on expert knowledge of the biological characteristic being evaluated in each particular metric.
We distinguish between imaging metrics that reflect the image quality conditions and cell biology metrics that describe the biological status and environmental conditions of cells; a detailed description of the metrics computation method is shown in Table 1 . Imaging metrics include focus, which is a fuzzy score representing the inverse of blurriness. Out-of-focus cells (upper right corner of the image) present focus metric values ranging from 0 to 0.5, whereas cells in focus (left area of image) present values close to 1 ( Fig. 2A ). Signal-to-background ratio is a crisp score with values in the range [0, 1], where 0 corresponds to cells with a very low signal-to-background ratio and 1 to cells with a maximal signal-to-background ratio; these latter cells should be considered as having high imaging quality. Staining is a crisp score reflecting how well the fluorescence staining was performed; very low and high values both indicate potential staining problems in the sense of insufficient staining or saturation effects, respectively. Signal-to-background ratio and staining metrics were both measured using tubulin fluorescence image, which is the experimental staining control, and should hence be stable with the different treatments used in the assay.
Summary of Cell Evaluation Metrics.
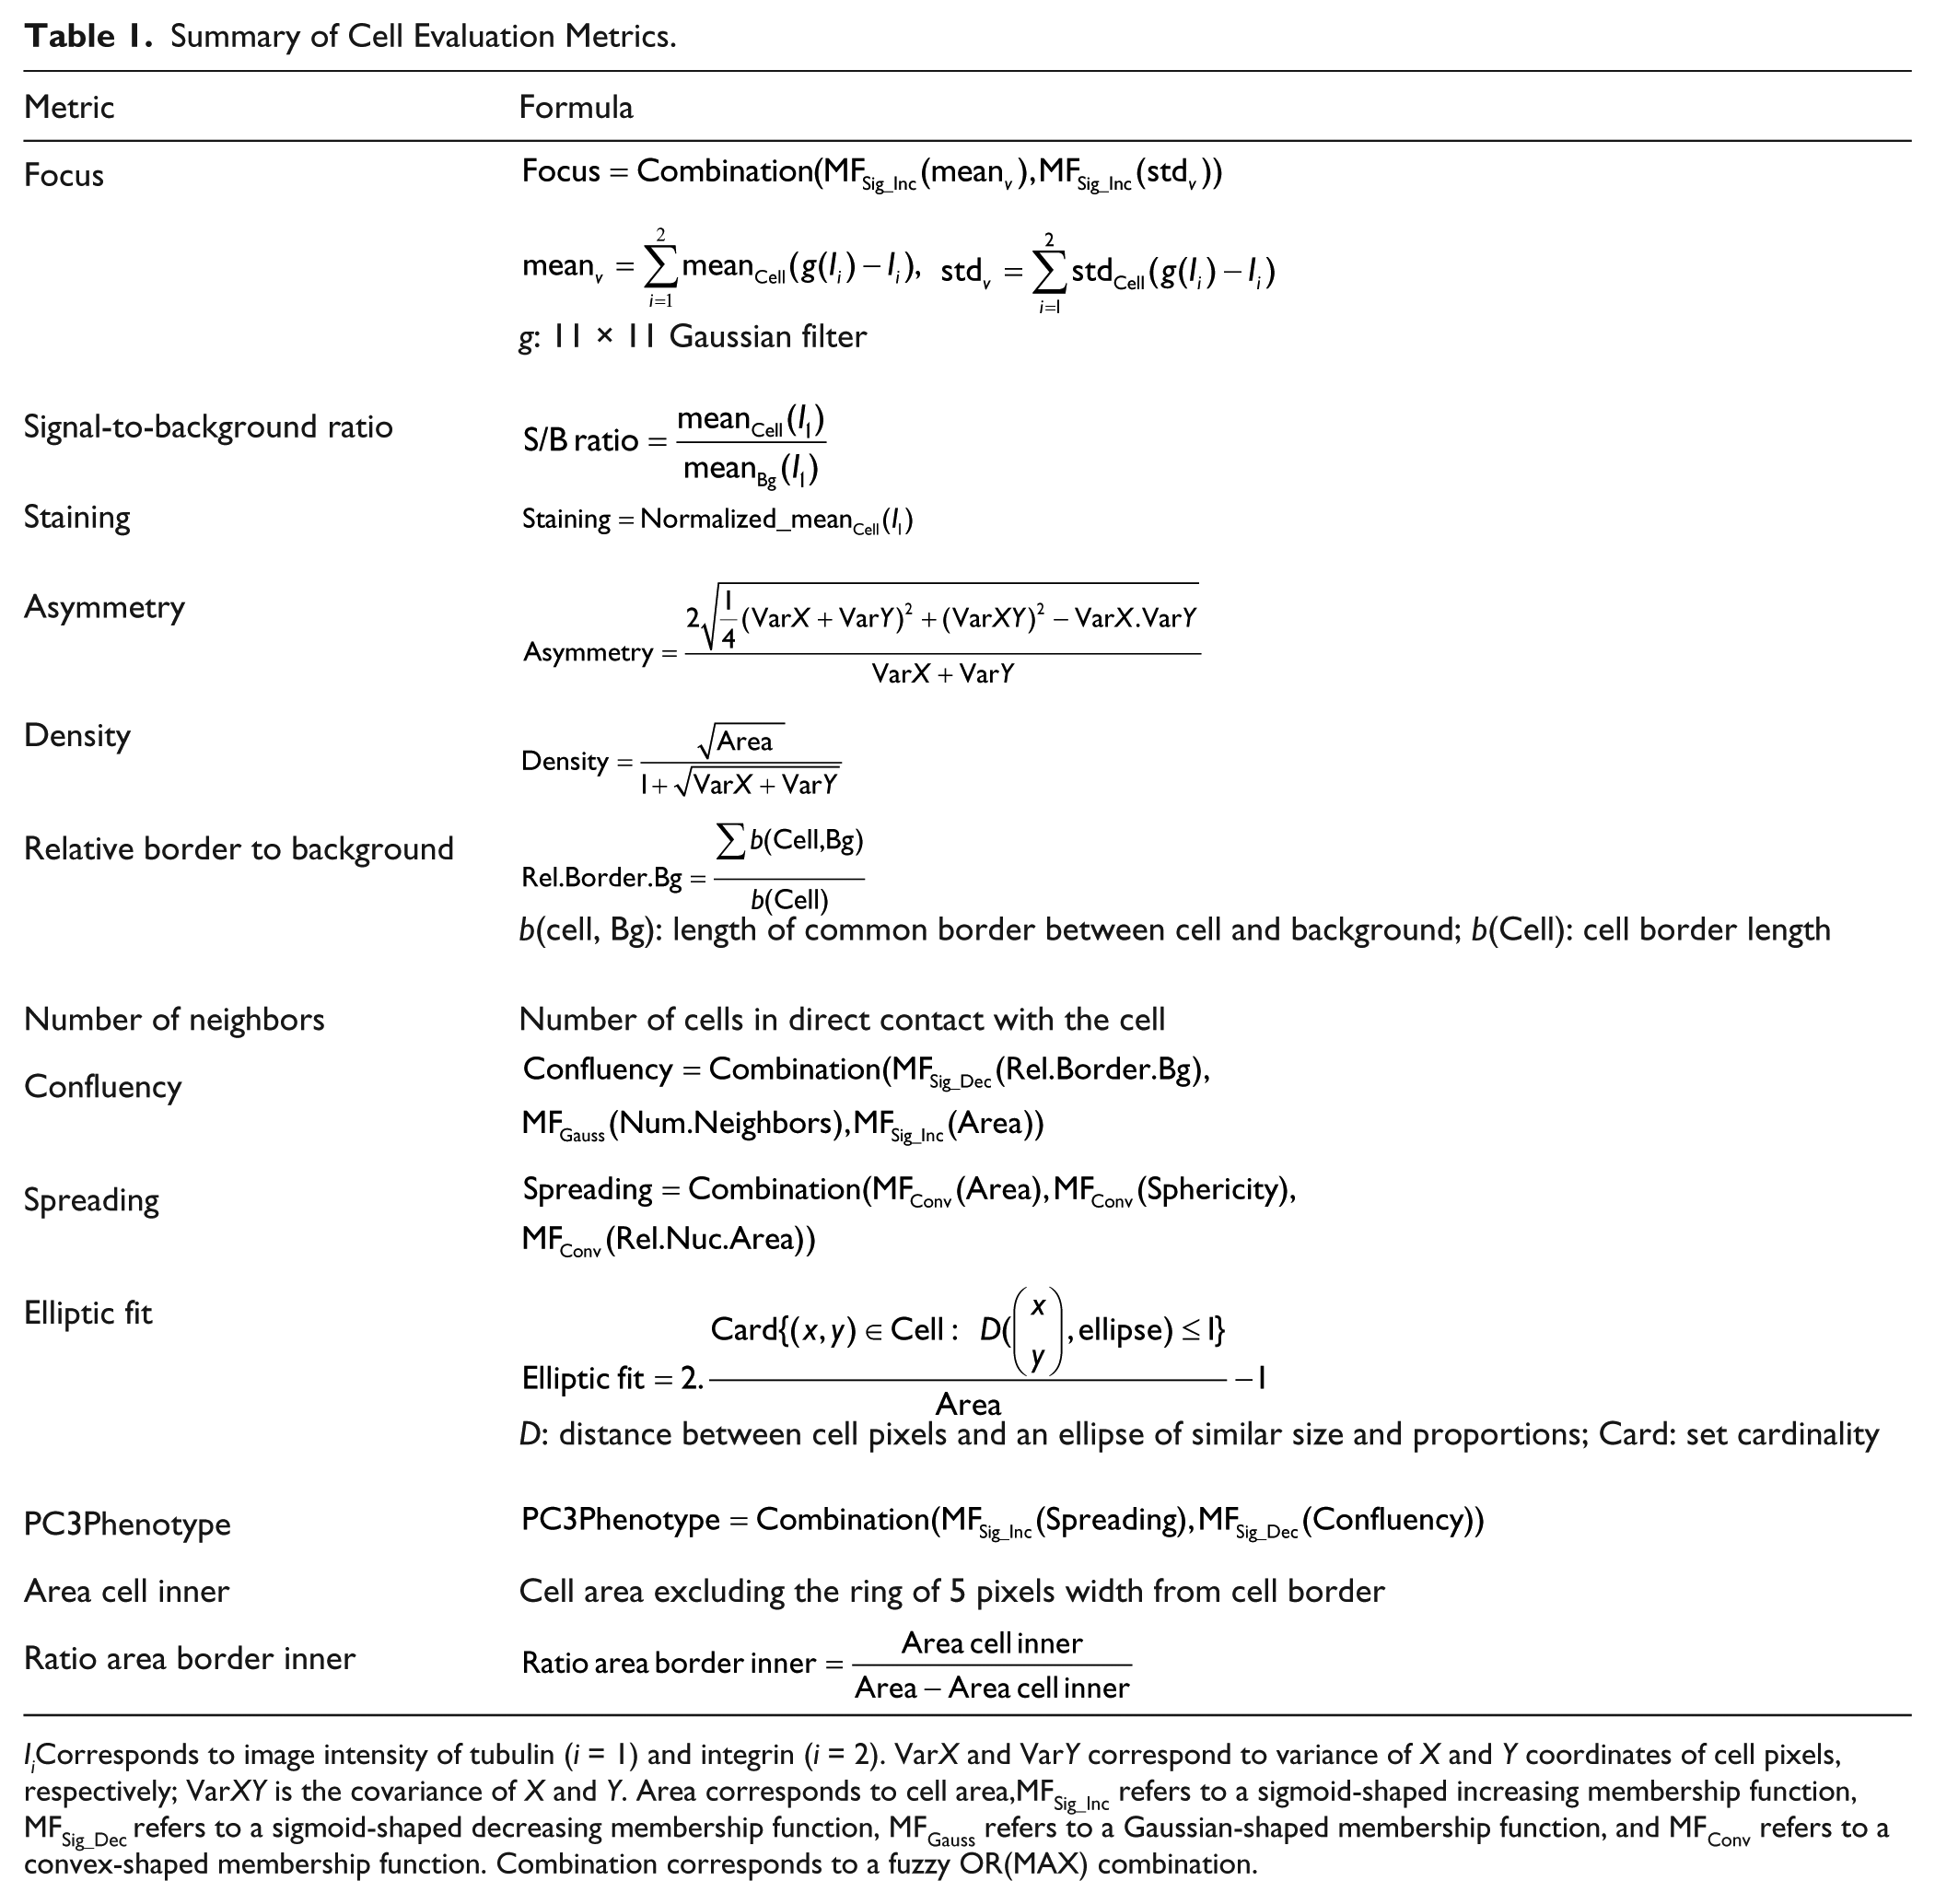
IiCorresponds to image intensity of tubulin (i = 1) and integrin (i = 2). VarX and VarY correspond to variance of X and Y coordinates of cell pixels, respectively; VarXY is the covariance of X and Y. Area corresponds to cell area,MFSig_Inc refers to a sigmoid-shaped increasing membership function, MFSig_Dec refers to a sigmoid-shaped decreasing membership function, MFGauss refers to a Gaussian-shaped membership function, and MFConv refers to a convex-shaped membership function. Combination corresponds to a fuzzy OR(MAX) combination.
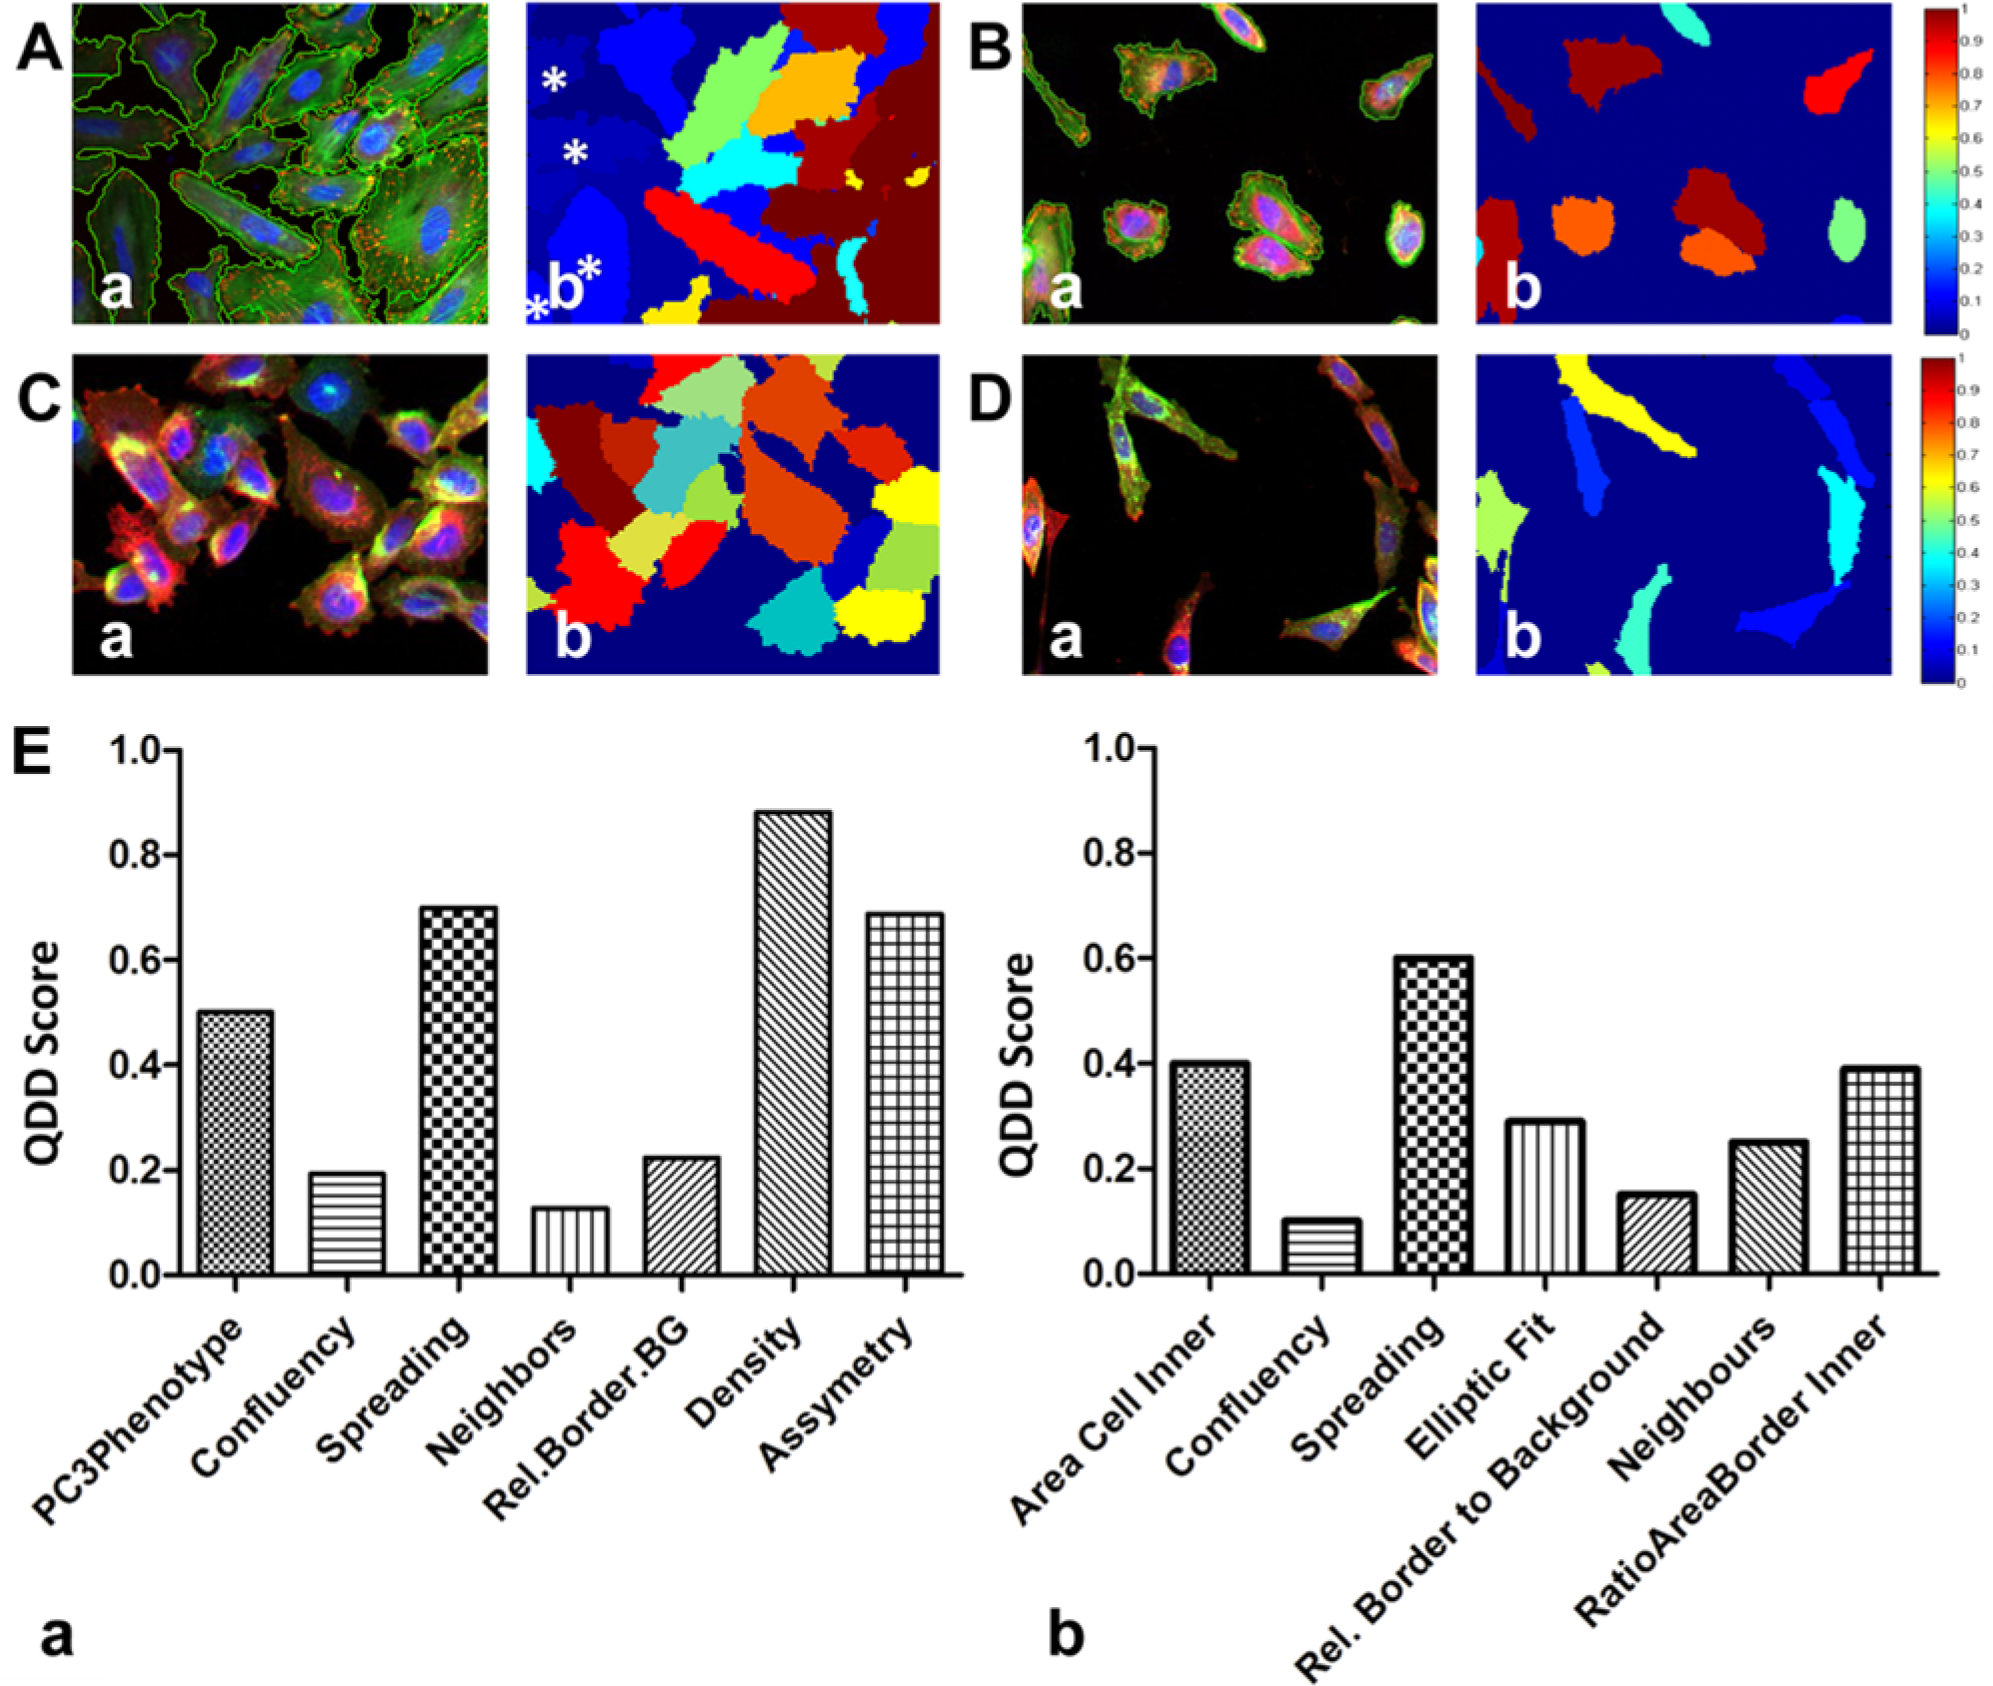
Influence of cell evaluation metrics on assay readouts. (
Cell biology metrics include the following. Cell asymmetry is a crisp score ranging from 0 to 1, with 0 corresponding to an ellipse-like symmetric cell and 1 to an asymmetric cell. Cell density is a crisp score in the [0, 1] interval that describes the distribution of cell pixels; cells with a square-like shape have a cell density close to 1, whereas more elongated cells have a density tending to 0. Relative border to background is a crisp score that measures the relative border length a cell shares with the background; it ranges from 0 to 1, with 0 corresponding to cells completely surrounded by other cells and 1 corresponding to isolated cells. Number of neighbors (neighbors) is a crisp score that measures the number of cells in direct contact with the cell of interest. Confluency is a fuzzy score that computes the combination of three fuzzy quantities: relative border to background, number of neighbors, and cell area. The confluency score is higher when cells grow in a sparse mode and is lower when cells form a confluent monolayer and decreases when increasing the density of cells in the monolayer. Spreading is a fuzzy score that measures the spreading of each cell on the underlying substrate. It is the fuzzy combination of cell area, cell sphericity (the difference between the enclosing ellipse and the enclosed ellipse), and the relative area of the nucleus (related to the volume of the cell), using the membership functions shown in
While most cell biology metrics are common to the two assays presented here, the membership functions are specifically designed for each cell type, being determined empirically depending on the characteristics of each cell type and assay and taking into account the experimental variability inherent to the assay. We also implemented an assay-dependent metric, PC3Phenotype, in the CAV1 assay. This metric describes the three previously reported cell variants of the PC3 cell line, 24 which can be distinguished by their spreading and confluency. PC3S is anchorage independent for growth and presents low confluency and spreading. PC3R and PC3A are both anchorage dependent; PC3R presents low confluency and cells with rounded morphology, whereas PC3A has flat morphology and tight adhesion (i.e., high confluency and high spreading), and they are the most represented phenotypes in cell cultures. PC3Phenotype represents these variants as a single fuzzy metric that combines two other fuzzy scores, spreading and confluency, and ranges from 0 to 1. It was built such that PC3S, PC3R, and PC3A have low, intermediate, and high values of the PC3Phenotype evaluation metric, respectively. Assaying images of cultures with a majority PC3A phenotype yielded PC3Phenotype scores above 0.5 ( Fig. 2C ), whereas scores for cells with a PC3R-like phenotype were between 0.2 and 0.6 ( Fig. 2D ).
Quantile-dependent deviation (QDD) of the normalized mean CAV1 intensity and of logistic regression classification output (probability scores of global classification model) was computed as an estimate of how the cell evaluation metrics influenced the readout of the CAV1 and the CSK rearrangement assays. Although no correlation was observed between evaluators and CAV1 intensity (i.e., spreading;
Given the influence of the cell evaluation metrics on assay results, we propose a workflow in which these metrics are used for data mining of HCS at the cellular level. This workflow first uses the imaging metrics to filter cells that do not pass the quality criteria and then uses the cell biology metrics to stratify cell samples, allowing further analysis of homogeneous subpopulations of cells ( Fig. 3 ).
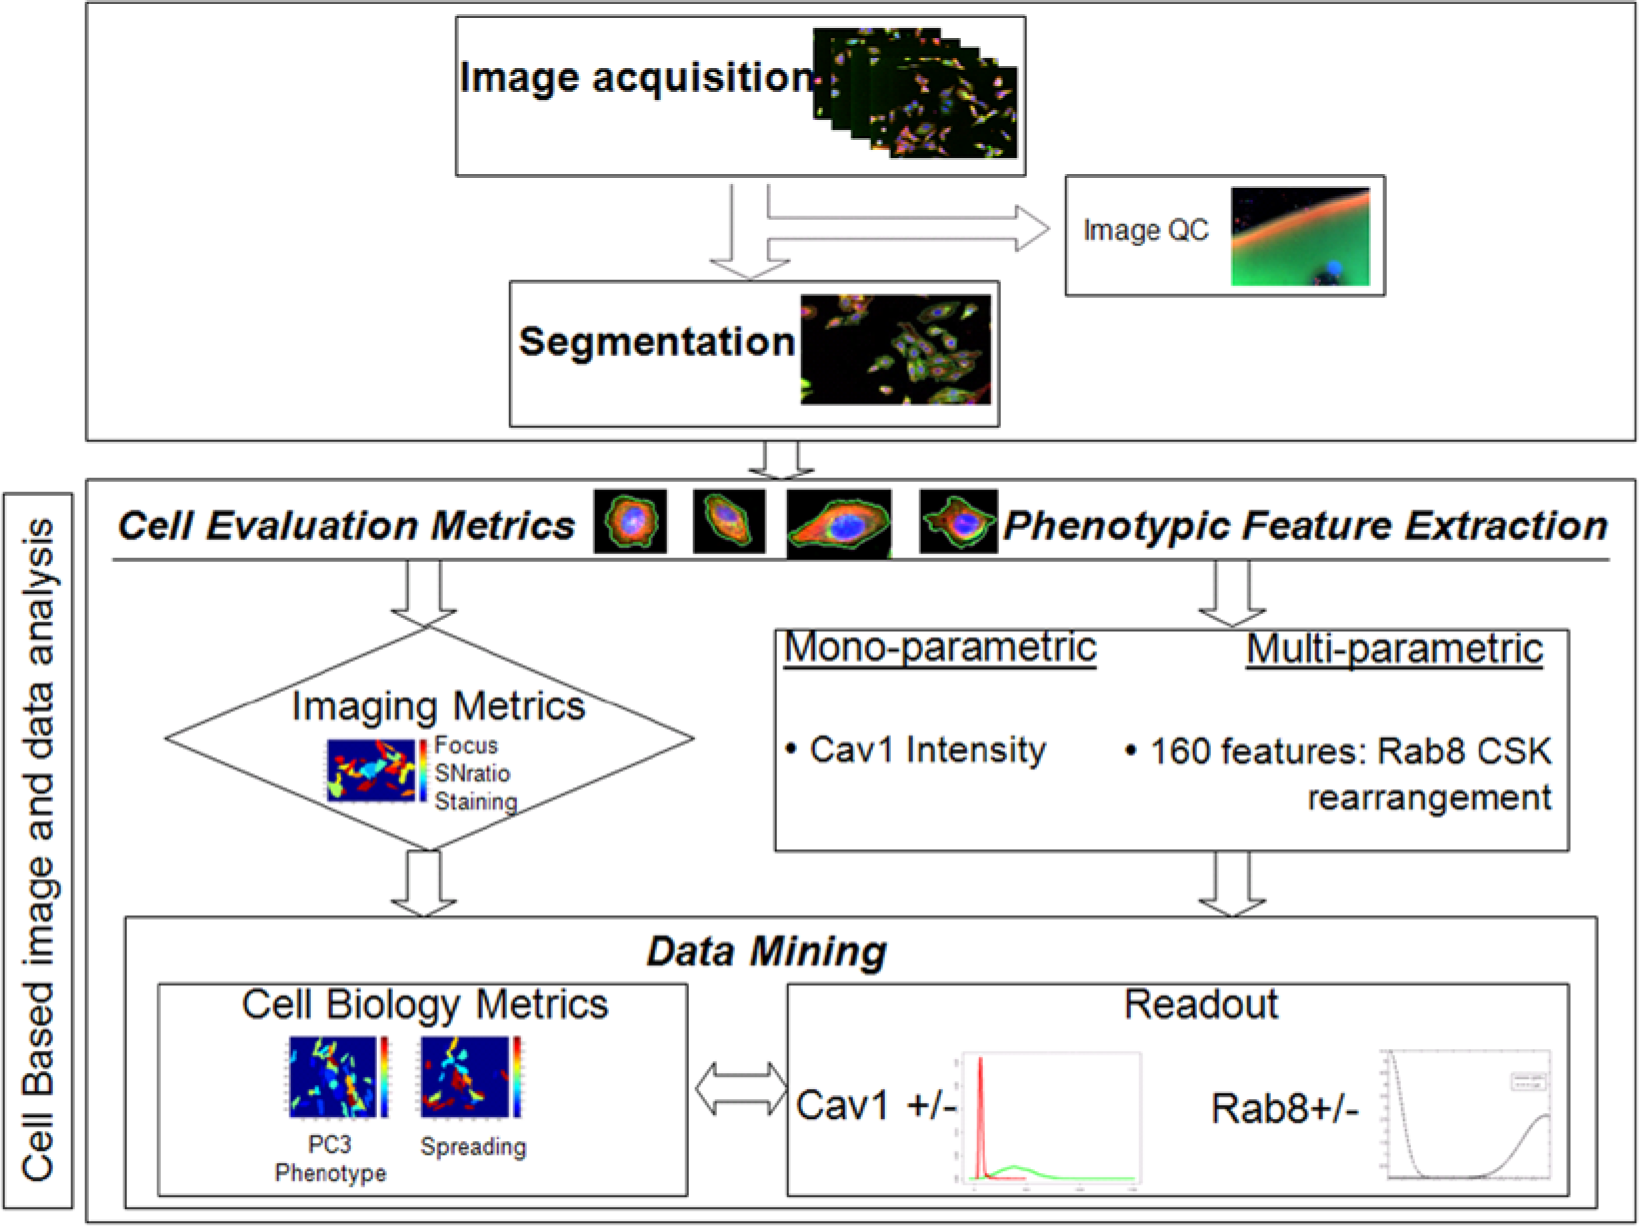
Outline of the image- and data-processing pipeline. Assay images are acquired and subject to an image quality check to discard outliers. Segmentation then identifies cells as individual entities for further analysis. At the cellular level, feature sets are extracted as evaluators, among which are imaging and cell biology metrics. Phenotypic features of the monoparametric (caveolin 1 [CAV1]) and multiparametric (RAB8A CSK rearrangement) assays are extracted at the cellular level to obtain assay readouts. Imaging metrics are used as filtering criteria to remove poorly imaged cells, and cell biology evaluators are used to data mine the assay readout.
Effect of Imaging- and Biology-Based Metrics on Assay Robustness
To further elucidate the influence of the cell evaluation metrics, we analyzed the effect of each data-processing procedure involving these metrics on assay quality. The quality of the CAV1 assay was evaluated by measuring the Z′ factor, KS distance, and SSMD, calculated for the assay readout comparing the negative and positive assay controls (i.e., cells transfected with scrambled siRNA and CAV1 siRNA, respectively).
The first step in the cell-based data-processing pipeline uses imaging metrics as a filter to remove outlier cells. Filtering thresholds were calculated as the 5% quantile for focus and signal-to-background ratio, meaning that cells with values below that separating the 5% quantile of the total cell population were discarded. The staining filter discards cells with a tubulin fluorescence intensity value below the 5% quantile and above the 95% quantile of the total tubulin fluorescence intensity population. Cell counts before and after filtering with imaging evaluators showed that cells are discarded throughout the entire plate wells (
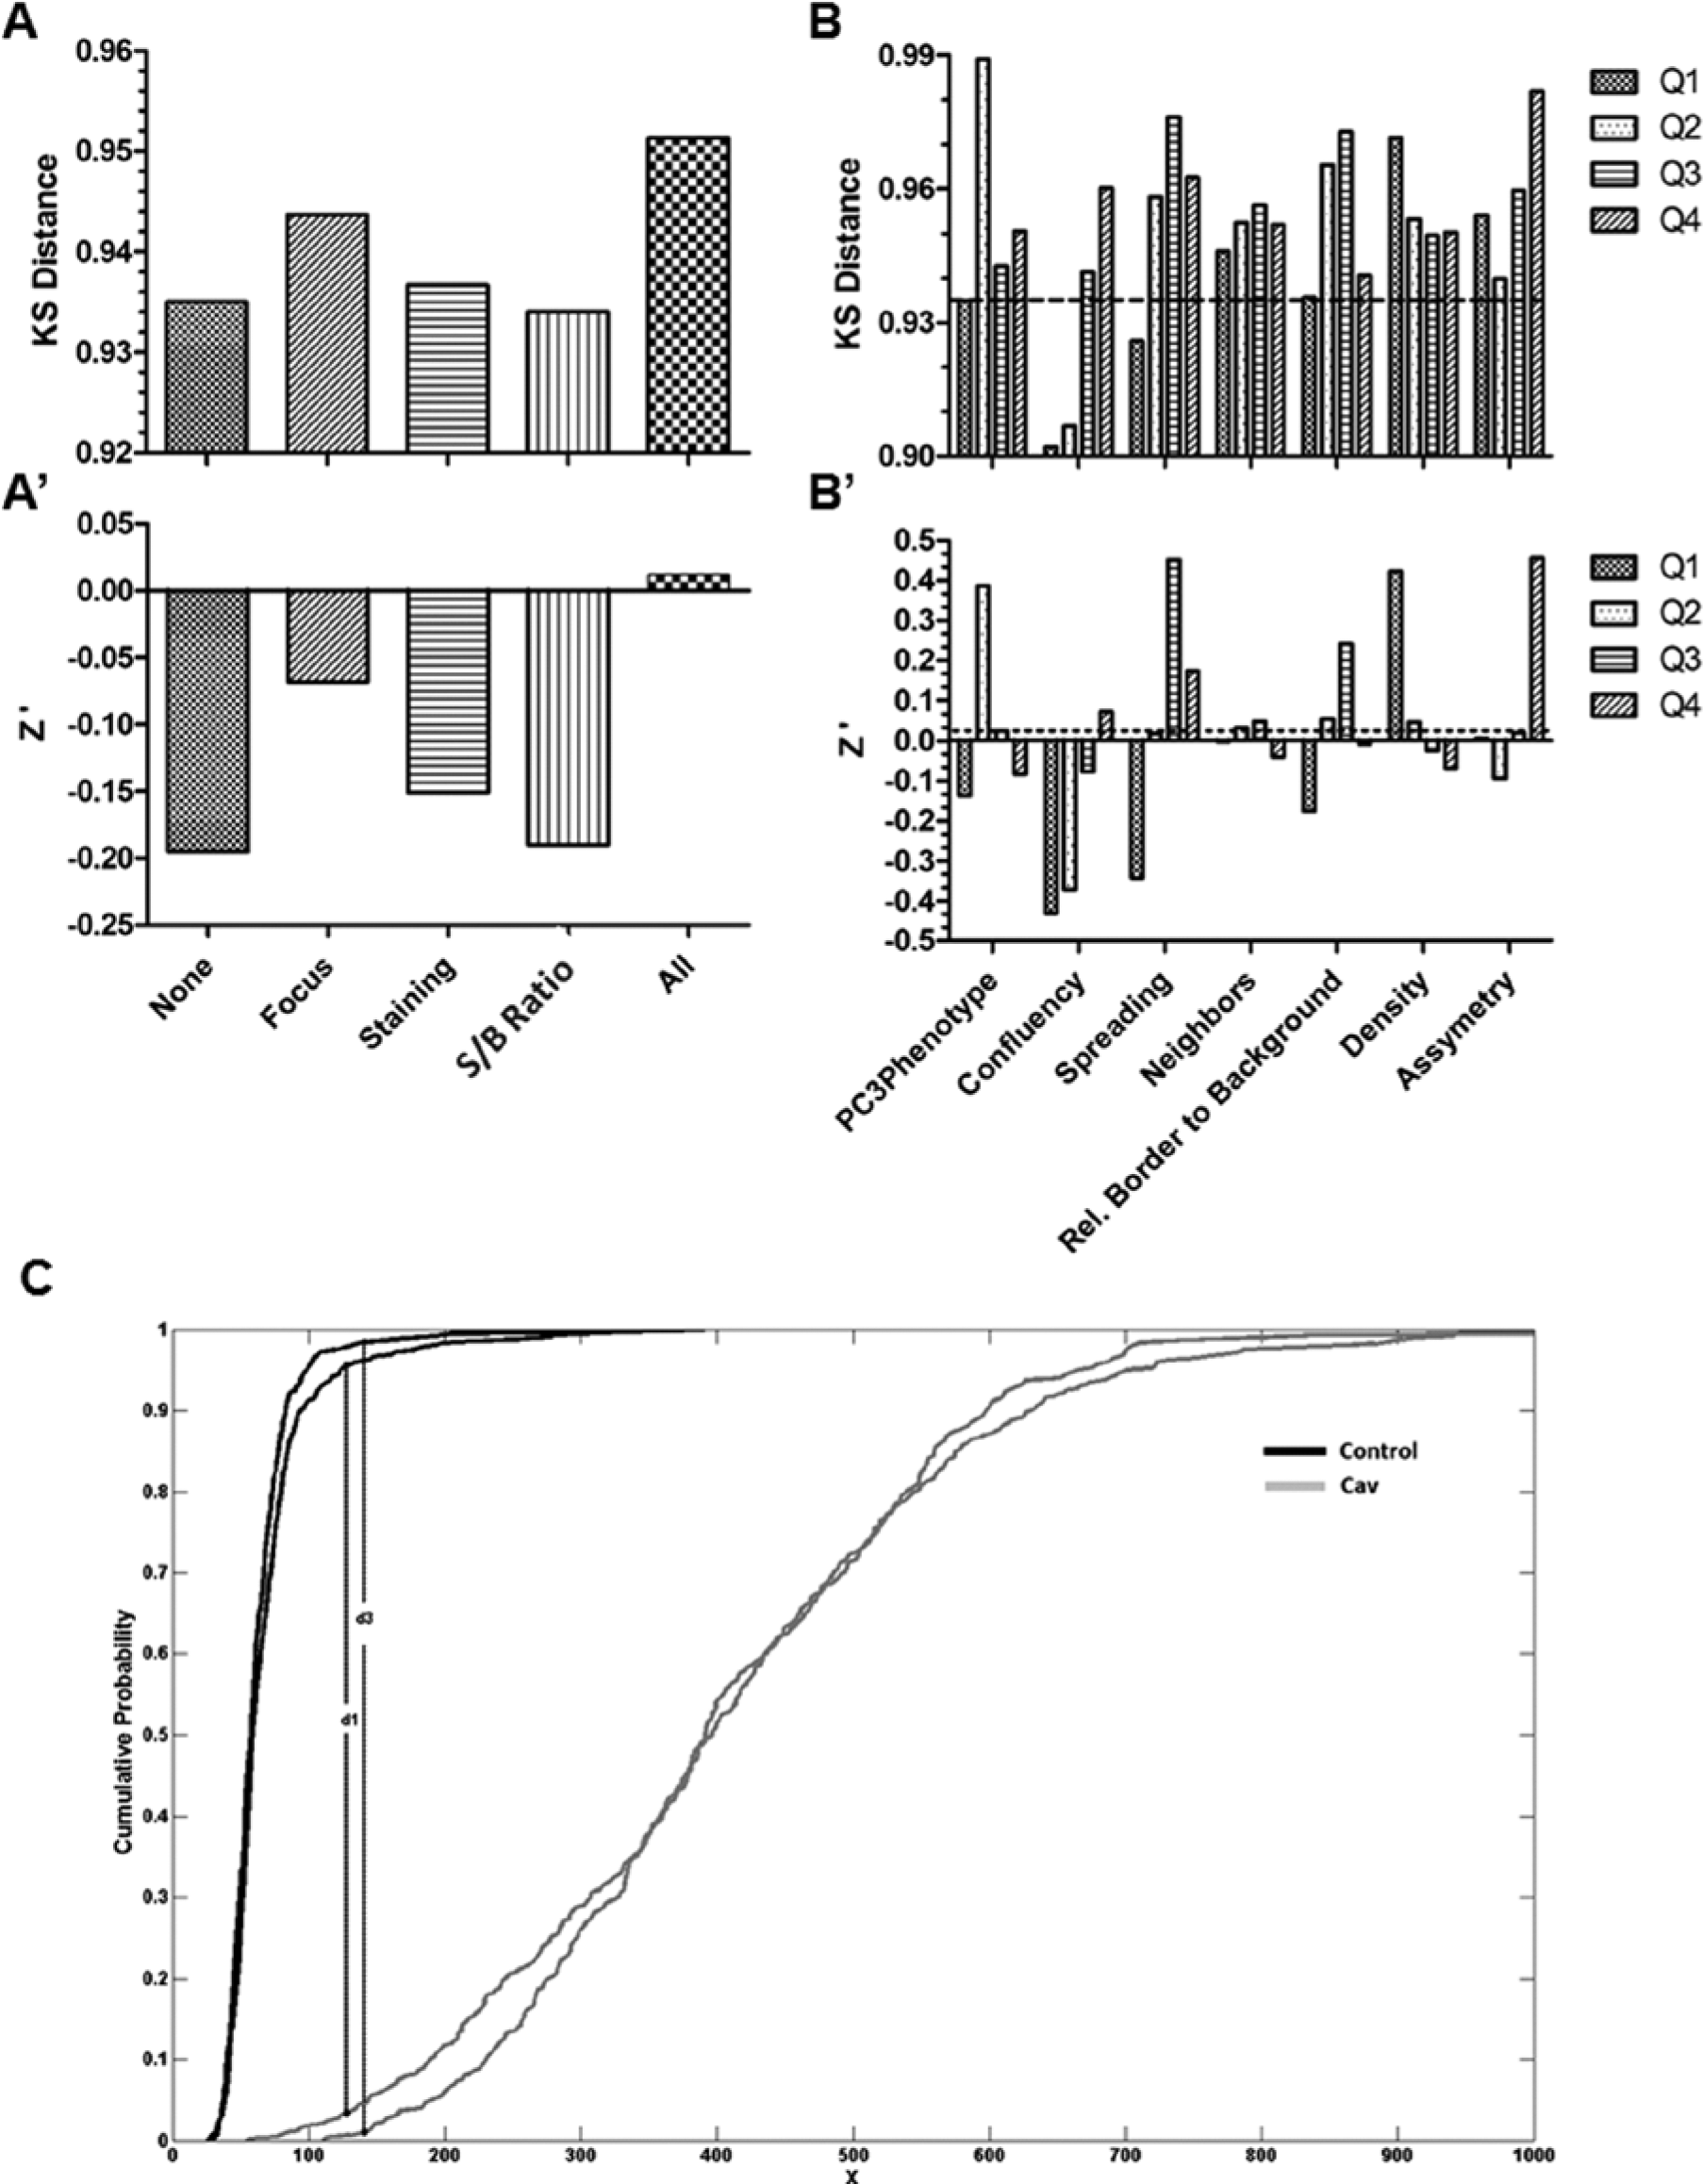
Influence of cell evaluation metrics on Kolmogorov-Smirnov (KS) distance and Z′ value in the caveolin 1 (CAV1) assay. (
To investigate the utility of the cell biology metrics for optimizing the CAV1 assay, each metric was used to stratify cells into four subgroups corresponding to the four quartiles. For each subgroup (quartile), the Z′ factor, KS distance (
Fig. 4B
,
B′
), and SSMD (
To investigate the usefulness of the cell biology metrics in the development of a multiparametric nonlinear classification-based assay for CSK rearrangements, the LR model sensitivity (i.e., positive accuracy as the percentage of correctly classified positive test cells) was calculated as a readout of the assay. Sensitivity quantification was used as an assay quality metric because it assesses the ability of this assay to recognize phenotypic CSK rearrangements promoted by Rab8Q67L-GFP expression in GFP+ cells, as the goal of the assay was to perform assays to identify genes/drugs that perturb the capability of RAB8A expression to induce the cytoskeletal rearranged phenotype. Sensitivity for the global model was computed as 76%, whereas a sample treated with a drug that abolishes the cytoskeletal rearrangements promoted by Rab8Q67L-GFP produced a decrease in sensitivity to 35%. The fuzzy logic–based metrics presented here effectively translated biological knowledge into an increased performance of the supervised classification used as assay readout. The spreading fuzzy metric increased efficiency (0.7 of area under the ROC), whereas the crisp scores used to build this fuzzy metric (sphericity, cell area, and relative nuclear area) yielded smaller increases in classification efficiency (0.64, 0.61, and 0.6 of area under the ROC, respectively). It is worth noting that spreading formed by fuzzy mapping exceeded area under ROCs of individual biology metrics and a linear combination of them ( Fig. 5D ). This clearly indicated the significance of fuzzy mapping.
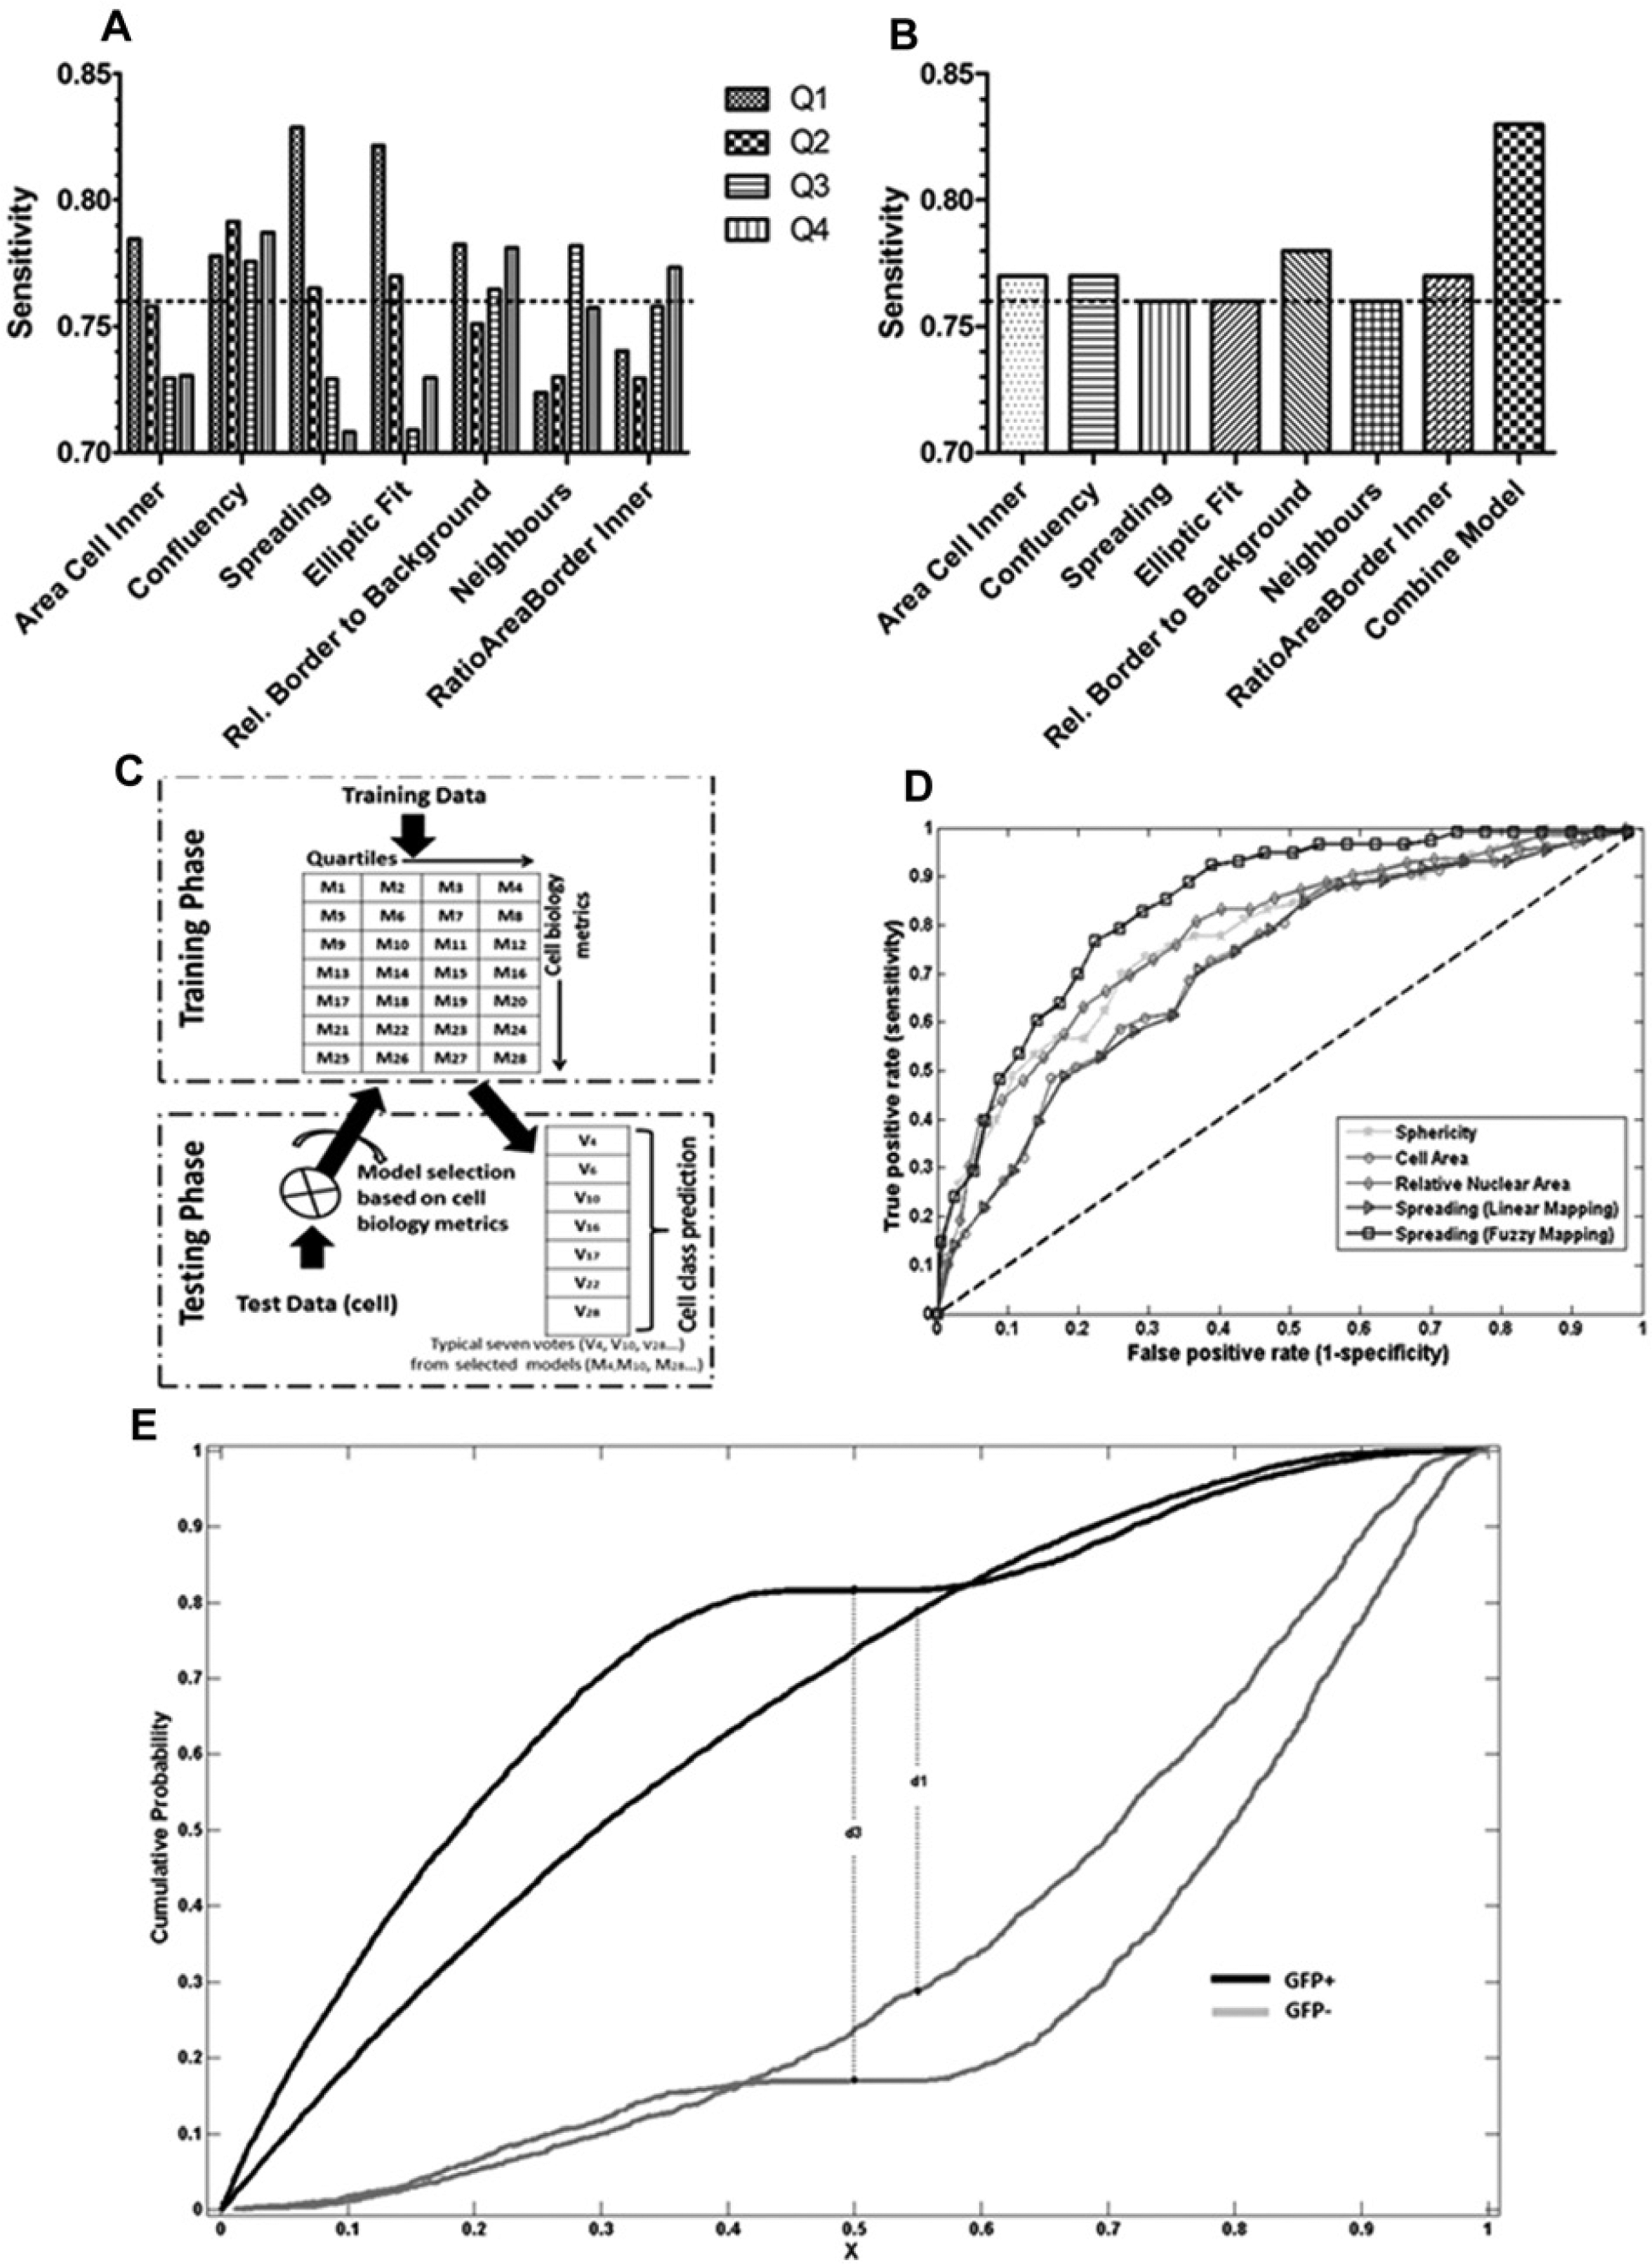
Influence of cell evaluation metrics on the classification sensitivity of the CSK rearrangement phenotype assay and workflow of the proposed voting model strategy. (
Each biology evaluation metric was used to stratify cells into four subgroups corresponding to the four quartiles of the investigated metric (quartiles), and classification sensitivity was obtained to further investigate the variation among different quartiles and compare it with the behavior of the global model, which does not take cell biology metrics into account. Cells grouped according to cell biology metrics quartiles showed an increase in sensitivity over the baseline obtained from the global model for at least one quartile ( Fig. 5A ). This is very important for assay optimization but has the drawback of discarding data in the data-processing pipelines. In the case of confluency, all four quartiles were slightly better than the baseline, suggesting that the high degree of homogeneity of the cells when grouped in this manner has a tendency to increase LR sensitivity. This observation prompted us to test whether stratification of data based on cell biology evaluators could be used to improve assay quality in a manner that avoids discarding data.
A voting model strategy was developed to improve assay readout, taking advantage of the cell biology metrics following the procedure shown in
Figure 5C
. This strategy implied building individual LR models, one for each quartile, over the training data. Since seven cell biology metrics were taken into consideration and each metric contributed to build four models based on quartiles, a collection of 28 models was computed (M1 to M28). This voting procedure for the combined seven cell biology metrics as compared with the individual voting cell biology metrics improved the sensitivity by approximately 3.5 percentage points over the global model and was found statistically significant (p < 0.05) by the Delong test
25
(
Fig. 5B
). Voting threshold values of 5, 6, and 7 could also be used and resulted in improved specificity, which reached 83.08 when patterns had to receive seven votes to be classified as P or N (although there was a trade-off, since only 6535 test patterns [i.e., about 75%] would be classified;
Discussion
This report describes a suite of cell-based metrics that can be used to either filter HCS data in a cell-specific manner (imaging metrics) or evaluate biologically relevant cell characteristics (cell biology metrics) to stratify cellular data in homogeneous cell subpopulations. These metrics were implemented in a novel exploratory HCS data analysis pipeline. We present data demonstrating that a marginal assay can be converted into an acceptable assay by using these cell evaluation metrics, as well as provide results showing their relevance in assay development and optimization.
Imaging metrics were used to filter cell entities with low imaging quality and were implemented in an image- and data-processing pipeline that used them as cell-based quality controls. The use of the imaging metrics described here allowed us to discard only those cells that were insufficiently stained or that were inadequately focused. Implementation of this procedure in the data-processing pipeline yielded an increase in Z′, KS distance, and SSMD, validating this approach for improving assay quality. Current methods for ensuring reliable HCS results are based on image/well quality controls (QC). QC can be performed by simple plate visualization to detect undesirable patterns that may indicate technical problems or by measuring quality metrics that identify anomalies and aberrations in image quality and are used to discard HCS images. 11 The metrics introduced herein differ from previous ones in that they are used as cell-based quality controls to avoid discarding whole images, which can be detrimental when data sample size in HT assays is limited. An additional advantage of cleaning data at the cellular level (rather than at the image or well levels) is that it discards only those cells that would have been missed otherwise, thereby polluting the data.
Cell variability is always present to some degree in any cell population, thus compromising HCS statistical analysis, with significant effects on the quality of results. Several approaches have evaluated intercell variability by obtaining quantitative descriptors derived from high-content imaging and using them for normalization 26 or phenotypic profiling.17,27 However, the power of HCA to extract quantitative parameters that capture this cellular heterogeneity has not been exploited in depth. We have developed fuzzy logic–based metrics that attribute a score to each cell to evaluate its biological status, allowing us to monitor relevant biological parameters at the single cell level. Cell biology evaluators can be designed specifically to evaluate cellular characteristics related to the assay, ensuring that they are not part of the experimental results, as shown here in the case of the spreading evaluation metric. Cell spreading is related to the cell’s ability to adapt to the surrounding adhesiveness by dynamically reorganizing its shape, plasma membrane, and the underlying cytoskeleton. Accordingly, the use of this metric yielded significant improvement in the assays tested. Other metrics can be implemented using the method we introduced in this article based on the annotation of a cell biology expert to extract characteristics related to cell cycle, differentiation, apoptotic status, and so on, which could be relevant for other assays. Cell evaluators can be designed to recognize specific phenotypes present in the cellular population, as was the case for the PC3 phenotype evaluator. We show data demonstrating that stratification based on this metric yielded subtle variations in the hit list. While some hits were common for quartiles one, two, and three, many were specific for each one, which can be explained by the finding of specific hits related to different PC3 subtypes predominant in each quartile. Thus, to enhance robustness and improve hit identification, special emphasis should be made on the correct choice of metrics tailored for the specific assay. In this regard, we used QDD calculation as a means to estimate the relevance of each metric for each particular assay. Nevertheless, other metrics such as confluency can be used as general cell status evaluators, since this context-based cellular characteristic affects many aspects of cellular response to stimuli and perturbations. Thus, general cell status evaluators could be useful in different assays, independently of their readout. We believe that biological input from expert cell biologists is key in the implementation of cell evaluation metrics.
Fuzzy theory extends the potential of classic probability theory to attribute a degree of membership to a given set referred to as a “fuzzy set” and has been proven very useful for categorizing complex features difficult to represent by single parameters. 28 The fuzzy metrics presented here effectively translated biological knowledge into quantitative values that could be incorporated in data exploration strategies to improve assay robustness. The accuracy obtained using spreading fuzzy metric clearly exceeded that of the linear mapping, demonstrating the advantage of using fuzzy logic to obtain quantitative measures of complex cell features. By grouping the cell population into homogeneous sets according to their cell biology evaluator values, we intended to use these metrics to dissect the diversity of cell populations and use this information to increase HCS assay robustness. By doing so, we were able to compare cells with similar biological status in terms of confluency, spreading, shape, and so on. This cell biology–based stratification of cell populations allowed us to select those subpopulations with greater separation between the negative and positive controls and a low dynamic range for each control, thereby improving the Z′, KS distance, and SSMD values. We demonstrated the usefulness of cell biology evaluation metrics for improving sensitivity of mono- and multiparametric phenotypic assays, the latter using machine learning–based classification as a readout. A novel supervised learning method, called a voting-based strategy, was implemented that accounted for and incorporated these fuzzy scores in a combined statistical model used for phenotypic class prediction. By using it, we demonstrated that the cell biology metrics can be used on top of cellular phenotypic features to improve the overall classification sensitivity for detection of a specific CSK rearrangement phenotype. However, this method can be applied to any phenotypic screen, provided that cell biology metrics are adapted for the particularities of each cellular assay. The assay can be adapted for the expression of any specific molecule that induces complex phenotypic perturbations in cells to decipher the molecular pathway involved in the acquired phenotype (by siRNA screening) or to identify modulators of this pathway or drugs perturbing this phenotype. Multiparametric cellular phenotyping practice has attracted tremendous interest in the high-content analysis field in recent years, and we hope that the proposed methodology will further improve its performance. We plan to corroborate the proposed workflow in different screens and different machine learning approaches, such as support vector machines and graphical modeling, in the future, which may further enhance LR classification, and also to explore multiclass classification methods for detecting phenotypic changes of greater complexity.
Footnotes
Acknowledgements
We thank Johannes Zimmermann, Günter Schmidt, Stuart Pocock and Fátima Sánchez Cabo for fruitful discussions; Raquel Nieto, Mariano Vitón Viana, José Manuel Ligos, and María Montserrat Arroyo for excellent technical assistance; and Simon Bartlett for critical review of manuscript.
Declaration of Conflicting Interests
The authors declared no potential conflicts of interest with respect to the research, authorship, and/or publication of this article.
Funding
The authors disclosed receipt of the following financial support for the research, authorship, and/or publication of this article: This work was supported by Fondo de Investigaciones Sanitarias PS09/01028 to María C. Montoya. Miguel A. del Pozo is supported by the Ministry of Economy and Competitiveness grants SAF2011-25047 and CSD 2009-00016. José R. Dorronsoro received partial support from the MINECO grant TIN2010-21575-C02-01 and from the UAM-ADIC Chair for Machine Learning. Carlos Alaíz is supported by the FPU-MEC grant AP2008-00167. Alberto Torres is supported by an FPU grant of the Universidad Autónoma de Madrid FPU12/05163. The Centro Nacional de Investigaciones Cardiovasculares is supported by the MINECO and the Pro-CNIC Foundation.
References
Supplementary Material
Please find the following supplemental material available below.
For Open Access articles published under a Creative Commons License, all supplemental material carries the same license as the article it is associated with.
For non-Open Access articles published, all supplemental material carries a non-exclusive license, and permission requests for re-use of supplemental material or any part of supplemental material shall be sent directly to the copyright owner as specified in the copyright notice associated with the article.