
Abstract
The Bliss independence model is widely used to analyze drug combination data when screening for candidate drug combinations. The method compares the observed combination response (YO) with the predicted combination response (YP), which was obtained based on the assumption that there is no effect from drug-drug interactions. Typically, the combination effect is declared synergistic if YO is greater than YP. However, this method lacks statistical rigor because it does not take into account the variability of the response measures and can frequently cause false-positive claims. In this article, we introduce a two-stage response surface model to describe the drug interaction across all dose combinations tested. This new method enables robust statistical testing for synergism at any dose combination, thus reducing the risk of false positives. The use of the method is illustrated through an application describing statistically significant “synergy regions” for candidate drug combinations targeting epidermal growth factor receptor and the insulin-like growth factor 1 receptor.
Introduction
Various oncogenic cell signaling pathways are known to provide cross-talk and redundancy within tumors. 1 Thus, inhibition of such pathways individually by a single targeted therapy has been shown to lead to compensation by other pathways. This, in turn, results in a loss of sensitivity to the original targeted therapeutic agent at the cellular level. In the clinic, this type of compensation leads to innate and/or acquired tumor resistance and relapse.
Because advanced tumors are often resistant to single agents, there is an increasing trend to combine drugs to achieve better treatment effect and reduce safety issues.2,3 It is desirable that the combination drugs are synergistic; that is, better activity is achieved at lower dose levels when drugs are combined than individually observed at single drug doses. Depending on drug doses, drug combinations can yield activity that is synergistic, independent, or antagonistic.
Commonly used statistical models to evaluate drug combination efficacy are the Bliss independence and Loewe additivity models. Greco et al. 4 have discussed these two reference models in detail. Conceptually, the Loewe additivity model focuses on dose reduction and the Bliss independence model focuses on treatment effect enhancement. The two reference models handle the same question from two different perspectives. The Bliss independence model has been criticized for its potential to incorrectly claim synergy when two identical drugs are combined (i.e., the “sham” experiment). But in reality, ethical and economic constraints preclude “sham” testing of a combination of two identical drugs to evaluate synergy in a clinical setting. Furthermore, we find that Bliss independence is legitimately derived from the complete additivity of probability theory 5 and serves well as a reasonable reference model.
Suppose two drugs, A and B, both inhibit tumor growth: drug A at dose a inhibits Ya percent of tumor growth and drug B at dose b inhibits Yb percent of tumor growth. If two drugs work independently, the combined percentage inhibition Yab,P can be predicted using the complete additivity of probability theory as

The observed combined percentage inhibition Yab,O is then compared with Yab,P. Typically, if Yab,O > Yab,P, the combination treatment is thought to be more efficacious than expected; if Yab,O < Yab,P, the combination treatment is worse than expected; and if Yab,O =Yab,P, the combination is equal to a simple addition of two separate drugs. More concisely, the three scenarios are summarized as
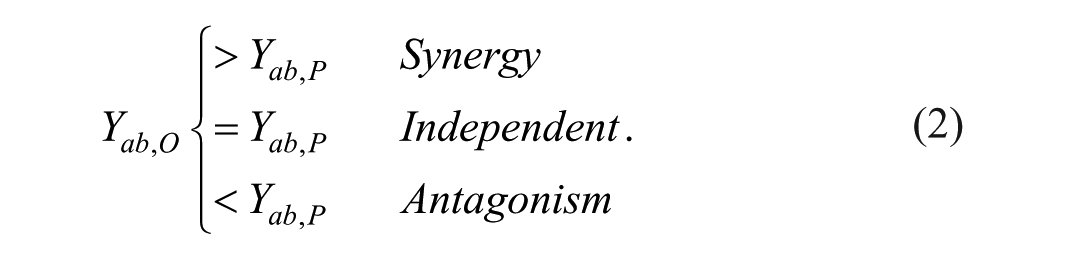
Typically, the comparison is examined at each dose combination. Average percentage inhibition is usually used when replicates are available and a conclusion can be drawn by strictly following equations (1) and (2). But performing tests repetitively at all combination doses becomes a multiple testing problem, which easily leads to false-positive claims.
Response surface methodology (RSM) is a well-established method to explore relationships between dose combinations and treatment effect in combination studies. Recently, a Loewe additivity–based two-stage response surface model for a drug interaction index was developed. 6 The method gives a global view of synergistic effects across all drug combinations. However, we find in practice that the Loewe additivity–based models work well only when monotherapy dose-response curves are well characterized through parametric models such as four-parameter logistic (4PL) nonlinear regression curves. When dose-response curves are nonstandard or not available, we find that the Bliss independence–based model provides a viable alternative. This is particularly important in high-throughput screening settings where large dose ranges are less practical. Even when large dose ranges are feasible for combination screening, nonstandard response curves compromise the reliability of the Loewe additivity model. In the following section, we adopt the two-stage framework to develop a response surface model based on Bliss independence.
Methods
We use a response surface model

where ε is a random error that is normally distributed with mean 0 and variance

If I is known, Г can be easily solved using the multiple linear regression method. Moving

Since
First Stage Model of the Predicted Percentage Inhibition
We estimate the predicted percentage inhibition,

where µ
i
(i = a, b) is the true percentage inhibition for drug A and B at dose (a, b) and ei is a normally distributed random error with mean 0 and variance

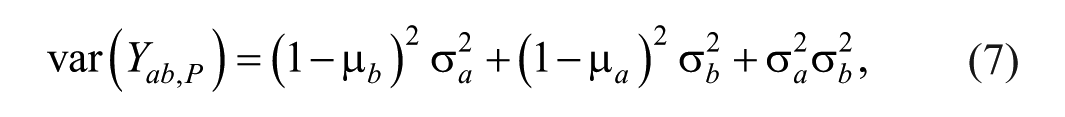
Since the expectations of all the terms with random errors are zero, the expectation of Yab,P can be written as

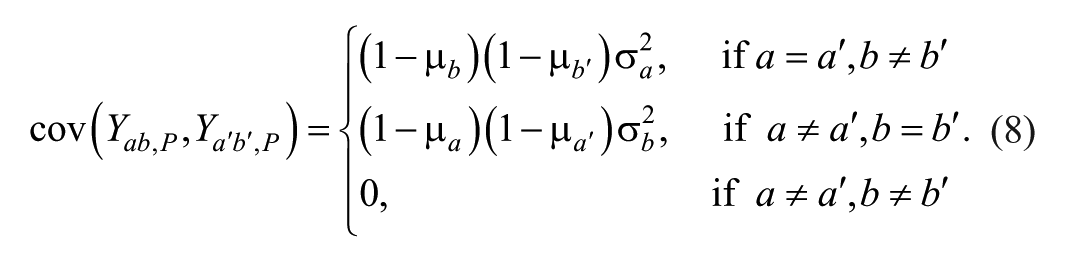
and the variance of Yab,P and covariance between two combination doses, ab and
Second Stage Model to Calculate Parameter Variance
Conditional on the predicted percentage inhibition
Following the two-stage paradigm,
6
the estimated variance covariance matrix of model parameters
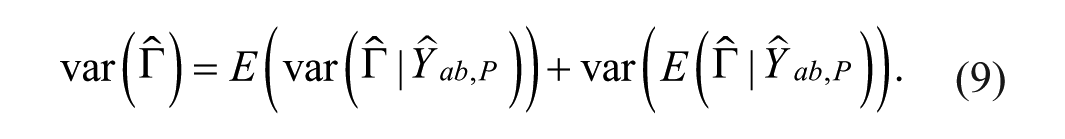
The first term on the right-hand side of equation (9) is the mean variance of
where
Results
Data for combinations studies reported here arise from in vitro combination experiments testing antibodies against two well-characterized and clinically validated oncology targets: the epidermal growth factor receptor (EGFR) and the insulin-like growth factor 1 receptor (IGF1R). Each of these targets has been shown to play a role in tumor biology. 8 Both are frequently coexpressed in tumor cells 9 and have been shown to be a part of the same cellular complexes using coimmunoprecipitation experiments. 10 Furthermore, cross-talk between the IGF1R and EGFR receptor has been shown to result in compensation and resistance during targeted inhibition of either receptor. 11 Finally, various preclinical studies have shown improved activity when both IGF1R and EGFR are inhibited concomitantly.12,13
Given that anti-IGF1R and anti-EGFR antibodies have shown toxicity clinically, it is important to study the combined effects of anti-IGF1R and anti-EGFR treatment quantitatively. Of particular interest is the hypothesis that subtoxic doses of each agent might yield efficacy comparable to that seen with toxic doses separately because of synergism when tested in combination. These data are evaluated using the proposed model with a view toward predicting superior efficacy in combination than that observed when the same antibodies are dosed separately.
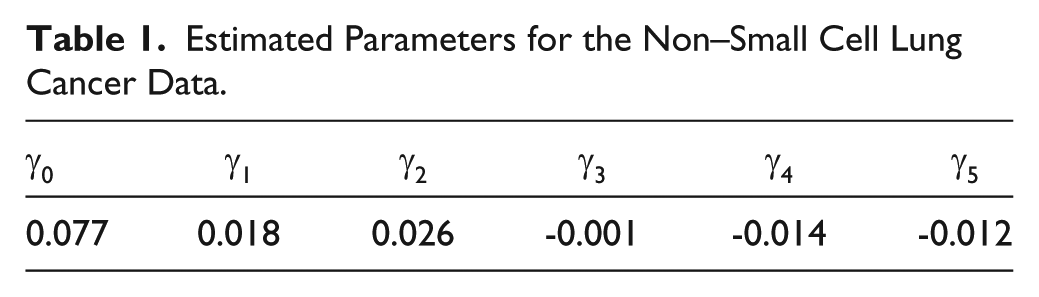
In this experiment, both antibodies were tested at four doses (0.5, 5, 50, and 500 nM) in quadruplicate. Including monotherapy data, there are 96 data points in total. Figure 1 clearly shows that drug A does not follow a classic 4PL dose-response curve, which precludes the use of Loewe additivity–based models. Table 1 gives the estimated parameters of the response surface model. The 95% lower bound of the estimated interaction index is shown in Figure 2 , and the contour plot with log10-transformed doses is shown in Figure 3 . Strong synergistic interaction is seen at lower doses of both antibodies. Subsequent animal studies using the same antibodies in a xenograft model revealed synergistic activity arising from this target combination. 14
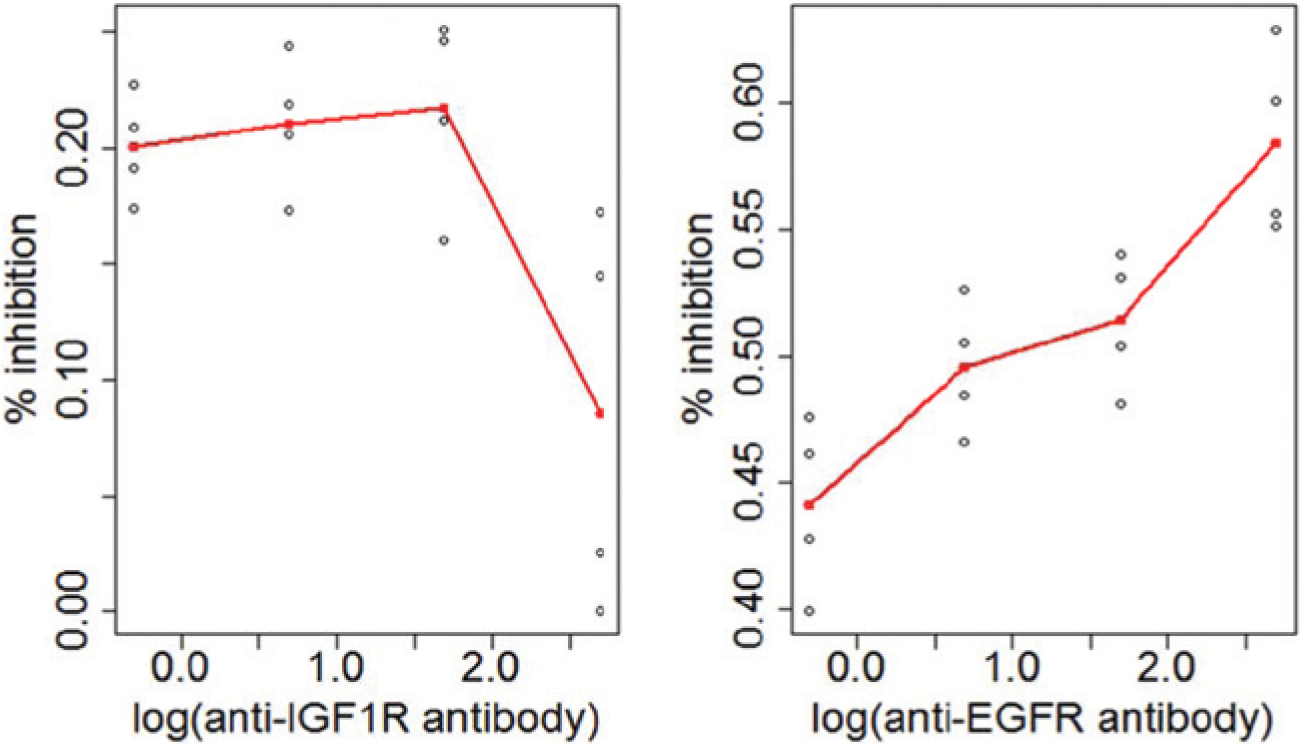
Monotherapy dose-response curves for the anti–insulin-like growth factor 1 receptor (IGF1R) antibody and anti–epidermal growth factor receptor (EGFR) antibody for the non–small cell lung cancer (NSCLC) data.
Estimated Parameters for the Non–Small Cell Lung Cancer Data.
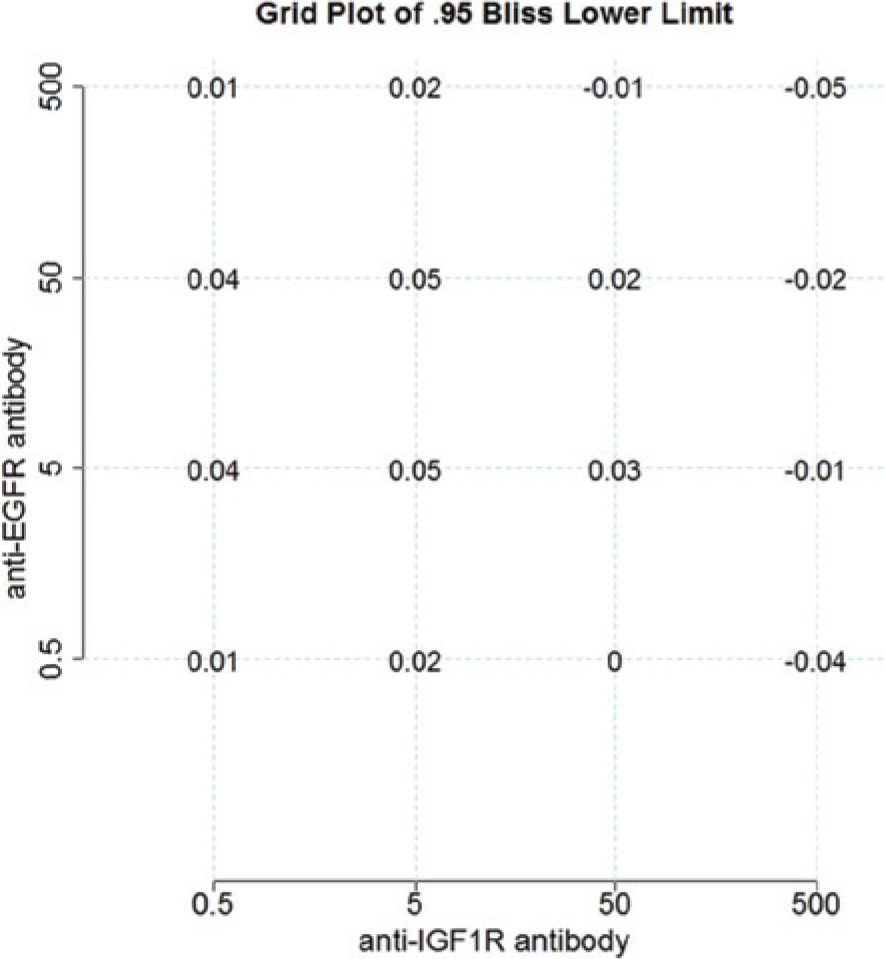
Estimated 95% lower confidence bound of interaction index based on Bliss Independence at all dose combinations. EGFR, epidermal growth factor receptor; IGF1R, insulin-like growth factor 1 receptor.
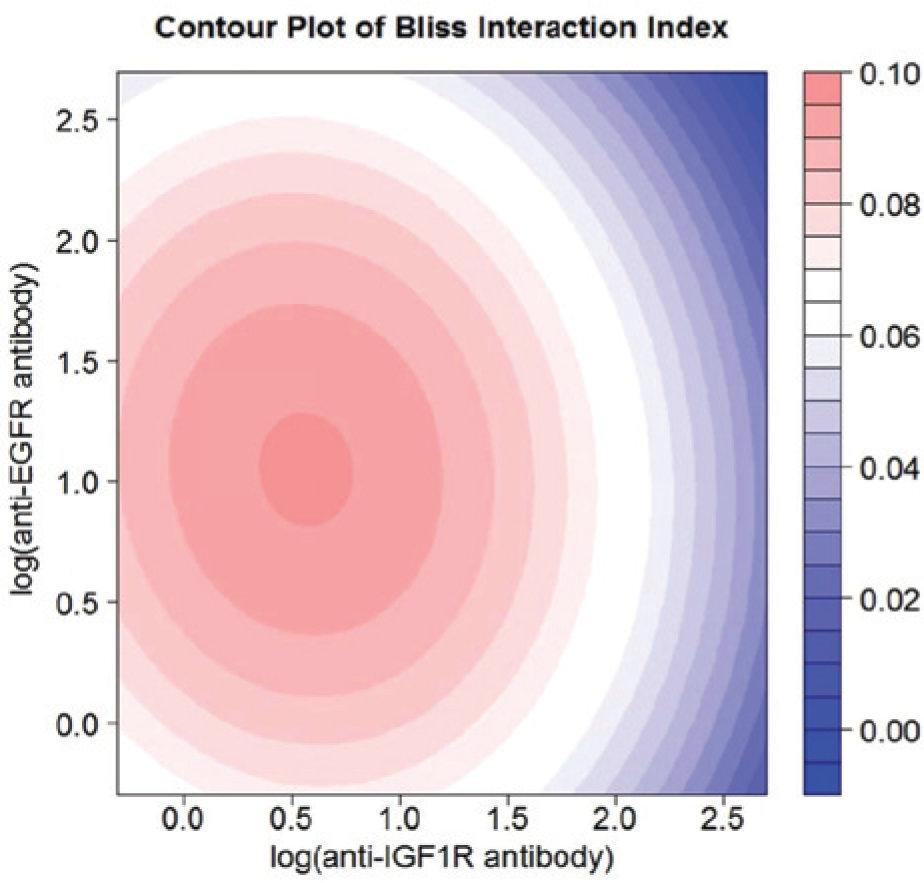
Contour plot of interaction index for the anti–insulin-like growth factor 1 receptor (IGF1R) antibody and anti–epidermal growth factor receptor (EGFR) antibody combination for the non–small cell lung cancer (NSCLC) data.
Discussion
The Bliss independence–based model has fewer restrictions than Loewe additivity–based models. First, Loewe additivity models rely on accurately estimated dose-response curves to support the calculation of the effective dose for a given response. When a 4PL model is used for estimating a dose response, it is mandatory that the response has to fall between the estimated Emin and Emax parameters—a result that is often not possible. When the data point is not between Emin and Emax, it has to be manually removed from the analysis, which is undesirable for statistical analysis. Second, the Loewe additivity model becomes unusable when a dose-response curve is not available or difficult to model. Third, the Loewe additivity model is far more computationally challenging than the Bliss independence model. When both methods have solutions, their results are very similar (comparisons not shown). The Bliss independence model presented in this article requires only a linear model technique, which is readily available in most software.
Screening for effective combination drugs among hundreds of possible candidates is a challenging task. Those analytical methods without proper statistical modeling can easily lead to false decisions. The methodology introduced in this article rigorously considers the variances in both monotherapy and combination drug experiments and provides a practical way to integrate those variances into one comprehensive model. The confidence intervals constructed using this method have successfully helped us to identify synergistic regions of the test antibodies. Finally, it should be emphasized that most other methods provide only a simple score to quantify synergism. In contrast, the method reported here provides both a synergy score as well as a statistical confidence interval to qualify that synergy score.
The analysis was conducted using Windows R 2.14.1. Code is available upon request.
Footnotes
Acknowledgements
We thank David Stewart, Rachael Martin, and Rachael Eastwood in the informatics group for independently validating the program and developing a user friendly interface for internal use.
Declaration of Conflicting Interests
The authors declared no potential conflicts of interest with respect to the research, authorship, and/or publication of this article.
Funding
The authors received no financial support for the research, authorship, and/or publication of this article.