
Abstract
Spheroids of cancer cells represent a physiologic model of solid tumors for cancer drug screening. Despite this known benefit, difficulties with generating large quantities of uniformly sized spheroids in standard plates, individually addressing spheroids with drug compounds, and quantitatively analyzing responses of cancer cells have hindered the use of spheroids in high-throughput screening applications. Recently, we addressed this challenge by using an aqueous two-phase system technology to generate a spheroid within an aqueous drop immersed in a second, immiscible aqueous phase. Integrating this approach with robotics resulted in convenient formation, maintenance, and drug treatment of spheroids. Here, we demonstrate the feasibility of high-throughput compound screening against colon cancer spheroids using 25 anticancer compounds. Using a strictly standardized mean difference and based on a preliminary testing with each compound, we select effective compounds for further dose-response testing. Finally, we use molecular inhibitors to target upregulated protein kinases and use them for drug combination studies against spheroids. We quantitatively analyze the combination treatment results using statistical metrics to identify synergy between pairs of inhibitors in compromising viability of colon cancer cells. This study demonstrates the utility of our spheroid culture technology for identification of effective drug compounds, dose-response analysis, and combination drug treatments.
Introduction
Preclinical evaluation of drug candidates is a critical stage in the anticancer drug discovery pipeline. Cell cultures introduced in 1950s have remained an integral part of the drug discovery process for initial characterization of efficacy and toxicity of compounds in the preclinical stage prior to use in animal models. 1 Despite the ease of culture and maintenance of monolayers of cancer cells often used in drug discovery applications, they often fail to correctly predict the performance of compounds in subsequent animal tests, causing tremendous inefficiencies and increased costs. Structural, biological, and functional differences between cells residing in a homogeneous 2D environment of monolayer cultures and the complex 3D tumors are considered major shortcomings of 2D cultures. 2 Incorporation of physiologically relevant in vitro models of human tumors in drug development and discovery will help improve the identification of effective compounds prior to tests with animal models. 3
Spheroids of cancer cells are 3D compact clusters that resemble solid tumors in terms of close cell-cell contacts, cell-matrix interactions, diffusion limitations of oxygen and nutrients to cells, resulting in populations of proliferative, quiescent, and necrotic cells, hypoxia, and limitations of drug diffusion to cancer cells.3,4 Spheroids embedded in an extracellular matrix and co-culture spheroids of cancer and stromal cells allow creating models of greater complexities to understand how tumor stroma regulates functions of cancer cells. 5 As such, spheroids provide relevant tumor models to expedite oncology drug discovery. 6 Despite the increased momentum in the use of spheroids in cancer research, their utility in drug testing and screening applications at industrial scales has been hampered by the difficulty of mass production of homogeneously sized spheroids, convenient maintenance of spheroids with minimal labor, addressability of individual spheroids with drug compounds for high-throughput screening (HTS) of collections of compounds, and straightforward biochemical analysis of drug responses of cells. Traditional methods such as spinner flask and rotary vessel and more modern approaches, including microfabricated microwell array, hanging drop array, and magnetic levitation, face major challenges with one or more of the above criteria. 3
To address this major need, we recently developed a 3D culture technology using an aqueous two-phase system (ATPS) that uses highly aqueous solutions of two biocompatible polymers, polyethylene glycol (PEG) and dextran (DEX), to generate two stably segregated aqueous phases. Immiscibility of the solutions at low polymer concentrations allows confining cancer cells in a drop of the aqueous DEX phase immersed in a bath of the aqueous PEG phase, while an ultralow interfacial tension between the two aqueous solutions enables effective partition of cancer cells to the DEX phase and leads to spontaneous formation of a fully viable spheroid.7–9 We adapted this technology to robotic liquid handling to facilitate mass production of spheroids and high-throughput drug testing with minimal labor. 10 Due to the compatibility of this technology with standard off-the-shelf 384-microwell plates, operations such as drug treatment, drug renewal, addition of reagents for evaluation of cell viability, and analysis of cellular responses to drug treatment using fluorescence or absorbance modes of microplate readers are all done in situ (in the same plate that spheroids reside) and robotically to significantly expedite the workflow and substantially reduce labor. Thus, this technology can potentially address an existing need for convenient and user-friendly tumor models in drug discovery.
To demonstrate high-throughput robotic screening capabilities with ATPS tumor spheroids, we conducted both single-agent and combination drug treatments and applied statistical techniques and parametric analyses to quantitatively determine the effectiveness of compounds. First, we performed a preliminary screening of 25 anticancer compounds against HT-29 colon cancer spheroids at a single concentration of each compound and used a statistical metric, strictly standardized mean difference (SSMD), to identify effective drugs for the subsequent dose-response analysis. Next, we conducted dose-dependent screening with the resulting 14 compounds and used an area under the dose-response curve (AUC) metric to account for both potency and efficacy of compounds against HT-29 spheroids and rank them. Finally, we performed a combination treatment study using specific inhibitors targeting known mutations in colon cancer cells. Analysis of dose-response experiments using AUC and a quantitative metric known as combination index (CI) allowed us to determine synergistic effects of co-targeting of two survival pathways on enhancing the response of cancer cells to the molecular inhibitors. Altogether, these studies validate the utility of ATPS tumor spheroids for single and combination drug testing and screening applications using standard robotic tools and consumables and with minimal labor. Incorporating this technology in the mainstream drug development pipeline will significantly accelerate identification of effective compounds for animal tests and potentially improve the success rates of these studies.
Materials and Methods
Cell Culture
We used McCoy’s 5A medium to culture HT-29 colon cancer cells (ATCC, Manassas, VA). The medium was supplemented with 10% fetal bovine serum (FBS; Sigma, St. Louis, MO), 1% antibiotic (Life Technologies, Grand Island, NY), and 1% glutamine (Life Technologies). Cells were cultured in a humidified incubator at 37 °C and 5% CO2. Cells were dissociated using 0.25% trypsin (Life Technologies) from 80% to 90% confluent monolayer cultures in tissue culture flasks. Trypsin was neutralized using the complete growth medium. The cell suspension was centrifuged down at 1000 rpm for 5 min, and after removing the supernatant, cells were suspended in 1 mL of culture medium and counted using a hemocytometer prior to spheroid formation.
Spheroid Formation Using ATPS
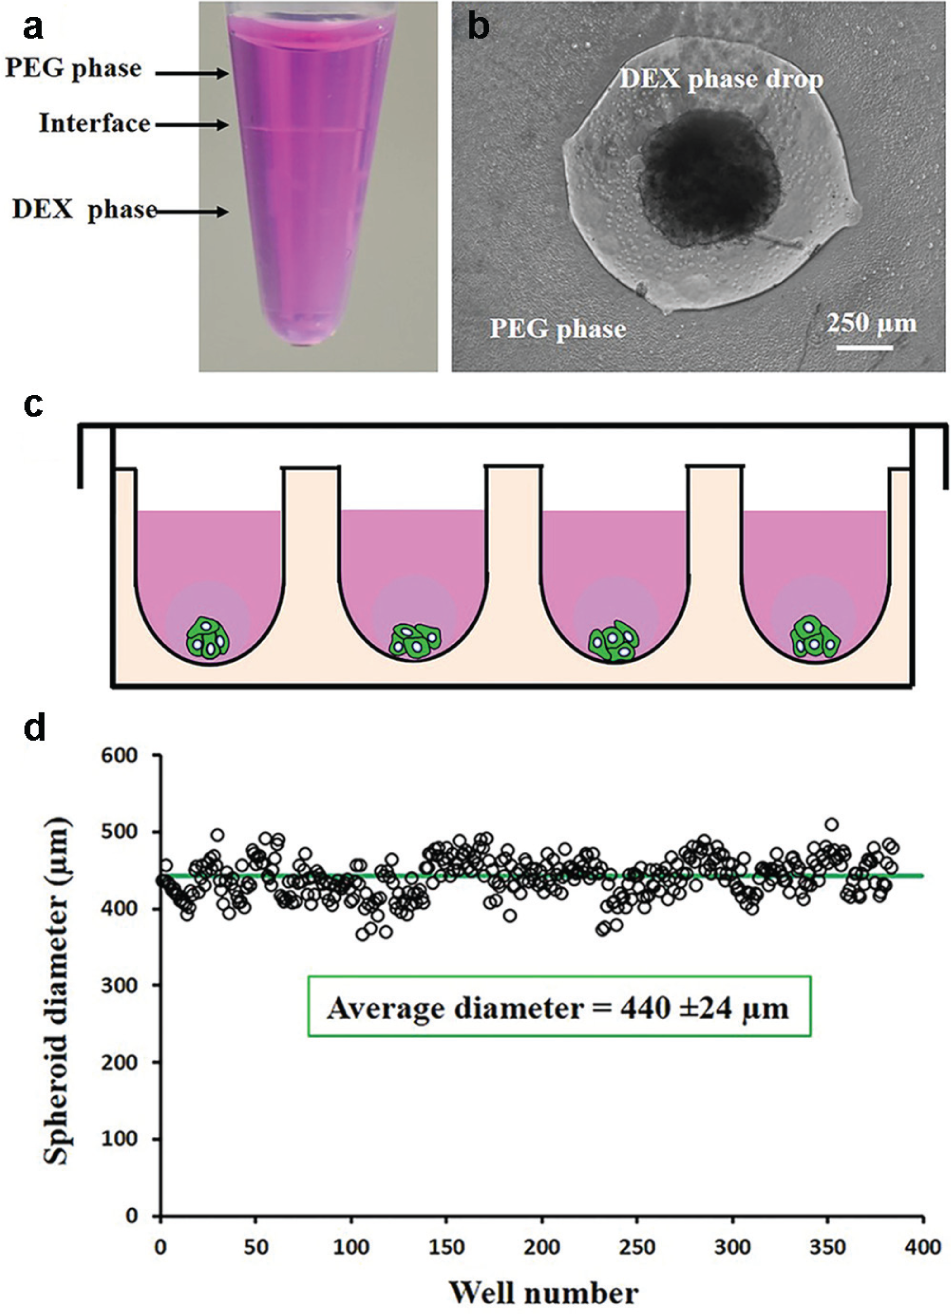
Bio-ultra PEG (Sigma; molecular weight: 35,000 Da) and DEX (Pharmacosmos, Holbaek, Denmark; molecular weight: 500,000 Da) were dissolved in the complete growth medium to obtain final stock solution concentrations of 5% (w/v) PEG and 12.8% (w/v) DEX. A standard 384-well round-bottom ultralow attachment plate (Corning, Corning, NY) was used was a “destination plate.” Each well of this plate was loaded with 30 µL of the aqueous PEG phase medium. A suspension of 1 × 10⁷ cells/mL was prepared, and 100 µL of the suspension was thoroughly mixed with 100 µL of the 12.8% (w/v) aqueous DEX phase medium. This reduced the concentration of the DEX polymer to 6.4% (w/v) and adjusted the density of cells to 5 × 10⁶ cells/mL. Each well from one column of a flat-bottom 384-well plate (Corning), which was used as a “source plate,” was filled with 25 µL of the resulting cell suspension in the DEX phase. A robotic liquid handler (Bravo SRT; Agilent Technologies, Santa Clara, CA) was used to aspirate 0.3 µL of the suspension containing 1.5 × 10⁴ cells from each well and dispense it into each well of the destination plate containing the aqueous PEG phase. This aspiration and dispensing process was done column by column. Uniformity of the high-density cell suspension in the source plate was maintained by robotically mixing the content of wells prior to each aspiration step. This protocol generated a discrete DEX phase drop containing cancer cells within the immersion PEG phase in each well. The ultralow interfacial tension between the two aqueous phases causes cells to remain partitioned within the DEX phase drop. 7 During incubation and due to close cell-cell interactions, cells spontaneously aggregate to form a spheroid. This method generates uniformly sized spheroids with less than 8% standard deviation from the mean diameter within a 384-microwell plate. 10
Measurements of Metabolic Activity of Spheroids
Spheroids of HT-29 colon cancer cells were formed in 384-well plates. After 48 h and every other day for a period of 9 days, a PrestoBlue reagent was added to each well at 10% of total well volume. The plate was incubated for 4 h to allow cells metabolize the active component of the reagent and produce a fluorescent compound. The fluorescent signal was measured using a plate reader (Synergy H1M; BioTek Instruments, Winooski, VT) and averaged over seven replicates on each day of measurement.
Anticancer Compound Screening and Selection of Effective Compounds
We performed a preliminary screening of the following 25 compounds against spheroids of HT-29 cells: doxorubicin, paclitaxel, 5-fluorouracil, ponatinib, oxaliplatin, cisplatin, staurosporine, 17-AAG, crizotinib, ribociclib, KX2-391, VER155008, panobinostat, trametinib, selumetinib, PD0325901, GSK1059615, PI-103, dactolisib, pictilisib, YM155, SP600125, LY2784544, tirapazamine, and hyaluronan-resveratrol (H-R). This collection contains standard chemotherapy drugs, molecular inhibitors, and a natural compound. The main target of each compound is shown in
Dose-Dependent Screening of Compounds
Stock solutions of compounds were serially diluted to obtain six different drug concentrations of 2 nM, 20 nM, 200 nM, 2 µM, 20 µM, and 100 µM. From each of these solutions, 30 µL was dispensed into each well of the destination plate containing 30 µL of the PEG phase media. After addition of drug solution, the concentration of polymers was reduced below a threshold concentration necessary for maintaining two separate phases. This resulted in only a single media phase containing trace amounts of polymers. This addition also reduced drug concentrations to 1 nM, 10 nM, 100 nM, 1 µM, 10 µM, and 50 µM. Spheroids were incubated for 72 h. Then, 30 µL of each drug solution at these concentrations was added to the corresponding wells to renew the drugs.
4
Incubation of spheroids continued for another 72 h. The outer wells were filled with sterile water to minimize evaporation and osmolality changes of the culture medium. A total of 14 replicates were used for both control (nontreated) and drug-treated spheroids. Next, PrestoBlue was added to wells, and after 4 h of incubation, the fluorescent signal was measured with a plate reader. The fluorescent intensity of blank wells (containing medium only) was subtracted from the measured signal to eliminate the background noise. It was confirmed that fluorescent properties of certain drugs such as doxorubicin and paclitaxel did not interfere with the fluorescent signal generated by viable cells metabolizing PrestoBlue (
Drug Combination Experiments
Trametinib, selumetinib, and PD0325901 were used in combination with dactolisib in separate experiments. The IC50 value for each drug against HT-29 spheroids was obtained from its respective dose-response curve. Solutions of each drug were prepared at seven different concentrations of multiples (0.125, 0.25, 0.5, 1, 2, 4, 8) of its IC50 by serially diluting the stock solution in the culture medium. Drugs were combined according to a method of fixed concentration ratios. 11 Each combination of concentrations of a pair of drugs used 14 replicates. The calculated AUC from each experiment was used to quantify the effectiveness of combination and single drug treatments. Furthermore, the logarithmic value of a combination index (i.e., log CI) was used to determine synergism between drug combinations.
Statistical Analysis for Selecting Effective Compounds
We used SSMD,
12
a statistical metric to select compounds from our preliminary screening of 25 drug compounds against HT-29 spheroids. SSMD is the ratio of the difference in the mean values from two sets of data to the square root of the sum of squares of the corresponding standard deviations, that is,
Results and Discussion
Generation, Size Consistency, and Metabolic Activities of Spheroids
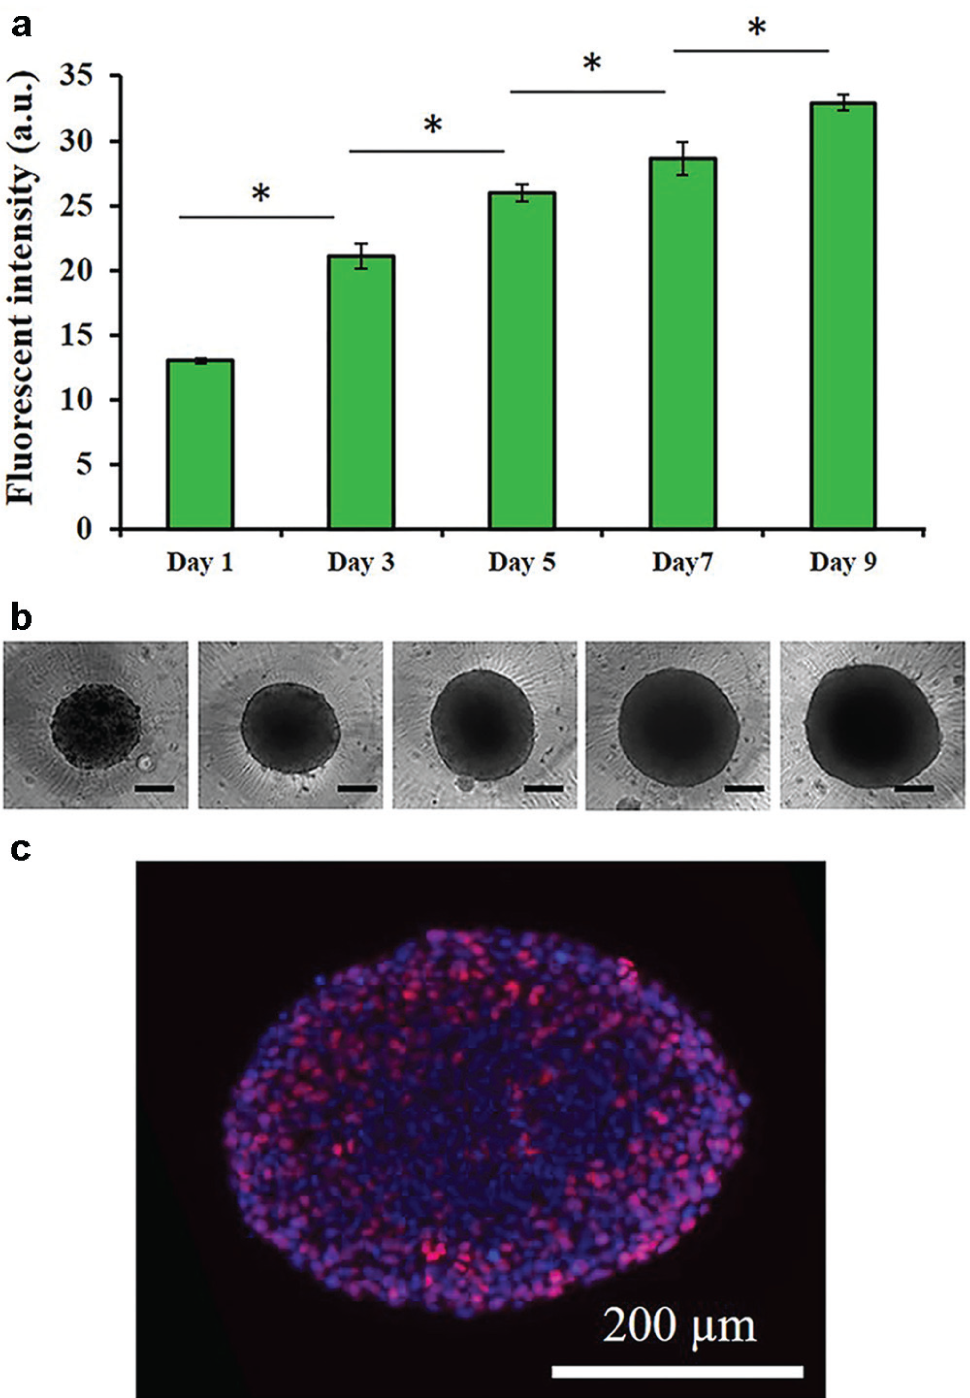
The immiscibility of aqueous PEG and DEX phases ( Fig. 1a ) allowed formation of a stable aqueous drop containing cancer cells that aggregate to form a spheroid within 24 to 48 h of incubation ( Fig. 1b ). Adapting this approach to robotic liquid handling enabled facile and precise microprinting of cell-containing DEX phase drops of 0.3 µL into the immersion PEG phase in standard 384-microwell plates for high-throughput spheroid formation ( Fig. 1c ). With a density of 1.5 × 10⁴ HT-29 cells, this technique produced spheroids with ~5.5% standard deviation from the average diameter ( Fig. 1d ). Spheroids of HT-29 cells showed a continuous increase in cellular metabolic activities ( Fig. 2a ), indicating that cells were proliferative. The measured signal increased by over 2.5-fold during the 9 days of culture. Bidaily measured signal at each time point was significantly greater than each preceding time point (p < 0.05). This was consistent with morphological increases in the size of spheroids from an average diameter of 440 ± 24 µm on day 1 to 681 ± 19 µm on day 9 ( Fig. 2b ). Assuming a spherical shape for spheroids, this translates into a 4.26-fold increase in the volume of the spheroids. Immunohistochemical examination of HT-29 spheroids showed presence of proliferative Ki-67+ cells ( Fig. 2c ), confirming the biochemical and morphological measurements of growth of cancer cells. Ki-67+ cells were nonuniformly distributed at the peripheral regions. Lack of proliferative cells at the core zone is due to limited oxygen and nutrients and reminiscent of solid tumors.
(
(
Screening Experiments to Select Effective Compounds
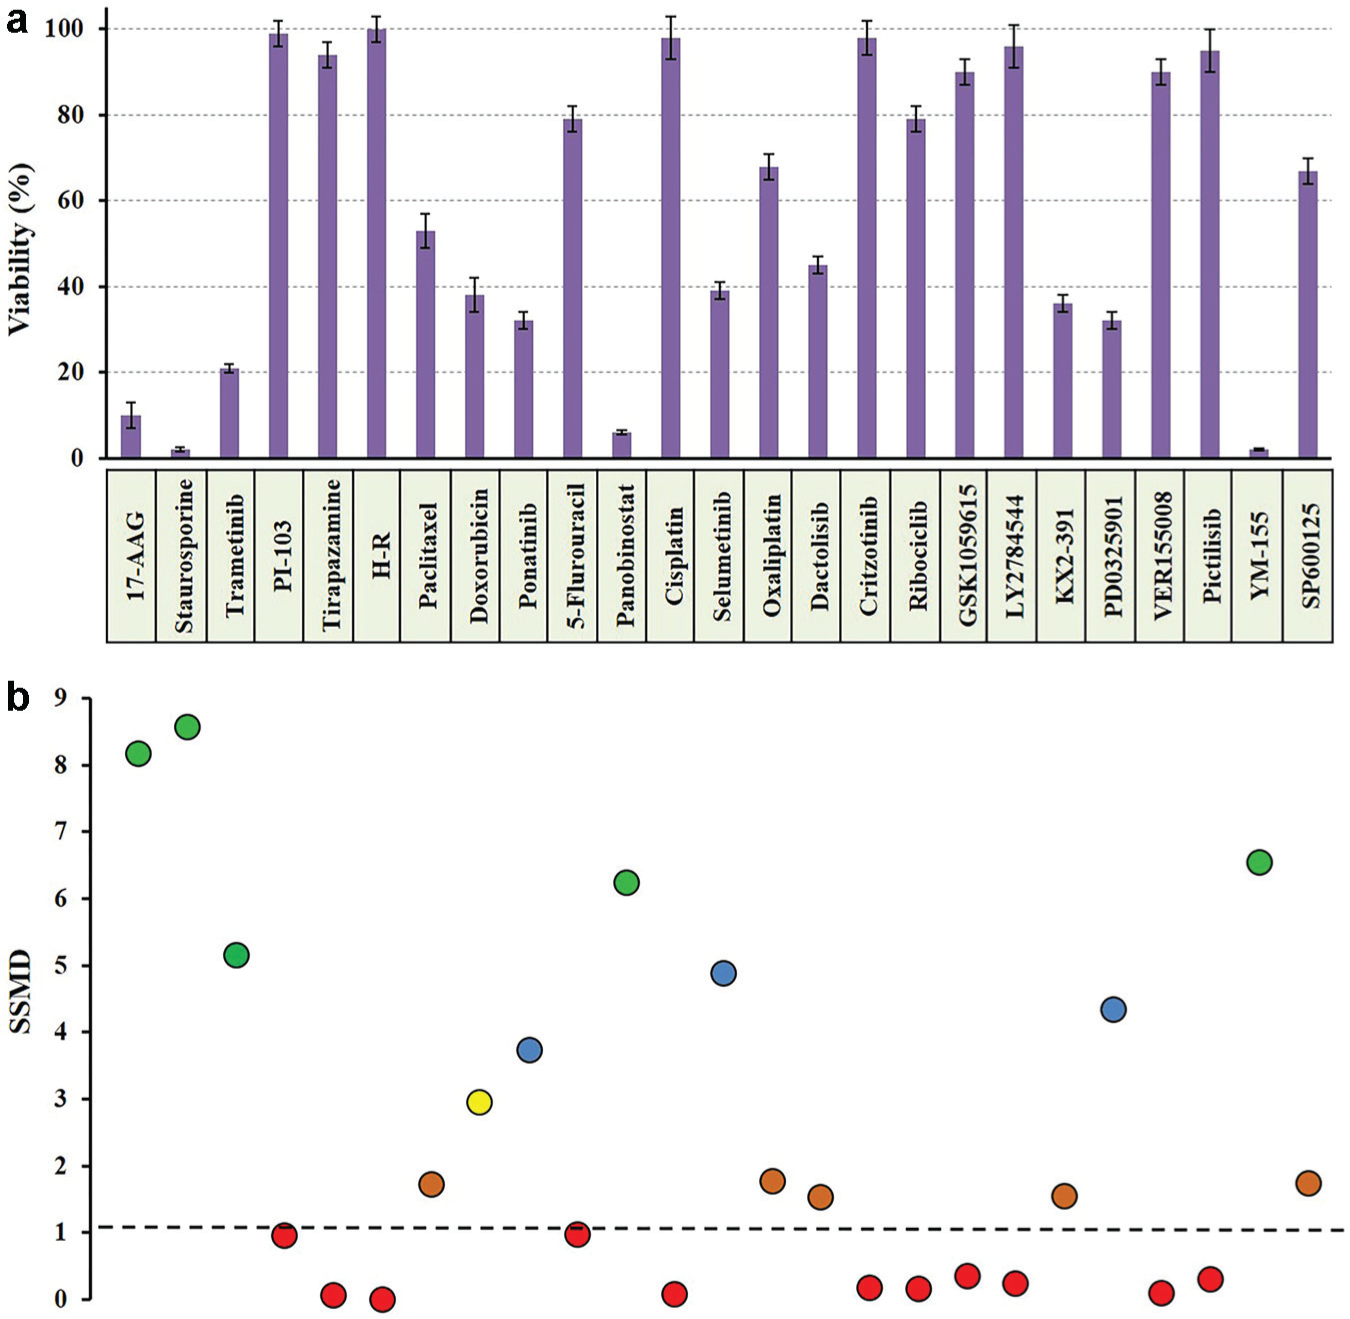
Prior to dose-response drug treatment experiments, we conducted a preliminary screening of 25 anticancer drug compounds at a single 10-µM concentration to identify effective compounds against HT-29 spheroids. The measured viability of HT-29 cells from each treatment is shown in
Figure 3a
. To statistically evaluate the effectiveness of compounds, we calculated SSMD values from each drug treatment (
Fig. 3b
) and ranked them according to
(
Dose Response of HT-29 Spheroids to Drug Compounds
We used the selected 14 compounds for dose-response studies to determine the efficacy and potency of each drug against HT-29 spheroids. Efficacy (Emax) represents the maximum reduction in the viability of spheroids, whereas potency (IC50) gives the concentration that produces half of the maximum reduction in cell viability. Figure 4 shows dose-response graphs of HT-29 spheroids to the drug compounds at a concentration range of 1 nM to 50 µM. All tested compounds showed high efficacy (i.e., large cell death); nevertheless, the concentration required to compromise the viability of cells varied significantly among the drugs. For example, while trametinib at a concentration of 1 nM resulted in ~60% cell death, doxorubicin produced a similar effect at 10 µM of drug concentration. To account for differences in potency and efficacy of different compounds and compare their effectiveness, we computed the AUC from each treatment. Ranking of compounds based on this metric is shown in Figure 5 .
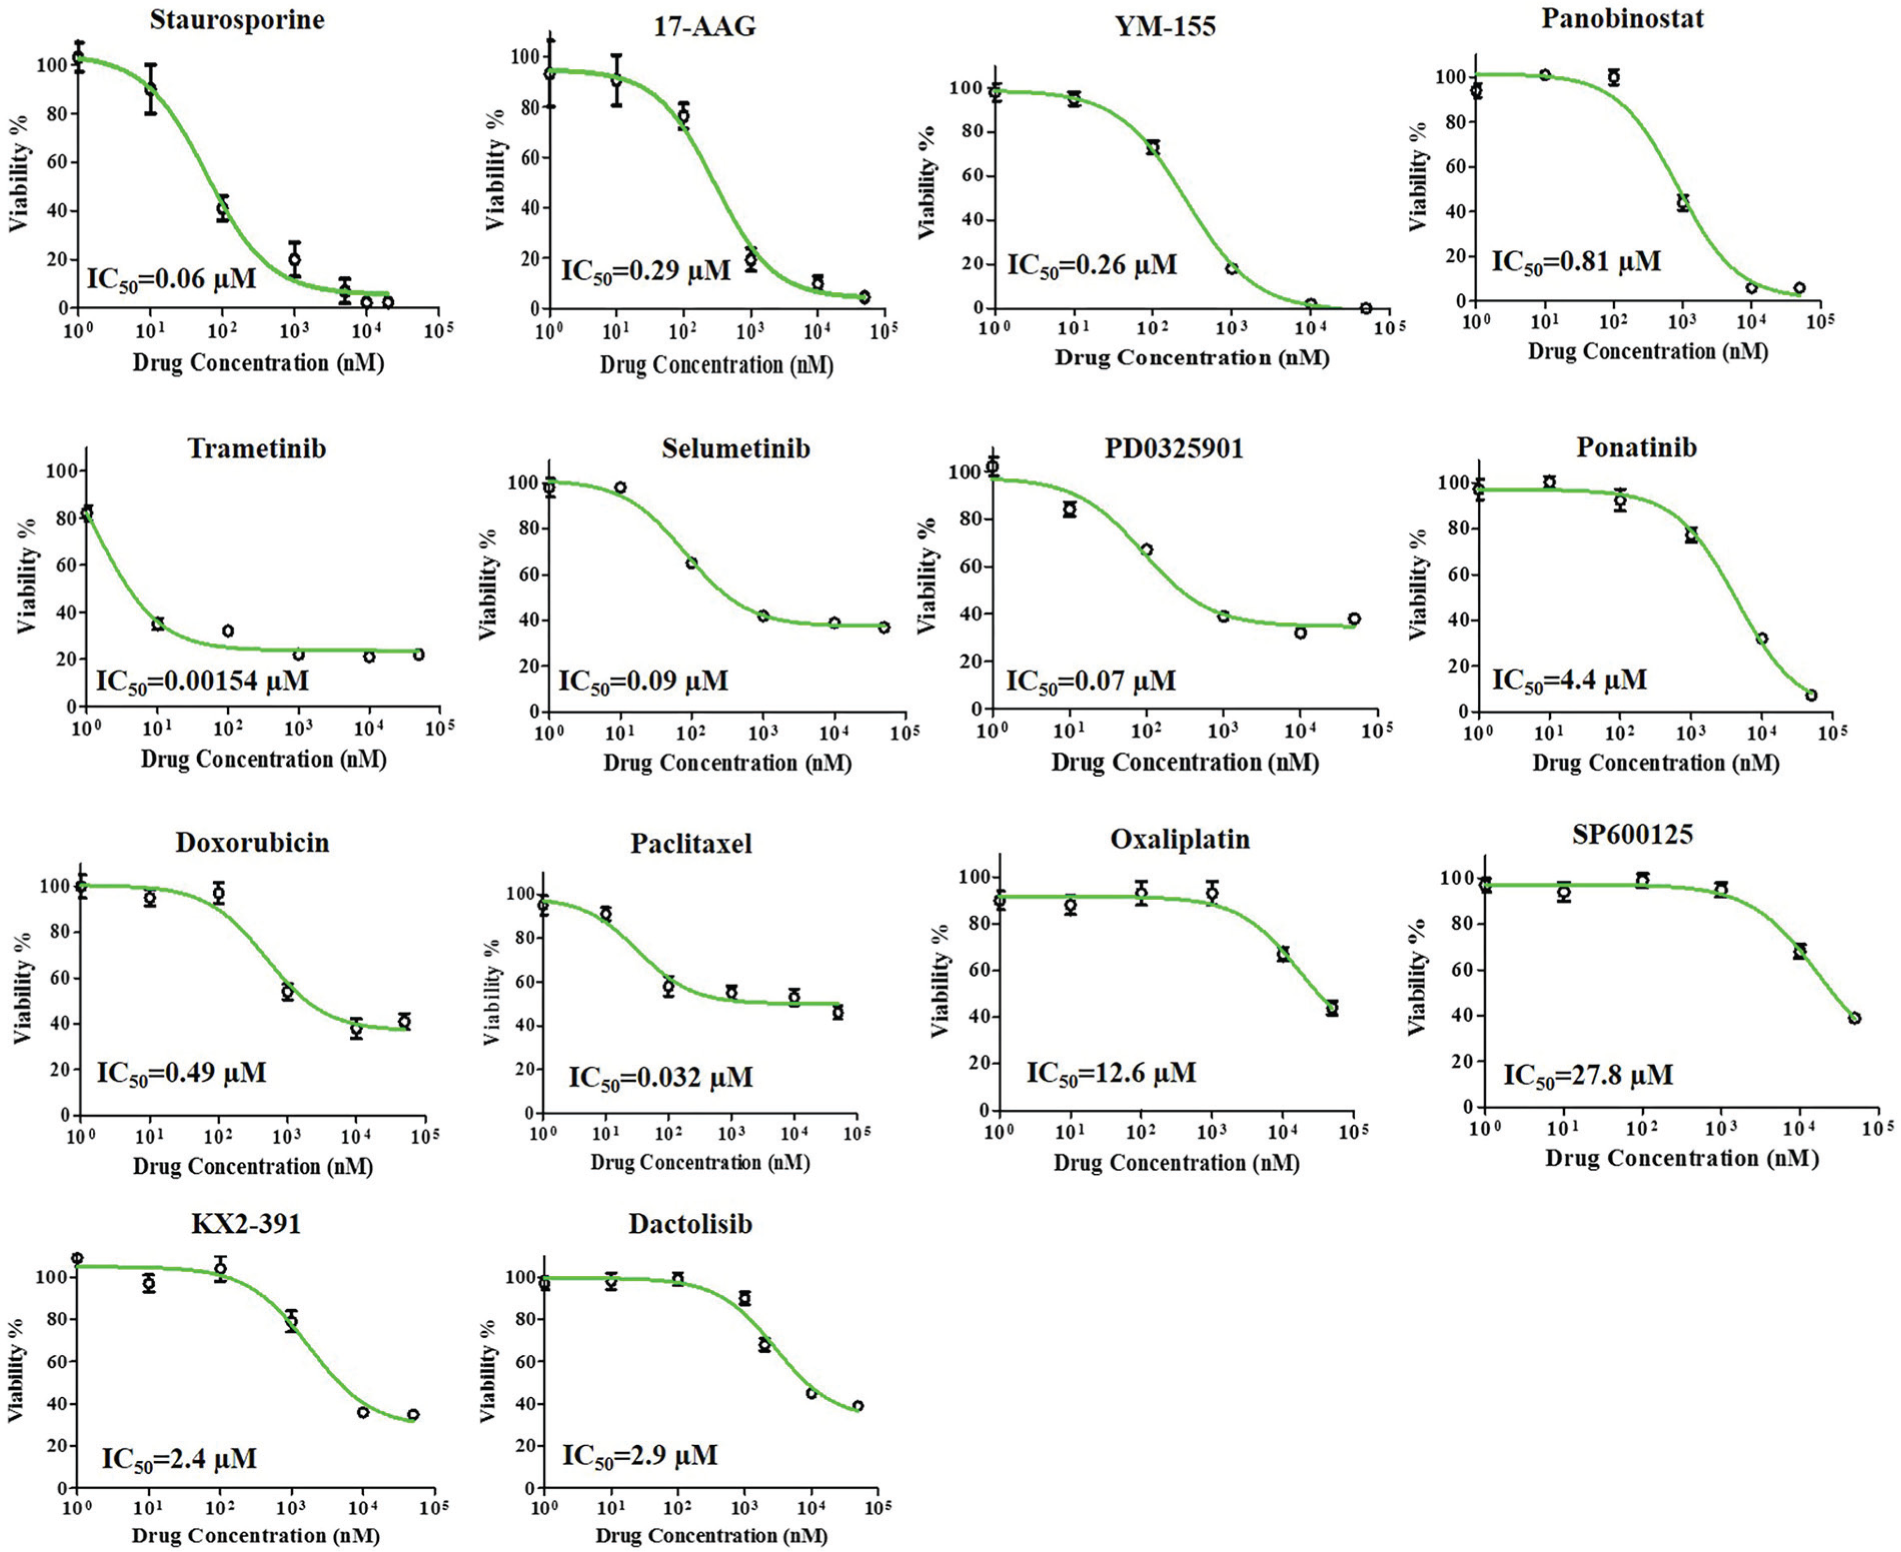
Dose-dependent responses of HT-29 spheroids to 14 anticancer compounds at a concentration range of 1 nM to 50 µM. The IC50 value from each experiment is also shown.
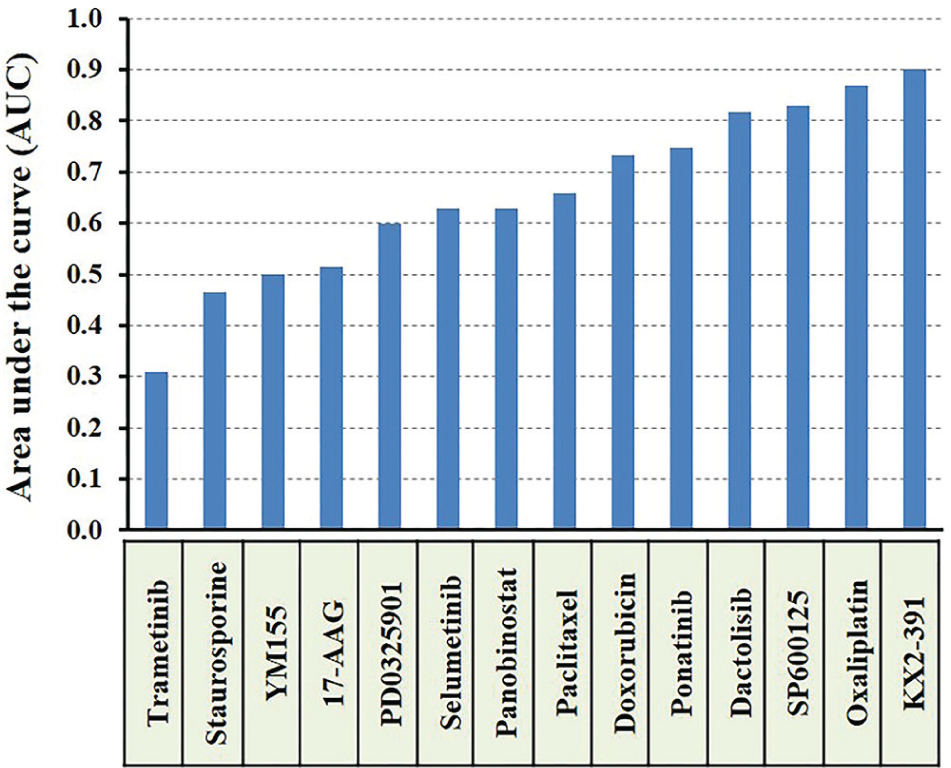
Ranking of effectiveness of 14 anticancer compounds against HT-29 spheroids using area under the dose-response curve (AUC) values computed from corresponding dose-response graphs of Figure 4 .
With an AUC score of 0.31, trametinib (MEK1/2 inhibitor) ranked first. Colorectal cancer cells, including HT-29 cells, often harbor gain-of-function BRAF mutations that lead to transcriptional-level changes, rendering cells highly proliferative.13,14 This explains the effectiveness of trametinib in targeting the deregulated RAS/RAF/MEK/ERK pathway in HT-29 cells. Two other MEK inhibitors, PD0325901 and selumetinib, resulted in AUCs of 0.6 and 0.63, respectively, indicating the importance of inhibiting phosphorylation of signaling proteins in this pathway in HT-29 cells. Staurosporine, a protein kinase C (PKC) inhibitor, ranked second with an AUC of 0.47. Blocking of signaling of PKC to the MEK/ERK pathway is a likely explanation for the effectiveness of this compound against HT-29 cells. 15 YM155 generated an AUC of 0.5 and ranked third. Histone deacetylases (HDACs) regulate the expression and activity of various proteins involved in growth of colon cancer cells, and pharmacological inhibitors of HDAC activity are considered potent inducers of growth arrest and apoptosis. 16 Consistent with this role, panobinostat resulted in an AUC of 0.63 and generated high toxicity at moderate concentrations. Two clinically used standard chemotherapy drugs, paclitaxel (microtubules stabilizer) and doxorubicin (DNA intercalator), ranked next with AUCs of 0.66 and 0.73, producing only moderate toxicities. Although doxorubicin and paclitaxel are often highly potent against 2D cancer cell cultures, various studies show that their effectiveness often reduces in 3D cultures due to several drug resistance mechanisms. These include limited drug penetration into compact spheroids, slower cell cycle, and reduced proliferative activities of cancer cells, especially those residing in the core of spheroids with limited access to nutrients and oxygen and expression of drug efflux pumps to transport the toxins out of cells. 4 The multitargeted tyrosine kinase inhibitor, ponatinib, ranked tenth with an AUC of 0.75, followed by the dual phosphatidylinositol-3-kinase (PI3K)/mammalian target of rapamycin (mTOR) inhibitor dactolisib that generated an AUC of 0.82. The JNK inhibitor SP600125, the platinum-based chemotherapy drug oxaliplatin, and the Src kinase inhibitor KX2-391 resulted in AUC values in the range of 0.83 to 0.90, indicating low toxicity of the compounds to HT-29 spheroids unless used at large micromolar concentrations.
This series of dose-response experiments and quantitative analysis demonstrates the utility of ATPS spheroids for high-throughput anticancer compound screening against cancer cells residing in 3D cultures. Importantly, the spheroid models predict sensitivity of cancer cells to specific molecular inhibitors targeting signaling proteins in the mutated MEK/ERK pathway in HT-29 cells. This capability will allow testing of novel inhibitors against cells of a specific cancer in preclinical drug development to identify effective compounds for subsequent animal studies.
Combination Treatments with Molecular Inhibitors of MAPK and PI3K Pathways
The screening study showed that the MEK inhibitors, especially trametinib, are highly effective against HT-29 spheroids due to targeting of the RAS/RAF/MEK/ERK pathway. Despite promising antitumor activities of inhibitors of this pathway, emerging evidence from animal studies and clinical trials suggests that colon tumors often develop resistance to these inhibitors through activation and compensatory signaling of other kinase pathways, including the PI3K pathway. 17 This is consistent with the prevalent PIK3CA mutation in most colon cancer cells. 13 Therefore, simultaneous targeting of both pathways offers a potential strategy to overcome resistance of colon cancer cells to single-agent therapy with MEK inhibitors. To establish the feasibility of performing combination therapy using ATPS tumor spheroids, we selected the three MEK inhibitors (trametinib, PD0325901, selumetinib) and used them in combination with a dual PI3K/mTOR inhibitor, dactolisib. Our rationale for selecting this compound was that among the four inhibitors of the PI3K pathway used in our preliminary screening, only dactolisib passed the SSMD >1 criterion. In addition, our dose-response experiment with dactolisib generated an AUC value of 0.82, indicating moderate effects of the compound on HT-29 cells.
We determined IC50 values from screening experiments with each compound (shown in Fig. 4 ) and generated seven combination concentrations of each MEK inhibitor and dactolisib at multiples (0.125, 0.25, 0.5, 1, 2, 4, 8) of the ratio of the IC50 values of each pair. In parallel to each combination therapy experiment, spheroids of HT-29 cells were treated with the corresponding MEK inhibitor and dactolisib only (single-agent treatment) at the same concentrations of each compound used for the combination experiment. Figure 6a shows the dose response of HT-29 spheroids to the combination of trametinib and dactolisib and compares it to the treatments with each individual inhibitor. Combination of the MEK1/2 and PI3K/mTOR inhibitors enhanced the response by ~20% compared with the treatments with either compound alone ( Fig. 6a ), consistent with decreased AUC value ( Fig. 6b ). HT-29 spheroids showed greater sensitivity to the combination of PD0325901 and dactolisib ( Fig. 6d ), and cell visibility was reduced by up to 35% at 0.28 µM PD0325901 and 11.6 µM dactolisib. Significantly, the largest pair of concentrations used (i.e., 0.56 µM PD0325901 and 23.2 µM dactolisib) compromised the viability of cells by over 70% compared with single-agent treatment. Using the combination treatment, the AUC decreased to 0.26, that is, over 30% reduction compared with the treatments with each inhibitor alone ( Fig. 6e ). Combining selumetinib and dactolisib enhanced the cellular response by ~15% compared with individual drug treatment and reduced the AUC to 0.45 ( Fig. 6g , h ).
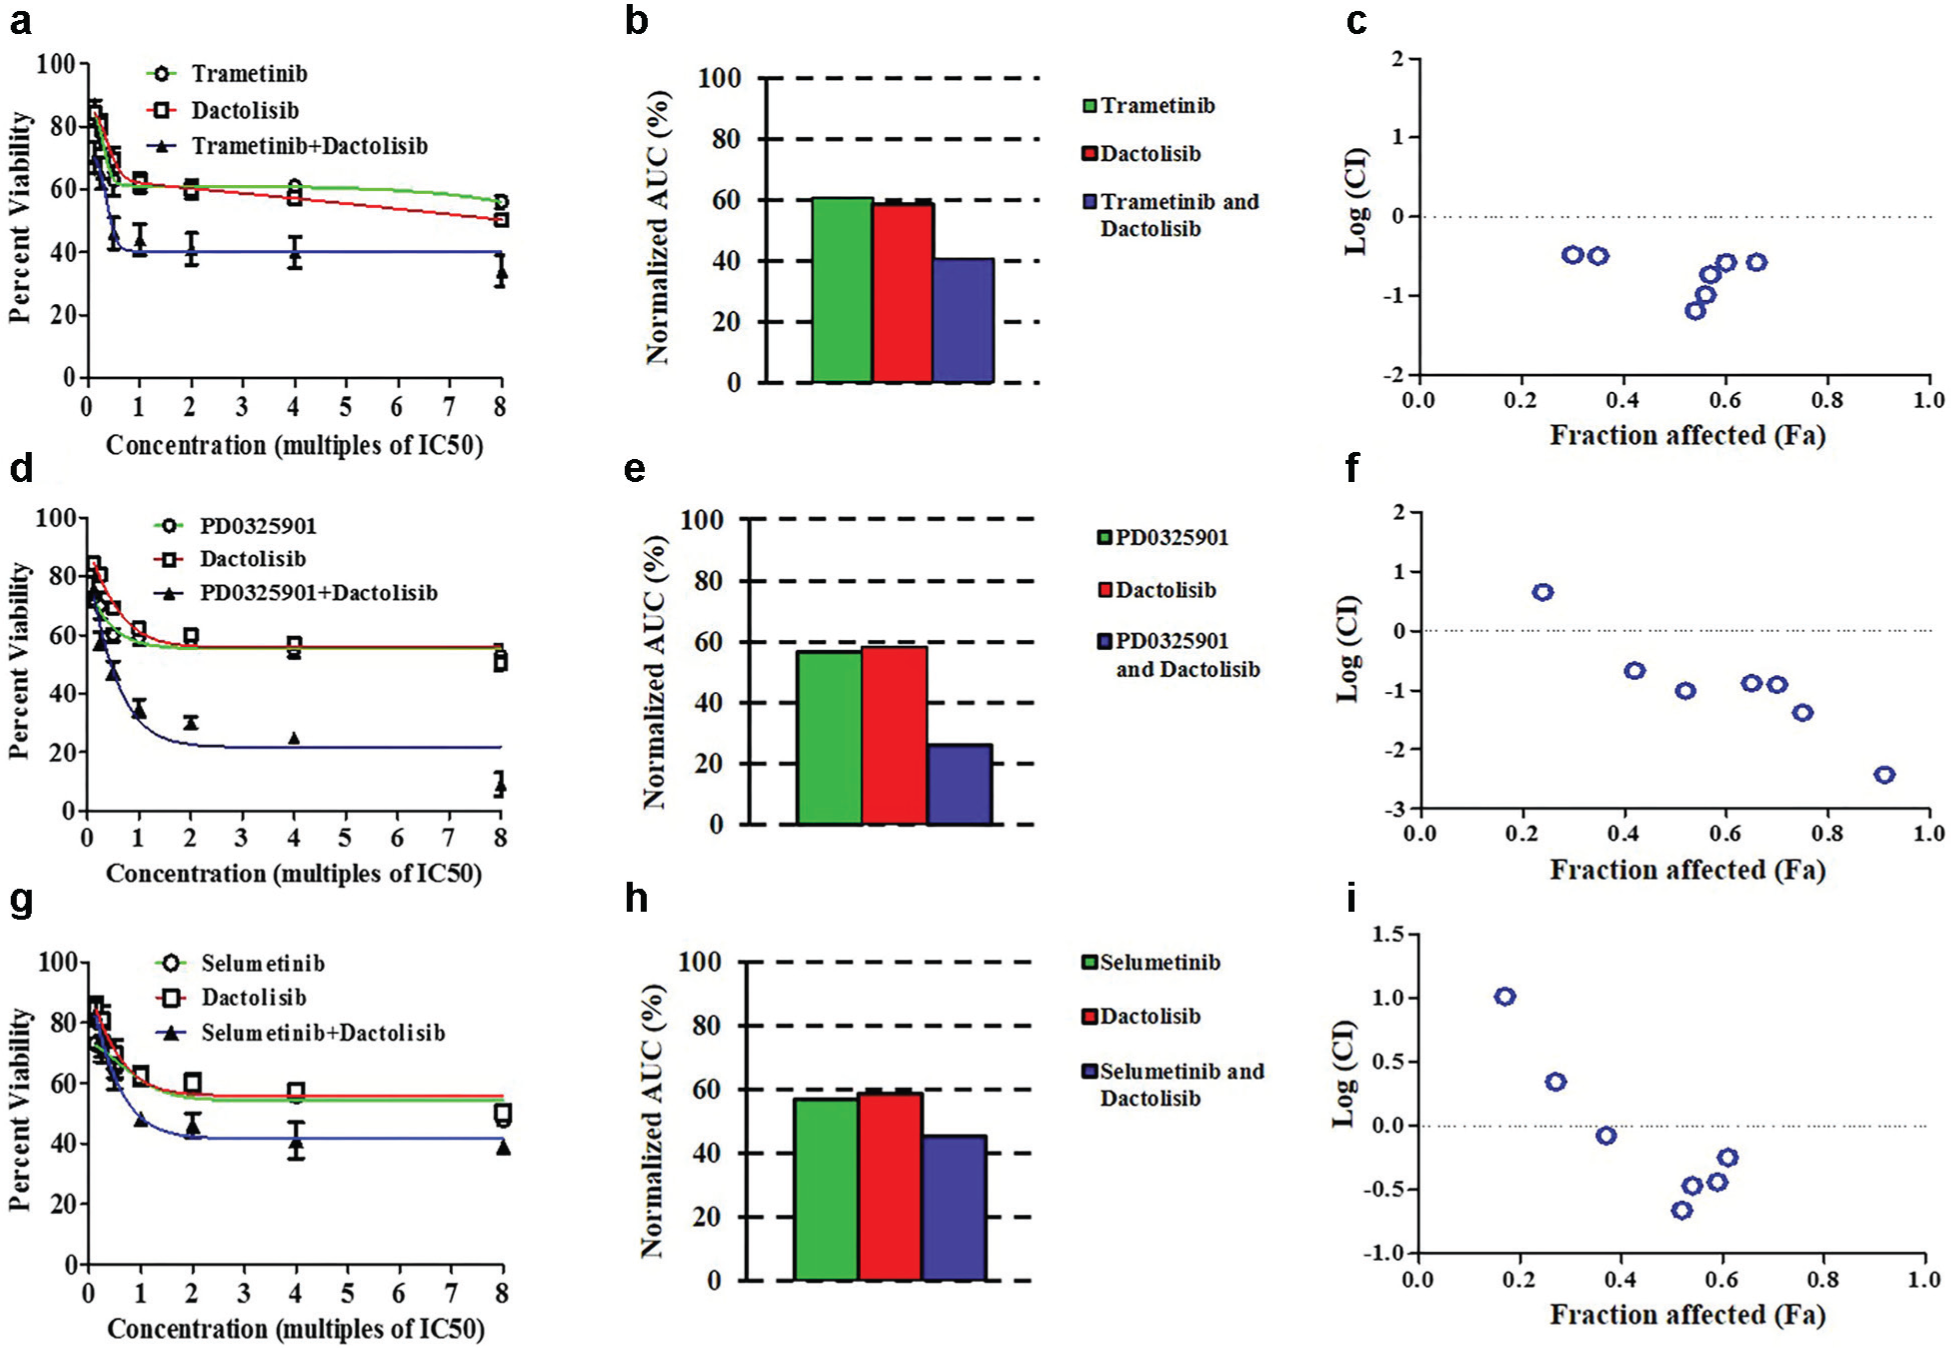
Single and combination drug treatment of HT-29 spheroids with (
To elucidate whether reduction in cell viability in the combination experiments was synergistically regulated by pairs of compounds, we computed a CI for each experiment. CI < 1 indicates synergism, CI = 1 shows an additive effect, and CI > 1 represents antagonism between the pair of compounds. 11 Pairs of drugs with CI < 0.1 are considered very strongly synergistic. Figure 6c shows that reduced cell viability by trametinib and dactolisib is synergistic at all combinations of concentrations used. PD0325901 and dactolisib ( Fig. 6f ) produce synergistic effects at all concentrations except for the lowest combined concentrations resulting from 0.125 multiple of the IC50 of each compound in the screening experiments of Figure 4 . Importantly, these two compounds produced very strong synergism at four and eight multiples of IC50 of each compound, that is, Log (CI) < –1. Finally, except for the first two pairs of concentrations, selumetinib and dactolisib also synergistically enhanced the response of HT-29 spheroids to the treatment.
Cancer cells often contain mutations in several signaling pathways, which may also vary among the population of cancer cells due to their inherent heterogeneity. Despite significant toxic effects of certain drugs (e.g., trametinib at low nanomolar concentrations generates significant toxicity to HT-29 cells; see Fig. 4 ), repeated use of a single drug agent often fails to fully suppress cancer cells due to the ability of cells to activate compensatory survival signaling pathways and develop resistance to the drug used, among other potential mechanisms of resistance.18,19 In HT-29 cells that are BRAF and PI3KCA mutant, targeting a singling protein in the mitogen-activated protein kinase (MAPK) pathway triggers cells to activate compensatory signaling through the PI3K pathway and enable them to survive otherwise lethal treatments. 20 This is evident from trametinib resistance of colorectal cancers. 21 Therefore, co-targeting of multiple pathways with “crosstalk” ability provides a rational therapeutic strategy to tackle the challenge of drug resistance. Our experiments showed that targeting of these survival pathways through combining specific MEK and PI3K inhibitors synergistically compromised the viability of HT-29 cells compared with treatment with a single inhibitor, indicating the role of both pathways in cell survival and the importance of simultaneous blocking of their signaling.
Identifying synergism or antagonism between two drugs using physiologically relevant spheroid cultures is a useful strategy for selecting drug combinations that will likely produce synergistic effects in vivo. Interpreting such data in terms of potential responses of cancer patients is difficult due to differences in drug pharmacokinetics and other factors among patients that influence drug sensitivity. Nevertheless, information from in vitro experiments can serve early trials of combination therapies in animal models to evaluate synergistic drug responses in vivo. Overall, this study demonstrates the utility of our facile ATPS tumor spheroid technology for drug screening, identification of effective compounds against specific cancer cells, and design and analysis of rational drug combination studies with 3D cancer cell cultures. In conjunction with molecular studies, this approach will enable a mechanistic understanding of effects of specific drug combinations on cancer cells and offer valuable insights prior to expensive and tedious animal model studies.
The robotic ATPS technology enabled generation of large quantities of uniformly sized spheroids and allowed preliminary screening of a collection of anticancer compounds against cancer cells in 3D cultures. Our statistical analysis of the screening experiments using SSMD discriminated effective drugs from ineffective ones and provided a quantitative metric to select compounds for dose-response tests. By computing the AUC from dose-response experiments with HT-29 colon cancer cell spheroids, we ranked the effectiveness of the drug compounds, taking into account both their potency and efficacy. Building upon these data and knowledge of pathway mutations in HT-29 cells, we designed combination therapy experiments using specific MEK inhibitors and a PI3K/mTOR inhibitor and showed that co-targeting of the MAPK and PI3K pathways significantly enhances the response of colon cancer cells to treatment. A CI metric was used to show synergistic effects of combinations of the inhibitors to target the cells. Our approach to single and combination drug testing with tumor spheroids and analysis with statistical and parametric means provides a strategy for identification and validation of drugs at physiologically relevant concentrations for use in animal models.
Footnotes
Acknowledgements
We thank Dr. Yang H. Yun for providing hyaluronan-resveratrol.
Supplementary material is available online with this article.
Declaration of Conflicting Interests
The authors declared no potential conflicts of interest with respect to the research, authorship, and/or publication of this article.
Funding
The authors disclosed receipt of the following financial support for the research, authorship, and/or publication of this article: This research was supported by a grant from the National Institutes of Health (R21CA182333) and Ohio Third Frontier (TECG20140954).
References
Supplementary Material
Please find the following supplemental material available below.
For Open Access articles published under a Creative Commons License, all supplemental material carries the same license as the article it is associated with.
For non-Open Access articles published, all supplemental material carries a non-exclusive license, and permission requests for re-use of supplemental material or any part of supplemental material shall be sent directly to the copyright owner as specified in the copyright notice associated with the article.