
Abstract
The existence of phenotypic differences in the drug responses of 3D tissue relative to 2D cell culture is a concern in high-content drug screening. Biodynamic imaging is an emerging technology that probes 3D tissue using short-coherence dynamic light scattering to measure the intracellular motions inside tissues in their natural microenvironments. The information content of biodynamic imaging is displayed through tissue dynamics spectroscopy (TDS) but has not previously been correlated against morphological image analysis of 2D cell culture. In this article, a set of mitochondria-affecting compounds (FCCP, valinomycin, nicardipine, ionomycin) and Raf kinase inhibitors (PLX4032, PLX4720, GDC, and sorafenib) are applied to multicellular tumor spheroids from two colon adenocarcinoma cell lines (HT-29 and DLD-1). These were screened by TDS and then compared against conventional image-based high-content analysis (HCA). The responses to the Raf inhibitors PLX4032 and PLX4720 are grouped separately by cell line, reflecting the Braf/Kras difference in these cell lines. There is a correlation between TDS and HCA phenotypic clustering for most cases, which demonstrates the ability of dynamic measurements to capture phenotypic responses to drugs. However, there are significant 2D versus 3D phenotypic differences exhibited by several of the drugs/cell lines.
Introduction: Tissue Dynamics Spectroscopy
Screens used in drug discovery can be classified into the two broad categories of phenotypic empirical screens versus target-based molecular screens. 1 Phenotypic profiling measures structural and physiological changes of living cells responding to applied compounds or biologicals with the overall goal to capture a multidimensional systems-wide response of cells that is intrinsically empirical. 2 Target-based screening, on the other hand, labels molecularly specific elements of genetic or signaling pathways to monitor molecular changes. Phenotypic screening was the dominant screening approach prior to the sequencing of the human genome, 3 after which target-based screening became the tool of choice because of the promise of genomics.
However, the efficiency of the pharmaceutical industry has been declining steadily despite target-based screening. Furthermore, 95% of anticancer drugs in phase I trials fail to gain marketplace approval. A reappraisal of the value of phenotypic profiling emerged recently 3 with an analysis of first-in-class drugs that shows that more drug approvals have resulted from phenotypic profiling than from target-based approaches. 4 It is clear that the complexity of disease requires a systems approach in which multiple targets and multiple pathways are affected and must be tracked by multidimensional approaches like phenotypic profiling. 5 Furthermore, by integrating phenotypic screens with target-based approaches, a more complete view of mechanisms of action is likely to emerge.
High-content imaging and analysis is a powerful and common type of phenotypic profiling. Image-based screens have the advantage of microscopic resolution that can identify and track large numbers of features. 6 High-content analysis (HCA) is performed almost exclusively on 2D cell culture because of the need for high-imaging resolution. 7 However, the reliance on isolated 2D cells that lack biological context has come under closer scrutiny as a possible source of false-positive selection of leads that later fail in animal or human clinical trials.
Three-dimensional tissue presents a more natural environment to cells, 8 with contacts to the extracellular matrix and to other cells that affect signaling pathways 9 and gene expression. 10 In addition, cellular dimensionality and microenvironment affect cancer drug sensitivity or resistance 11 of 3D cultures relative to 2D monolayers. The challenge that faces the developers and practitioners of screening is the difficulty of extracting high-content information from inside 3D tissue.
One approach to solve this 3D extraction problem would be to use intracellular motions in living tissue as a unique suite of biomarkers that measure phenotypic dynamic response of tissues to applied pharmaceuticals. Intracellular motions constitute many different dynamic processes such as organelle transport, membrane undulations, cytoskeletal restructuring, mitosis, strain at cellular adhesions, cytokinesis, and exo- and endocytosis, among others. The scale of subcellular motions ranges from nanometers to microns. Drugs, disease, or environmental perturbations modify these dynamic processes in specific ways that depend on the function performed by the process and on the influence exerted by the exogenous stimulus. A technique that can measure these phenotypic modifications in intracellular dynamics would provide important insight into the physiological responses and off-target effects of new drug candidates.
A new dynamics-based technique called biodynamic imaging (BDI) captures the broad range of motions internal to tissue by using low-coherence digital holography of dynamic light scattering. 12 Low-coherence laser interferometry enables the depth-resolved interrogation of 3D tissue samples up to 1 mm deep, far from surface bias and deeper than conventional microscopic imaging. Dynamic light scattering from intracellular motions modulates the speckle holography intensities13,14 with characteristic frequencies associated with rates of motion that vary for different cellular constituents. The use of low-coherence illumination provides depth discrimination that localizes the signals to selected depths,15,16 and digital holography provides the coherence gate for full-field imaging.
The sensitivity of biodynamic imaging to intracellular motion enables it to measure the physiological responses of 3D tissues to applied drugs. There are several formats to biodynamic imaging; these include motility contrast imaging (MCI) and tissue dynamics spectroscopy (TDS). Motility contrast imaging14,17 provides spatial maps of heterogeneous responses of tissue to drugs, while tissue dynamics spectroscopy provides frequency-time spectrograms that serve as fingerprints of the action of the drug on 3D tissue.18,19 These techniques have been applied to phenotypic profiling of a range of reference compounds through clustering and multidimensional analysis.20,21
The applicability of biodynamic imaging for phenotypic profiling is based on the many different ways that drugs affect cellular dynamics and motions. For instance, the cytoskeleton is a particularly important dynamic target. Intracellular and organelle motions are disrupted when the cytoskeleton is degraded as through nocodazole, and endosomal transport depends on cytoskeletal integrity. Phosphoinstinides affect actin and membrane ruffling, and cellular migration is affected by antimigratory and cytoskeletal drugs. Mitochondrial transport and metabolism are also important dynamic targets. Mitochondrial uncouplers affect mitochondrial ion transport, such as the drug CCCP that decreases the mitochondrial membrane potential, but antimycin increases it. Calcium controls mitochondrial motility and morphology, and mitochondrial dynamics are also affected by disease.
To open up wider applicability of biodynamic imaging to early drug discovery, it is important to interpret dynamic motional signatures in terms of molecular mechanisms of action. In this article, we selected reference compounds with known mechanisms of action to enable us to extrapolate between different modes of analysis. A plate-based high-content analysis (HCA) study was performed on 2D cell culture using tool compounds, including mitochondrial uncouplers, calcium transport-affecting agents, and Raf inhibitors on the DLD-1 and HT-29 adenocarcinoma cell lines. In tandem, these same compounds were tested on multicellular spheroids using TDS. Both HCA and TDS data sets were analyzed by multidimensional data reduction and were phenotypically clustered. The results show that there is a categorical correlation of 70% between HCA and TDS phenotypic clustering (for these compounds acting on these two cell lines), which establishes the ability of 3D-based TDS to capture phenotypic responses comparable to conventional HCA. However, more significantly, 30% of the cases show 2D versus 3D phenotypic differences that could have relevance to false-positive and false-negative selections in early drug screens.
Materials and Methods
Cell Lines and In Vitro Multicellular Tumor Spheroids
HT-29 and DLD-1 cells were obtained from the American Type Culture Collection (Manassas, VA). All growth media were supplemented with 10% fetal bovine serum (Atlanta Biologicals, Lawrenceville, GA) and 100 U/mL of penicillin and 100 µg/mL of streptomycin. DLD-1 cells were grown in RPMI-1640 medium, and HT-29 cells were grown in McCoy’s 5A modified medium. Cells were grown at 37 °C in a humidified 5% CO2 atmosphere. To form tumor spheroids, 22 cells were first grown in cell flasks, then moved to a rotating drum bioreactor (Synthecon, Houston, TX), where the cells were suspended in a complete growth medium. The medium was refreshed every other day. The cells form optimal experimental size (300–800 µm in diameter) spheroids in the incubator in about 1 week for the DLD-1 cell line and about 4 weeks for the HT-29 cell line.
To perform biodynamic imaging experiments, the tumor spheroids were loaded into 8-well Lab-Tek chamber slides (Lab-Tek II Chamber Slide System; Lab-Tek, Grand Rapids, Michigan). Low-gel temperature porous agarose was applied to immobilize the tumor spheroids in the chamber slide. The agarose powder from Sigma-Aldrich (St. Louis, MO) was mixed with stock growth medium without serum. The solution concentration was 1% by weight. The agarose solution was heated to dissolve the agarose and then cooled to 37 °C. The tumor spheroids were immobilized in a thin layer of agarose and then overlaid with complete growth medium. Each well contained about 5 to 20 spheroids. The prepared chamber slide was placed on a temperature-stabilized plate on the biodynamic imaging system, and the experiments were performed at 37 °C.
To perform the high-content screening on culture plates, the culturing conditions for DLD-1 and HT-29 cell lines were individually optimized to achieve consistent cell spreading at constant density in a 96-well format. The optimization used different cell densities to give a profile of cell dispersal that was appropriate for the assay with ~70% confluency, which was determined empirically for each cell line. Growth times were generally 24 to 48 h before each assay. The key approach was to seed the cells at a density that had about 70% confluency after 24 h. DLD-1 cells were seeded at 10,000 cells per well and then grown to 70% confluency. The HT-29 cells were seeded at a higher density (20,000–40,0000 cells per well) so that they would attach but not go through too many cell divisions.
Compounds
The Raf inhibitors were purchased from Selleckchem (Houston, TX), and all other compounds were purchased from Sigma-Aldrich. The stock of all the drugs was in 100% DMSO, and the drugs were diluted with growth medium (medium varies by cell lines) to the desired concentration typically in the 0.01% to 0.1% range and occasionally up to 0.5% or 1%.
Mitochondrial dysfunction is a central concern in the development of new drug entities because mitochondrial toxicity is one of the main off-target effects that leads to drug failures in clinical trials. 23 There are many known mitochondrial toxins that work through different mechanisms. Valinomycin is a potassium ionophore that induces rapid dissipation of the mitochondrial membrane potential (MMP) without adversely affecting the viability. FCCP is a well-studied mitochondrial uncoupler that permeabilizes the mitochondrial membrane to proton transport that also has a minor effect on cellular viability. Nicardipine is a calcium channel blocking agent that decreases intracellular calcium and affects the MMP. Ionomycin is a potent calcium ionophore that disables MMP accompanied by extinguished mitochondrial motility in astrocytes and cell death. These compounds affect the mitochondria and cellular viability through different mechanisms that are expected to lead to different TDS drug-response signatures.
Raf Inhibitors
Contrasted to mitochondrial toxins, signaling-pathway inhibitors have more subtle effects on cellular physiology, and many perform as cyotostatic drugs rather than as cytotoxic drugs. Raf inhibitors were developed after an initial period of Ras inhibitor development had largely failed. Somatic point mutations in BRAF occur in approximately 8% of human tumors,24,25 and in colon cancer, it is as high as 12%. 26 A single glutamic acid for valine substitution at codon 600 (V600E) is present in approximately 90% of BRAF mutations and associated with poor survival. These patients may be expected to respond to Raf inhibitors. 26 Sorafenib (Nexavar) was the first RAF inhibitor approved by the Food and Drug Administration (FDA). However, it is not highly selective to Raf and may operate primarily through antiangiogenic pathways. 27 PLX4032/RG7204 (Plexxikon; Roche, Indianapolis, IN) is active against three Raf isoforms at nanomolar concentrations in serum.28,29 In cells with the V600E BRaf mutation, this drug induces cell cycle arrest and sometimes cell death, 28 while it can be tolerated at serum levels up to 50 µM. PLX4032 has a paradoxical effect on wild-type BRaf, including lines with Ras mutation, in which the Raf inhibitor actually causes activation of ERK in the MAP kinase pathway30,31 with similar effects for PLX-4720 and GDC. 32 This would normally require genetic testing of patients to prevent the selection of PLX therapy for cancers that have wild-type BRAF, but the development of phenotypic screening methods may provide a fast and inexpensive alternative to genetic testing.
Biodynamic Imaging
Biodynamic imaging is performed using a continuous-wave low-coherence light source (Superlum, Cork, Ireland) with a 20-mW output intensity at a wavelength of 840 nm and a bandwidth of 50 nm with a coherence length of approximately 15 microns. The light path is divided into a signal and reference arm in a Mach-Zehnder interferometer by a polarizing beam splitter with variable polarizers to adjust the relative intensities in the signal and reference arms. Dynamic light scattering is performed in a back-scatter geometry because the intensity fluctuation rates depend on the momentum transfer vector that selects longitudinal motion along the backscatter direction. The light scattered by the living biological sample is collected by a long focal-length lens and transformed to a Fourier plane where the CCD pixel array is placed. The reference wave is incident on the CCD array at a small angle of 3 degrees relative to the signal axis, creating an off-axis digital hologram (shown in Fig. 1a ). A digital hologram is acquired on a Fourier plane of the optical imaging system, and this Fourier-domain hologram is transformed using an FFT algorithm into the image domain. The transformation performs two functions: demodulating the spatial carrier frequency represented by the holographic interference fringes and coherence-gating the low-coherence light to a specified depth inside the tissue sample. The coherence-gating role of digital holography creates a full-frame optical coherence tomography (OCT) section of the tumor spheroid at a fixed depth. The reconstructed section is highly speckled, which is normally considered an undesirable side effect in OCT, 33 but for our application, dynamic speckle provides the basis for biodynamic imaging. 13
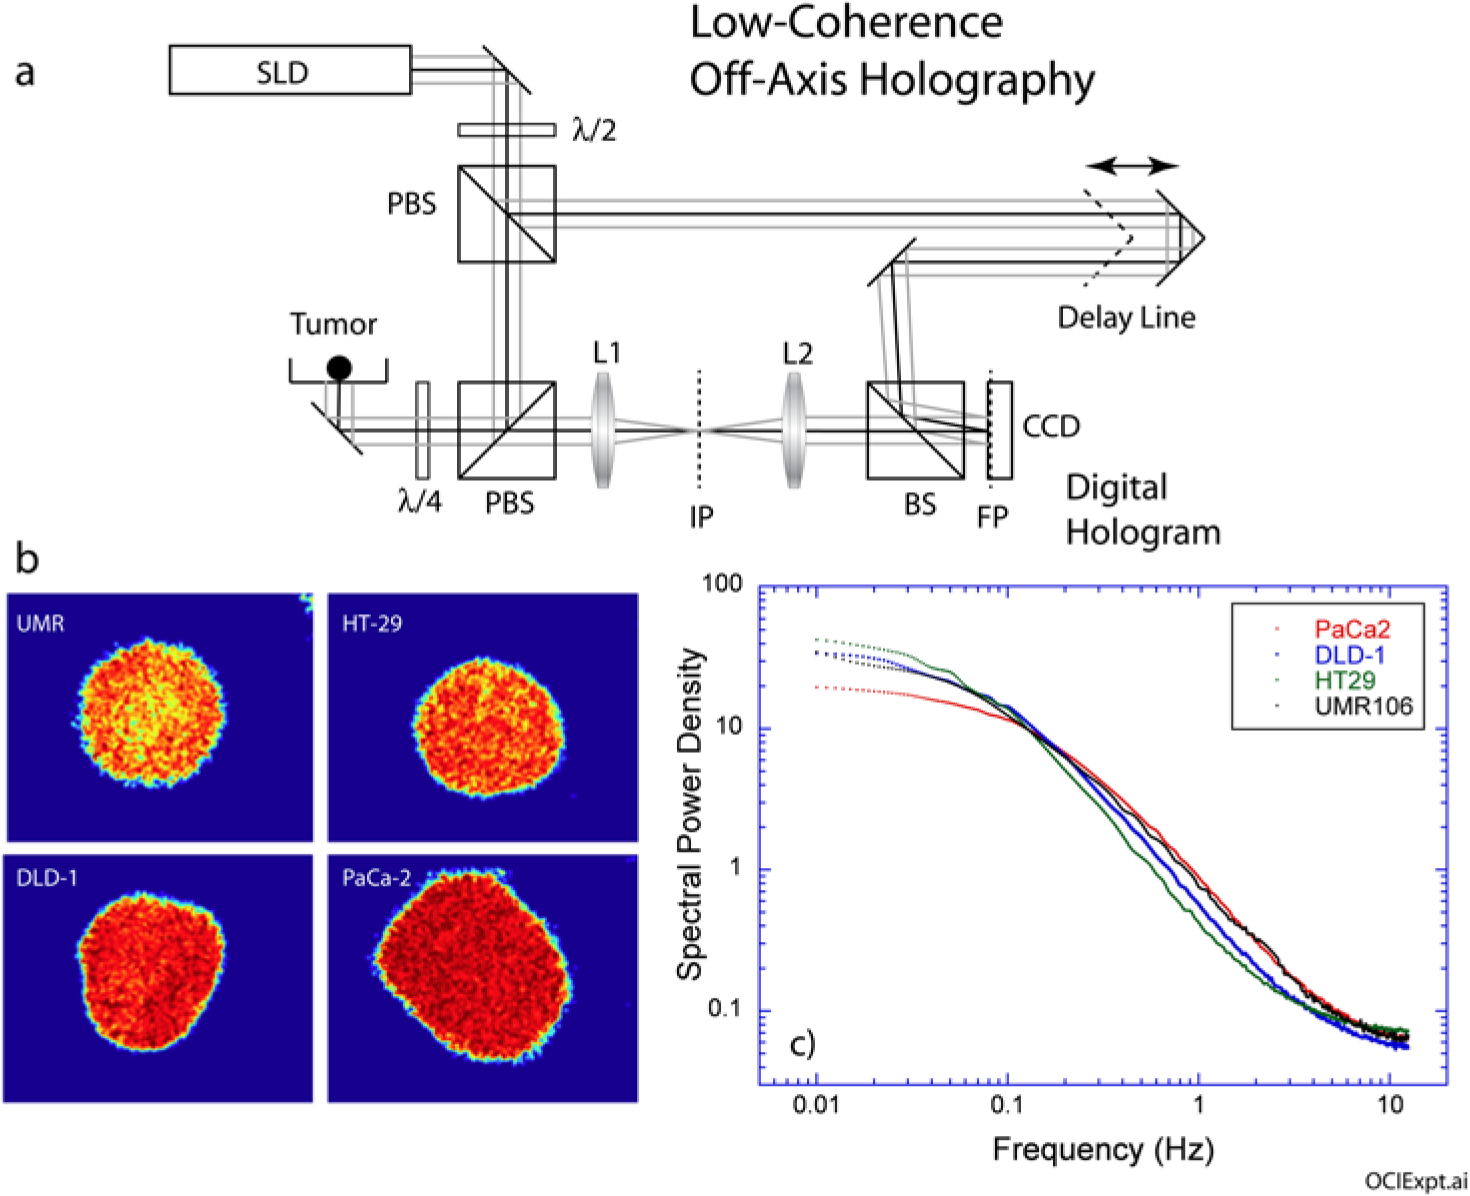
(
Biodynamic imaging is performed by capturing successive frames at a fixed coherence-gated depth at a frame rate of 25 fps. The reconstructed images consist of speckle intensities that are modulated by the dynamic intracellular motion of the target, causing intensity fluctuations on each pixel. Statistical measures of the intensity fluctuations lead to simple motility metrics such as normalized standard deviation (NSD), also known as temporal speckle contrast. Motility contrast images (MCIs) of several multicellular tumor spheroid samples are shown in Figure 1b for four cell lines: rat osteogenic sarcoma UMR-106, human colon adenocarcinomas HT-29 and DLD-1, and human pancreatic carcinoma PaCa-2. The four cell lines are arranged in increasing order of motility contrast, with the osteogenic UMR having the lowest motility and the pancreatic PaCa2 having the highest. 17 The UMR-106 rat osteogenic sarcoma cell line has an NSD value around 0.79. The HT-29 and DLD-1 are two human colon cancer cell lines that show very different characteristic NSD values: DLD-1 has an average of 0.88 and HT-29 is around 0.76. PaCa-2 is a human pancreatic cancer cell line. Pancreatic cancer is very active and aggressive and has a high characteristic NSD value of 0.91.
The fluctuating intensities of the speckle images have characteristic time scales that relate to the specific types of intracellular motion inside the living tissue samples. When there are many processes and many different characteristic times, the frequency domain is best suited to analyze the influence of applied drugs on dynamic light scattering. The time traces of the fluctuating intensities are transformed into the frequency domain as a spectral power density denoted by S(ω). The measured power spectrum is affected by the frame rate of the acquisition and by the exposure time of the shutter. In particular, the Nyquist theorem states that the highest frequency that can be resolved is
Differential Spectrograms
When a drug is applied to the sample, or the environmental conditions change, the relative power density at different frequencies is altered. This change is captured through the differential relative spectral power density that is defined as
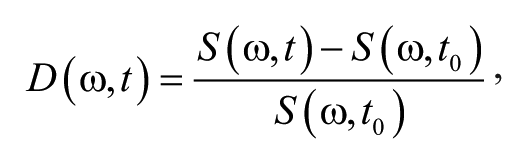
where
(
TDS Feature Vectors
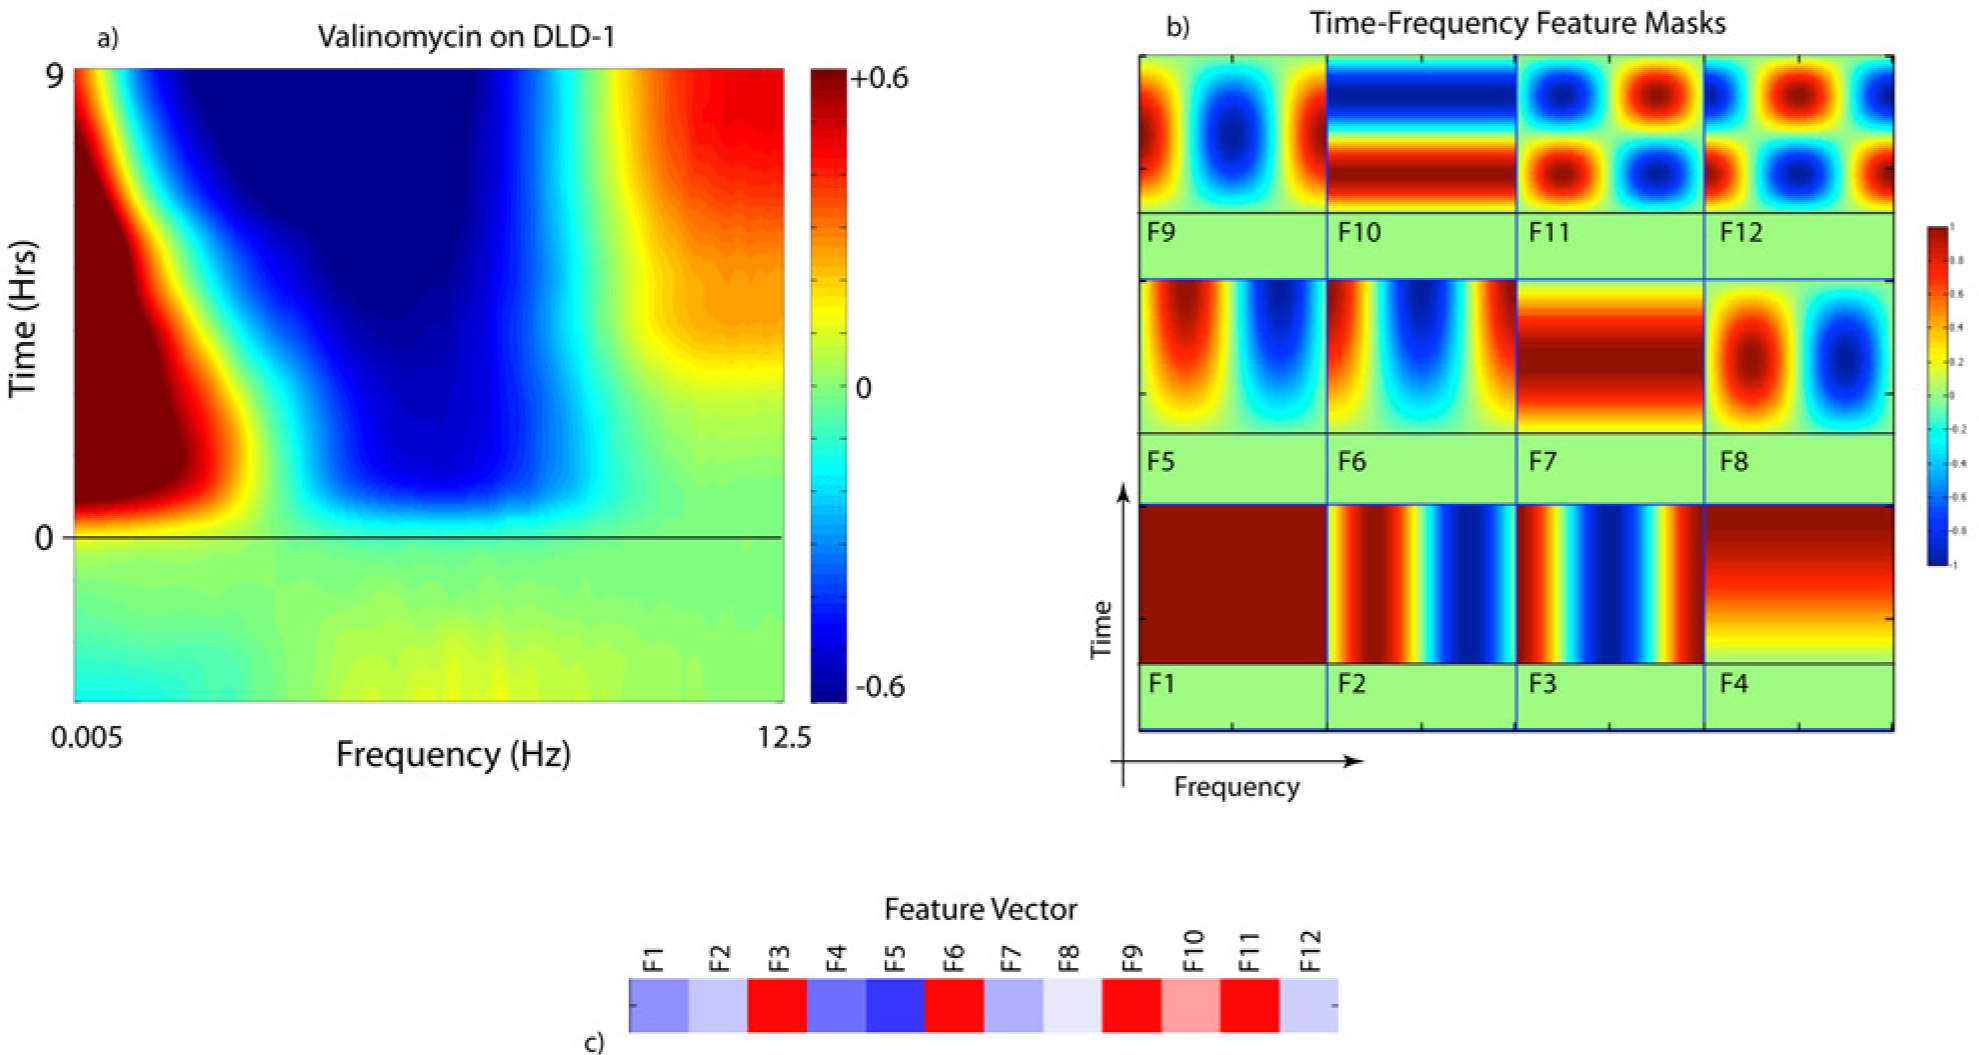
The 2D spectrogram format is condensed into a high-dimensional “feature vector” by dividing the time-frequency plane into specific regions. The drug-response spectrograms exhibit recognizable features that occur in characteristic frequency ranges at characteristic times after a dose is applied. There are many ways that the time-frequency plane can be divided and quantified into a feature vector. In Figure 2b , 12 feature masks cover the time-frequency plane of the spectrograms by discrete Fourier sampling. The data spectrograms are multiplied by each mask and integrated to yield a single value for each feature. The 12 values for the 12 features constitute a 12-dimensional feature vector, and an example is shown in Figure 2c . The masks are global masks that capture Fourier components. For instance, feature F1 measures the average change across all frequencies and times, while feature F2 measures a shift of spectral weight to lower frequencies. The feature F3 selects for spectrograms that show simultaneous low- and high-frequency enhancements with mid-frequency suppression. Other features, such as F4 through F6, select for time-dependent onset of the response, and features F10 through F12 select for qualitative flips in the spectral changes as a function of time. These masks are not orthonormal, and hence there is partial feature overlap, but multidimensional data reduction techniques account for nonorthogonality.
The biological meaning of the 12 masks has been partially established by relating response spectrograms to applied tool compounds with known mechanisms of action 20 and known environmental factors. 18 For instance, enhanced spectral content at high frequencies (above 0.5 Hz) signifies the increased active transport of organelles and vesicles. Mid-frequencies (between 0.05 Hz and 0.5 Hz) relate to the nuclear motions, including nuclear membrane as well as undulations of the cell membrane. Low frequencies (below 0.05 Hz) correspond to large shape changes and probe the rheology of the cells as they respond to their force environment. As an example, apoptotic signatures in TDS have both a high-frequency enhancement (active vesicle transport) and a low-frequency enhancement (formation of apoptotic bodies), while necrosis has only the low-frequency enhancement associated with blebbing. Therefore, features F3, F6, and F9 capture apoptotic processes, while F2, F5, and F8 capture necrosis (with different time dependences for each mask). As another example, cytokinesis during mitosis is a rapid process that contributes to the high-frequency spectrogram signal, and enhanced high frequency often correlates with enhanced proliferation. Clearly, there is overlap of spectral responses from different mechanisms, but multidimensional scaling captures differences from different mechanisms and helps separate, or cluster, different phenotypic drug responses.
High-Content Analysis
High-content analysis (HCA) of mitochondrial toxicity was performed using live DLD-1 and HT-29 cell cultures stained with three fluorescent dyes: TMRM, Hoechst 33342, and TO-PRO-3 (Invitrogen, Carlsbad, CA). The lipophilic cationic dye TMRM was used to monitor mitochondrial membrane potential (MMP). The cell-permeable nuclear marker Hoechst 33342 was used to identify cell events and to monitor nuclear morphology. The membrane-impermeable nuclear marker TO-PRO-3 was used to characterize cell viability based on plasma membrane integrity. Detailed mitochondrial toxicity HCA with data collection and analysis protocols were recently described 34 and are briefly summarized here. Following a 4-h incubation of cells with the tool compounds, a cocktail of the three fluorescent dyes was added, and cultures were incubated for an additional 45 min at 37 °C and 5% CO2 before analysis. The final concentrations of dyes in each of 96 wells were 125 nM TMRM, 133 nM TO-PRO-3, and 1.5 µg/mL Hoechst 33342. Along with the dyes, 20 µM verapamil was added to the cocktail to maintain consistent TMRM cell loading through multidrug inhibition. Liquid handling was performed using a BioMek FX Laboratory Automation Workstation (Beckman Coulter, Brea, CA). Data were collected using an imaging cytometer iCys (Compucyte, Westwood, MA) configured with three excitation lasers (405, 488, and 633 nm) and four emission detector photomultiplier tubes (PMTs) TMRM emission was recorded using a PMT with a 580/30-nm band-pass filter, Hoechst 33342 with a 463/39-nm filter, and TO-PRO-3 with a 650-nm long-pass (LP) filter. Six fields of view (500 × 368.6 µm each) were arbitrarily collected per well using a 20× objective at 0.5 µm resolution. Analysis was performed using distributions of responses of each cell per individual parameter. Cell numbers could vary from tens to thousands depending on the treated/untreated conditions. Cell number per well was recorded using a Mias microscope (Digilab, Marlborough, MA), which enabled high-speed, low-resolution imaging. While cell numbers per sample (per well) were analyzed as a distinct parameter of response, no effect from cell number parameter was detected.
Image segmentation was performed based on Hoechst 33342 intensity using the iCysCytometric Analysis software (CompuCyte) to identify cell events. Primary contours were defined on the basis of adjacent Hoechst 33342 pixels above the preset intensity threshold value (3500 AU for the DLD-1 cell line and 7900 AU for HT29) and expanded by 4 pixels for the analysis. A low-pass 5 × 5 smoothing filter and watershed algorithm were applied to separate closely spaced nuclei. In addition, an area filter was applied to eliminate clumps with areas larger than 250 µm2 and cell debris with areas less than 20 µm2. Peripheral contours were defined as a 14 pixel-width ring outside the expanded primary contour. Integrated TMRM intensity within the peripheral contour (TMRM PI) and maximum TMRM pixel intensity within the peripheral contour (TMRM max) were selected as TMRM-based parameters. Nuclear area, nuclear circularity, nuclear average, and integral intensities were used as Hoechst 33342–based parameters. TO-PRO-3 average intensity was used as a viability measure.
After image feature extraction, statistical analysis of the population distribution was performed using MATLAB 7.12.0 (MathWorks, Natick, MA). Kolmogorov-Smirnov (KS) values were used as statistical measures for TMRM- and Hoechst-based parameters. KS values were computed for each compound, dilution, and parameter of interest as KS(comp,dmso) = max(cdfcomp – cdfdmso), where cdf is the cumulative distribution function of compound-treated and DMSO-treated (untreated) negative control samples, respectively. The sign of KS reflects the direction of the shift of the distribution relative to the negative control (DMSO). Percentage of live cells (viability factor) was evaluated on TO-PRO-3–derived parameters. The viability factor was rescaled as −1 (all dead) to +1 (all live) to match the range for KS values.
Statistical measures of seven parameters (TMRM PI, TMRM max, nuclear area, circularity, average and total intensity, and cell viability) measured at three different concentrations (100, 33.3, and 11.1 µM) for both cell lines were concatenated to create 21-parameter numerical vectors for phenotypic cell response characterization. Each experiment was performed in duplicates or quadruplicates, and the obtained vectors were analyzed individually to evaluate statistical variability.
Results
Tissue Dynamics Spectroscopy
The four Raf inhibitors and the four mitochondrial toxins were applied against the two colon adenocarcinoma cell lines in triplicate. The DLD-1 cell line is a colorectal adenocarcinoma cell line that is positive for overexpression of K-ras oncogenes but has wild-type BRAF. The HT-29 cell line has wild-type K-ras but has the V600E BRAF mutation. The 16 drug-response spectrograms are shown in Figure 3 for 100 µM for all Raf inhibitors, FCCP, and nicardipine. The concentrations for ionomycin and valinomycin were both 50 µM, approximating the EC50 values for these compounds in the tumor spheroids. These high concentrations in TDS were used because 3D tissue EC50 is typically an order of magnitude larger than the EC50 for 2D plates because of reduced tissue transport and metabolic depletion of compounds by the larger cell numbers in tissue samples. However, these high doses may elicit off-target effects that represent toxicity responses to the compounds. The negative controls followed the same protocols as for the drug response, but with only DMSO applied to the growth medium at the carrier concentration. There is strong similarity in the responses of DLD-1 and HT-29 to FCCP. On the other hand, there are strong differences between the HT-29 and DLD-1 cell lines of the cases of the PLX Raf inhibitors and the mitochondrial toxins valinomycin, nicardipine, and ionomycin.
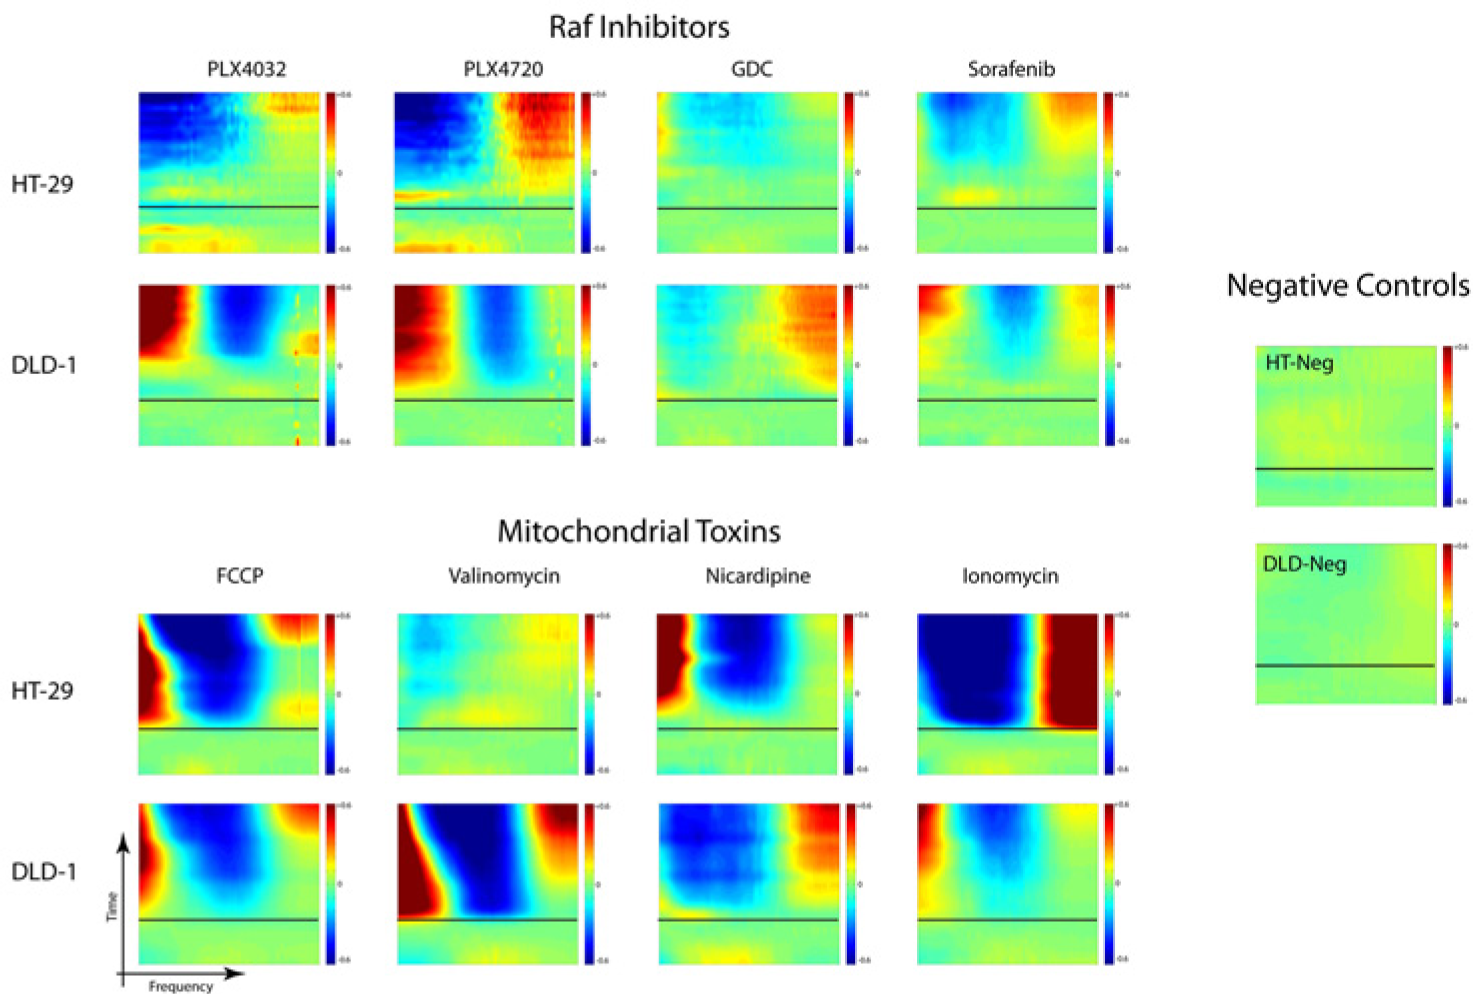
Tissue dynamics spectroscopy generates differential relative drug response spectrograms for four Raf inhibitors (PLX4032, PLX4720, GDC, and sorafenib at 100 µM) and four mitochondrial toxins (FCCP, valinomycin, nicardipine, and ionomycin at 50 and 100 µM) from tumor spheroids of two cell lines (HT-29 and DLD-1). The dose is applied at t = 0 (the black line) with time increasing vertically and linearly to 9 h and frequency increasing logarithmically along the horizontal axis from 0.005 to 12.5 Hz. The color represents the relative change in fluctuation spectral power in response to the applied drug.
A key goal of the current article is to identify the cases in which tissue dynamics spectroscopy, performed on 3D tissue, reflects conventional high-content analysis on 2D cell culture, thereby providing a validation data set for biodynamic imaging. Simultaneously, strong disagreement between tissue dynamics spectroscopy on 3D tissue relative to conventional high-content analysis on 2D culture would point to potential 3D versus 2D phenotypic differences in the screening of these compounds.
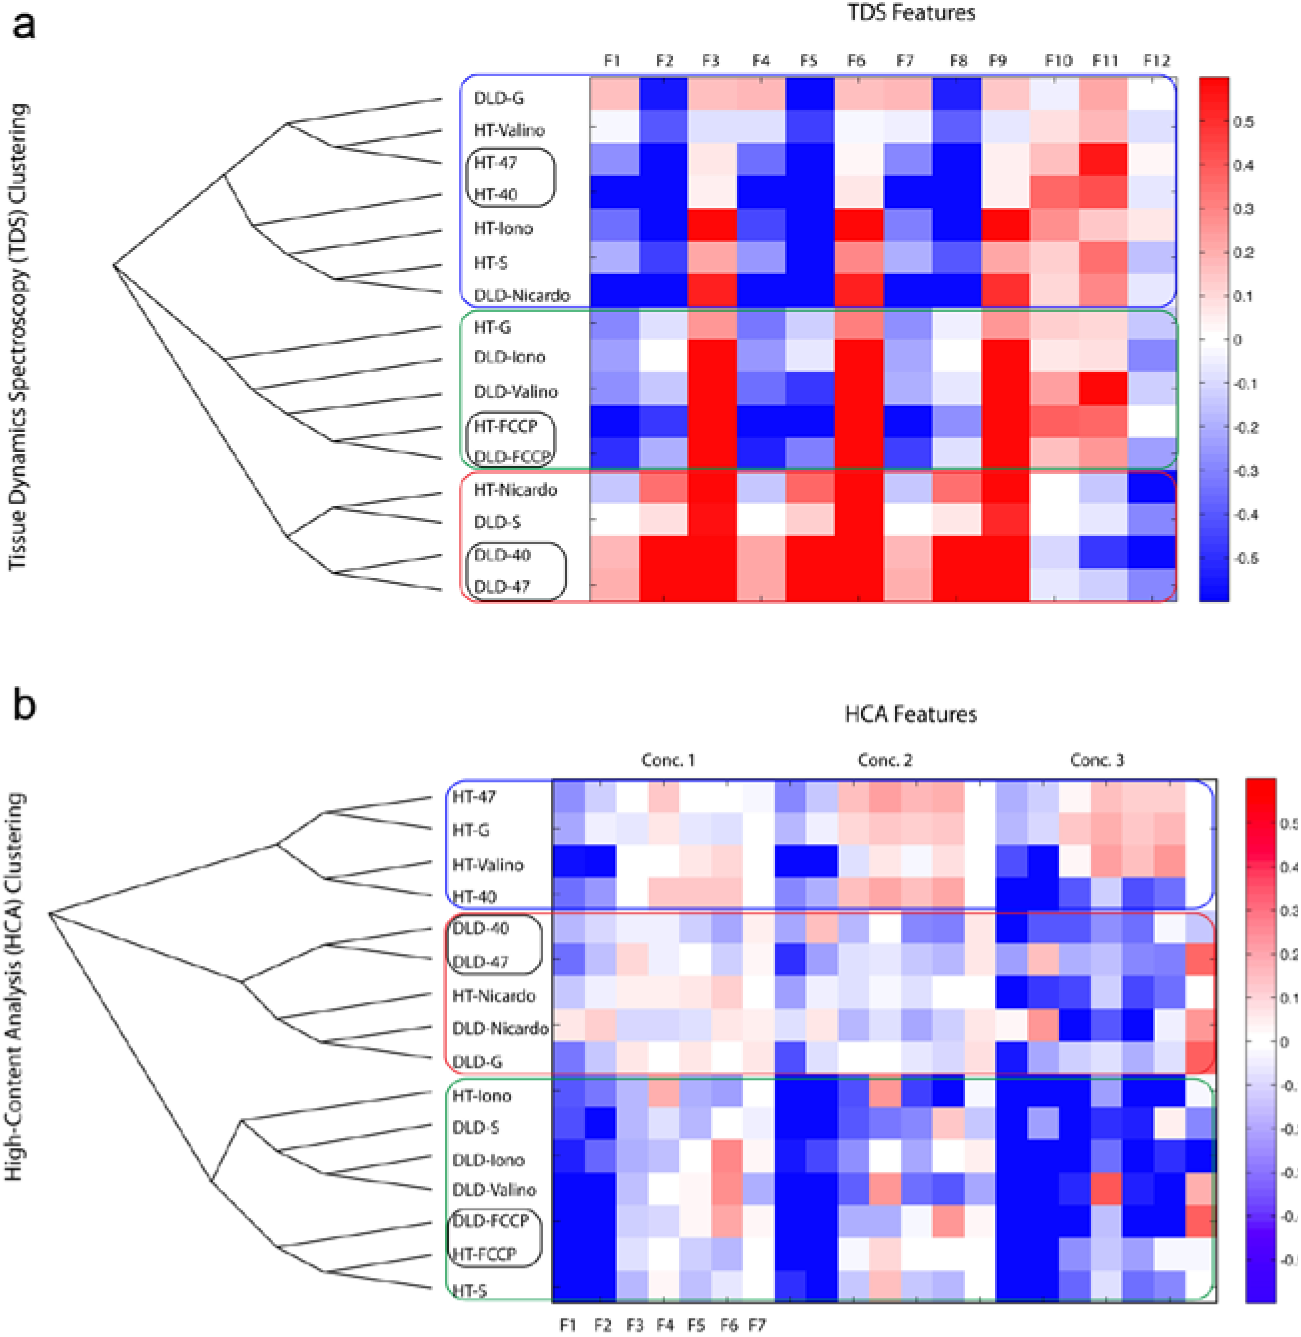
To make the comparison of the TDS drug-response spectrograms to high-content analysis, the patterns in the time-frequency drug-response spectrograms are quantified into feature vectors. The use of feature vectors and similarity matrices for phenotypic profiling has been discussed previously in the context of biodynamic imaging. 20 Each drug-response spectrogram is multiplied by each of the 12 feature masks in Figure 2b and integrated to provide a single value for each of the 12 features. The result for each spectrogram is a 12-dimensional feature vector. Similarity between two spectrograms is measured by the correlation coefficient between the two corresponding feature vectors. This similarity is used in unsupervised hierarchical clustering that groups similar drug responses, as shown in Figure 4a . The TDS feature vectors for the 16 cases (eight drugs and two cell lines) are shown on the right, and the cluster dendogram is shown on the left. There are three broad groups of TDS responses that can be called HT-Plexxikon-like, FCCP-like, and DLD-Plexxikon-like. The DLD-1 responses to the Raf inhibitors PLX4032 and PLX4720 are grouped together but separate from the HT-29 responses to these drugs, reflecting the Braf/Kras difference in these cell lines. Sorafenib groups with the Plexxikons for these two cell lines. The Raf inhibitor GDC shows no clear trends or affinities between these two cell lines, which is expected for these cell lines. Notably, all of the mitochondrial compounds fail to cluster together between the DLD-1 and HT-29 spheroids except for FCCP.
(
High-Content Analysis
As an example of the HCA data set and analysis, DLD-1 cells are shown in Figure 5 for the separate detection channels. The cells were incubated for 4 h with 100 µM of different compounds, including vehicle negative control DMSO (no treatment). Cells were stained with a cell marker cocktail consisting of the three fluorescent dyes—Hoechst 33342, TMRM, and TO-PRO-3—and analyzed with the iCys imaging cytometer. Arbitrary images (500 × 368 µm) demonstrate a light-scatter channel, individual fluorescence channels for each cell marker, and a merged channel with a combination of all three fluorescence channels (color image). Examples of DLD-1 responses to all eight tested compounds and nontreated control (DMSO) are demonstrated in Figure 5 . The high-content values for cellular morphology and fluorescent intensities were collected into feature vectors for three concentrations (11.1, 33.3, and 100 µM).
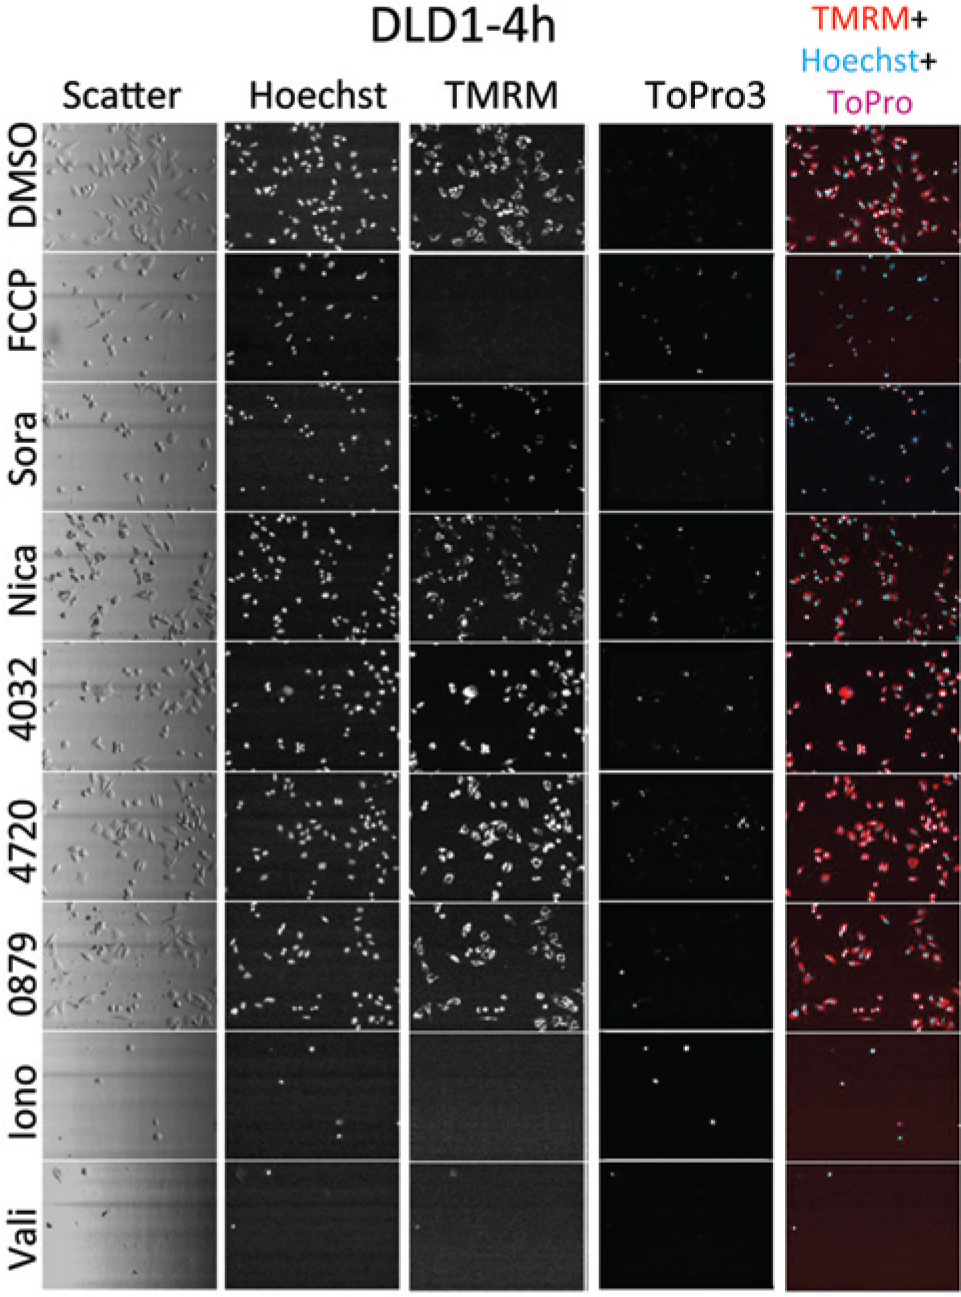
Examples of DLD-1 images collected using the iCys imaging cytometer. Cells were stained with a cell marker cocktail consisting of three fluorescent dyes—Hoechst 33342, TMRM, and TO-PRO-3—and analyzed with iCys imaging cytometer. Images (500 × 368 µm) demonstrate a light-scatter channel, individual fluorescence channels for each cell marker, and a merged channel with a combination of all three fluorescence channels (color image). Examples of DLD-1 responses to all eight tested compounds and nontreated control (DMSO) are demonstrated.
We used the nonparametric Kolmogorov-Smirnoff test as the measure of HCA vector similarity. The resulting unsupervised hierarchical clustering and dendogram are shown in Figure 4b . The feature values shown in the columns of Figure 4b are in the order of, respectfully, TMRM peripheral integral, TMRM peripheral maximum, nuclear area, nuclear circularity, nuclear integral, nuclear average, and viability, grouped into the three concentrations. As in the case of TDS, the DLD-1 pair of Raf inhibitors PLX4032 and PLX4720 separate from the HT-29 response to these drugs, reflecting the Braf/Kras difference in these cell lines. The other Raf inhibitors, sorafenib and GDC, do group for the two cell lines. FCCP, ionomycim, and nicardipine group between the two cell lines, but valinomycin does not.
Discussion
The TDS and HCA dendograms from Figure 4 show the sequential clustering of the compounds on the two cell lines. Several compounds stand out in agreement between the TDS and HCA responses. For instance, the mitochondrial uncoupler FCCP has very similar action on each cell line and is paired together by both TDS and HCA. Conversely, the mitochondrial compound valinomycin elicits very different responses from HT-29 relative to DLD-1, which is also captured by the distant placement of valinomycin in each TDS and HCA dendogram. In both the TDS and the HCA dendograms, the two Plexxikon compounds acting on DLD-1 are paired together and are separated from their action on HT-29. This separation between these Raf inhibitors acting on HT-29 with a BRaf mutation and DLD-1 with a KRas mutation is in agreement with the known action of these drugs on these cell lines. Therefore, several of the known or expected similarities and differences among the drugs and cell lines are correctly captured by phenotypic profiling by both TDS (measured dynamically in 3D) and HCA (measured morphologically in 2D).
On the other hand, notable exceptions between TDS and HCA clustering in Figure 4 may reflect phenotypic differences between 3D and 2D screens. Nicardipine has a similar action on both HT-29 and DLD-1 in the HCA screen but shows different action between the two cell lines in the TDS screen. The TDS differences between HT-29 and DLD-1 may be related to the nature of cell-cell adhesions for these lines. The HT-29 cells have different growth characteristics from the DLD-1 cells in both 2D and 3D. The DLD-1 cells rapidly spread in 2D to form a confluent monolayer and form loosely organized spheroids in 3D. The HT-29 cells cluster in 2D with less cell spreading and form compact spheroids in 3D. The HT-29 cells have high E-cadherin expression, 35 and the E-cadherin/β-catenin complexes are tethered to the cytoskeleton in these compact spheroids. This organization has been shown to strengthen cell-cell adhesions. Calcium channel blockers (nicardipine) or calcium ionophores (ionomycin) can influence cell adhesion molecules and the cytoskeleton. We have observed that the DLD-1 and HT-29 cell lines display different spectrograms for cytoskeletal drugs that disrupt microtubules (nocodazole, colchicine) or actin (cytochalasin D) (data not shown). We hypothesize that the differences between DLD-1 and HT-29 in this study are due to changes in differential cell dynamics as cell-cell adhesions and the cytoskelton are altered by the nicardipine and ionomycin. Malignant cells typically have modified or unstable cell-cell contacts. If TDS can dynamically monitor changes in cell-cell interaction, it provides an additional layer of information not accessible via HCA screening and a new tool for phenotypic drug screening. The same discrepancy between TDS and HCA is observed for ionomycin and for the GDC compound. These HCA-TDS differences cannot be explored in detail in the 1D sequential clustering but are illuminated further using multidimensional scaling.
Multidimensional scaling is a multivariate analysis approach that enables the visualization of high-dimensional data in lower dimensions. It is not a projection but is a morphometric approach that presents points in a lower-dimensional space that retains qualitative “distances” between the same points in the high-dimensional space. A planar (2D) multidimensional scaling of the TDS data is shown in Figure 6 based on a Euclidean metric for relative distances in the TDS similarity matrix. The drugs and cell lines break down into three groups of phenotypic TDS responses presented as a Venn diagram, but the colors of the data markers relate to the HCA classifications, allowing a direct visual comparison of TDS and HCA clustering. Many associations are shared between HCA and TDS. For example, HCA groups the DLD-PLX4032 (DLD-40) and DLD-PLX4720 (DLD-47) responses as does the TDS analysis, and these are grouped separately from HT-PLX4032 (HT-40) and HT-PLX4720 (HT-47) for the other cell line. This grouping of the PLX-40 and PLX-47 within a cell line reflects their similar structure and activity, while the separation between the HT-29 and the DLD-1 cell lines reflects the known differences in the action of the Plexxikon compounds on Braf versus Kras mutations. As another example, both HCA and TDS group valinomycin separately between the two cell lines. The underlying mechanism for this cell-line dependence is not known, but the difference is captured equally by both 2D and 3D screens.
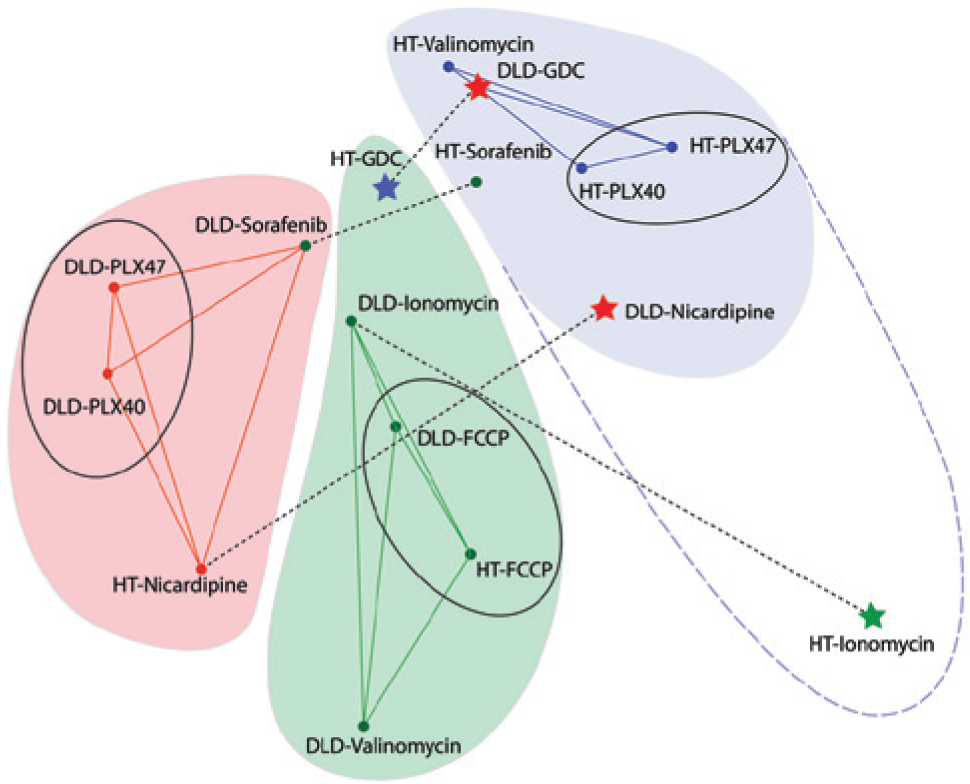
Multidimensional scaling of the tissue dynamics spectroscopy (TDS) screening data represented on a plane. The colored areas are from the TDS clustering of Figure 4a with the solid lines as the strongest associations. Conversely, the colors of the data markers are from the HCA clustering of Figure 4b . The black ovals highlight the strongest pairings and agreement between TDS and high-content analysis (HCA). Four conditions marked with stars stand in strong disparity between TDS and HCA clustering. The sorafenib responses are in marginal disagreement between HCA and TDS.
Of all the associations from the separate TDS and HCA clustering, 10 of 16 agree between HCA and TDS. On the other hand, 4 of 16 do not agree between 2D HCA and 3D TDS. These are DLD-nicardipine, HT-ionomycin, HT-GDC, and DLD-GDC, which are marked by the stars in Figure 6 . (The color of the stars reflects the HCA grouping of those cell/drug combination.) In addition to the four stars, there are two marginal disagreements between HCA and TDS for sorafenib on each of the cell lines. The dashed lines further highlight conditions that were clustered by HCA in 2D cell culture but have different phenotypic responses measured by TDS in 3D tissue. The strongest differences between the 2D and 3D results are for HT-ionomycin and DLD-nicardipine. In 2D cell culture, these drugs show similar action on both HT-29 and DLD-1, but in the 3D spheroids, they show different signatures because they affect the intracellular dynamics differently. Therefore, the categorical agreement between TDS and HCA (for these compounds on these two cell lines) is approximately 70%. This establishes the ability of 3D-based TDS to capture phenotypic responses comparable to conventional HCA. However, approximately 30% of the cases show 2D versus 3D phenotypic differences.
In the comparison of TDS (based on intracellular dynamics in 3D tissue) and HCA (based on morphological and functional labeling of isolated cells on 2D plates), there are two sources for phenotypic differences: dynamic versus morphological/molecular differences, on one hand, and 2D versus 3D phenotypic differences, on the other hand. These differences cannot be separated through the approaches presented in this article. However, even if the phenotypic differences in these screens were entirely due to dynamics and not from the dimensionality of the samples, they still capture an essential difference between how these drugs affect the different cell lines, and hence capture differences in phenotypic response that would be missed by 2D HCA alone. Conversely, if the phenotypic differences in these screens were entirely due to the dimensionality of the samples, then the ability of biodynamic imaging to probe 3D tissue and extract phenotypic responses would represent an important step forward in 3D screening for drug discovery.
As discussed in the introduction, a key issue in current drug discovery is the possibility that 2D culture misses the correct phenotypic response because of the lack of biological context (microenvironment), possibly leading to false-positive selection of compounds that later fail in 3D screens or in animal models. More disturbing is the possibility of false-negative selection, in which compounds that would have worked in 3D were rejected when they failed in 2D. In either case, these false selections may be mitigated by phenotypic profiling using tissue dynamics spectroscopy applied to 3D tissues. These results require further study by extending screening results from TDS to more cell lines with a broader selection of reference compounds and into animal models, to verify whether TDS can be more efficacious as a phenotypic drug screen in early drug discovery and for lead de-risking.
Footnotes
Acknowledgements
The authors thank Jonathan Lee of Eli Lilly for helpful discussions.
Declaration of Conflicting Interests
The authors declared the following potential conflicts of interest with respect to the research, authorship, and/or publication of this article: R.A., D.D.N., and J.T. have a financial interest in Animated Dynamics, which licenses biodynamic imaging technology from Purdue University.
Funding
The authors disclosed receipt of the following financial support for the research, authorship, and/or publication of this article: This study was supported by NSF1263753-CBET and NIH NIBIB 1R01EB016582-01.