
Abstract
Fragment-based lead discovery (FBLD) is a technique in which small, low-complexity chemical fragments of 6 to 15 heavy atoms are screened for binding to or inhibiting activity of the target. Hits are then linked and/or elaborated into tightly binding ligands, ideally yielding early lead compounds for drug discovery. Calorimetry provides a label-free method to assay binding and enzymatic activity that is unaffected by the spectroscopic properties of the sample. Conventional microcalorimetry is hampered by requiring large quantities of reagents and long measurement times. Nanocalorimeters can overcome these limitations of conventional isothermal titration calorimetry. Here we use enthalpy arrays, which are arrays of nanocalorimeters, to perform an enzyme activity-based fragment screen for competitive inhibitors of phosphodiesterase 10A (PDE10A). Two dozen fragments with KI <2 mM were identified and moved to crystal soaking trials. All soak experiments yielded high-resolution diffraction, with two-thirds of the fragments yielding high-resolution co-crystal structures with PDE10A. The structural information was used to elaborate fragment hits, yielding leads with KI <1 µM. This study shows how array calorimetry can be used as a prescreening method for fragment-based lead discovery with enzyme targets and paired successfully with an X-ray crystallography secondary screen.
Keywords
Introduction
Modulation of the cyclic nucleotide phosphodiesterase (PDE) class of enzymes has provided drugs for the treatment of heart failure, chronic obstructive pulmonary disease, erectile dysfunction, and pulmonary hypertension. 1 PDEs consist of 11 families (PDE1 through PDE11) and are classified by the substrate (cAMP and/or cGMP) that they hydrolyze. There are more than 60 isoforms of PDEs either encoded by distinct genes or resulting from splice variants from individual genes.
Phosphodiesterase 10A (PDE10A) is expressed at high levels in the striatal medium spiny neurons2–4 where it regulates both cAMP and cGMP signaling cascades, making it an attractive target for correcting the misregulation of cAMP signaling.5,6 Reduction of PDE10A mRNA and protein levels in the striatum of transgenic mice implies a role of PDE10A in Huntington’s disease (HD). This hypothesis has been recently tested in a well-established transgenic mouse model of HD (R6/2). 7 The selective PDE10 inhibitor, TP-10, was administered intraperitoneally to R6/2 mice beginning at 4 weeks of age and resulted in amelioration of a number of neurologic and behavioral measures of brain damage and a decrease in striatal and cortical cell loss. Specific results included a delay of onset of abnormal hind-limb clasping response and improvement of balance on an accelerating rotarod. TP-10 reduced by 50% the loss of striatal size and decreased the number of intranuclear inclusions of aggregated mhtt. The PDE10 inhibitor papaverine has efficacy in attenuating some cognitive deficits observed in schizophrenia, and therefore inhibition of PDE10 may represent an approach to treatment of psychosis.6,8
Fragment-based lead discovery (FBLD) is a technique in which small, low-complexity chemical fragments of 6 to 15 heavy atoms are screened for binding to or inhibiting activity of the target. Hits are then linked and/or elaborated into tightly binding ligands, ideally yielding early lead compounds for drug discovery.9–11
Treatment of central nervous system (CNS) disorders requires that compounds penetrate the CNS by crossing the blood-brain barrier, which can be challenging to achieve starting with high-molecular-weight initial hits. For CNS disease, FBLD has advantages over more typical high-throughput screening for targeted discovery because in general it has been shown to yield lower-molecular-weight clinical candidates and has the added benefit that other chemical properties consistent with CNS penetration may be engineered during the optimization process. 12
Previously, we used a calorimetric enzyme activity assay to identify several fragment inhibitors of the cAMP-specific phosphodiesterase PDE4A. 13 We were unable to obtain high-quality structure data with any of the fragment hits and therefore did not perform any elaboration of these hits to obtain more potent inhibitors. Here, we have combined a calorimetric enzyme activity assay and X-ray crystallographic structure data to obtain more than two dozen fragment inhibitors of PDE10A, with two-thirds yielding high-resolution co-crystal structures appropriate for further structure-directed drug design. In addition, we describe the elaboration of selected fragment hits into submicromolar inhibitors.
Materials and Methods
PDE10A Cloning, Expression, and Purification
The catalytic domain of PDE10A2 (EC 3.1.4.17) was expressed and purified as described by Wang et al. 14 with modification.
PDE10A was cloned into a proprietary vector containing an N-terminal 6Xhis tag, cleavable by TEV protease. Positively identified clones were expressed in BL21(DE3) RIL cells. Cells containing target plasmid were grown in LB containing selection antibiotics at 37 °C until OD 600 = 0.7–0.8. Cells were induced with 0.1 mM isopropyl-β-D-thiogalactopyranoside (IPTG) at 15 °C overnight. The cells were harvested and stored at −80 °C. Cell pellets were lysed in 50 mM Tris (pH 8.0), 500 mM NaCl, 0.1% (w/v) NP-40, and 10 mM imidazole (lysis buffer) containing one Roche Complete Protease Inhibitor Tablet and 20,000 units of Benzonase. The suspension was sonicated on ice for 2 min at 70% output with a 25% duty cycle. Clarified supernatant was loaded onto Ni2+-charged IMAC. Peak fractions containing target protein were cleaved overnight with TEV protease. Cleaved protein was isolated by running the sample over Ni2+-charged IMAC, collecting flow-through. Protein was characterized for the relative oligomeric state by size exclusion chromatography in 20 mM HEPES (pH 7.5), 150 mM NaCl, and 5 mM dithiothreitol. Monomeric PDE10A was concentrated to 12 mg/mL for crystallization.
Fragment Library
Select compounds from commercial fragment libraries, Zenobia Therapeutics Library 1 and Library 2 (Zenobia Therapeutics, San Diego, CA), were used in this study. For the initial screen, we used fresh solutions of individual compounds dissolved at 200 mM in DMSO. The average molecular weight of the compounds was 153, and the average number of heavy atoms was 10.7.
PDE10A Calorimetric Activity Assay
Enthalpy arrays are arrays of nanocalorimeters that allow scientists to measure thermodynamics and kinetics of molecular interactions using small sample volumes (250 nL) and short measurement times (typically 5–10 min). 15 Previously, we demonstrated the use of enthalpy arrays in FBLD to identify fragment inhibitors of PDE4A. 13
For enthalpy array screening of fragments, hydrolysis of 3′,5′-cGMP was measured at 21 °C in 100 mM Tris-HCl (pH 7.5), 10 mM MgCl2, 1 mM tris(2-carboxyethyl) phosphine (TCEP), and 2% (v/v) DMSO. Each enthalpy array detector contains a sample region and a reference region, which are designated based on the material deposited on the region (see fig. 1 of Recht et al. 16 ). The sample region materials consisted of a drop of PDE10A (30 µM) and a drop of substrate solution (4 mM 3′,5′-cGMP). The reference region used a drop of buffer and a drop of the same substrate solution (4 mM 3′,5′-cGMP) used in the sample region. The combined drops in the sample region contained 15 µM PDE10A and 2.0 mM 3′,5′-cGMP, and the combined drops in the reference region contained 2.0 mM 3′,5′-cGMP. Reactions with compounds from the fragment library (2 mM in the combined drops, except as noted) were performed as above, except that a single compound (4 mM, except as noted) was included with the substrate (4 mM 3′,5′-cGMP). Guanosine 3′,5′-cyclic monophosphate, adenosine 3′,5′-cyclic monophosphate, pentoxifylline, papaverine hydrochloride, and 3-isobutyl-1-methylxanthine (IBMX) were obtained from Sigma-Aldrich (St. Louis, MO) and used without further purification. The concentration of the 3′,5′-cGMP stock solution (adjusted to pH 7 with dilute NaOH) was determined by measuring the absorbance at 254 nm and using an extinction coefficient of 13000 M−1 cm−1. 17
We used an enzyme concentration that would result in a good signal-to-noise ratio at Vmax, and the substrate concentration was then adjusted to produce the length of reaction desired. Typically, three replicates of each measurement were performed, and the average and standard error of the mean of the measurements are reported. Measurements with inhibitors had a corresponding set of control measurements without inhibitor performed at the side by side.
PDE10A shows dual activity, so hydrolysis of either 3′,5′-cAMP or 3′,5′-cGMP could be monitored. To reduce the amount of enzyme used in the screen, we used 3′,5′-cGMP as the substrate because PDE10A has a higher kcat with this substrate.
Microcalorimetric enzyme assays were performed using an iTC200 (Microcal/GE Healthcare, Waukesha, WI). Hydrolysis of 3′,5′-cGMP was measured at 25 °C in 100 mM Tris-HCl (pH 7.5), 10 mM MgCl2, 1 mM TCEP, and 2% (v/v) DMSO. The sample cell (200 µL) contained PDE10A (100 nM), and the injection syringe contained 4 mM 3′,5′-cGMP. Ten microliters of 4 mM 3′,5′-cGMP was injected in the sample cell to initiate the reaction.
Data Analysis
Data analysis of enthalpy array and microcalorimetric reactions was performed as described by Recht et al. 13
Protein Crystallization, Data Collection, and Structure Determination
Apo crystals for soaking experiments were grown by the hanging drop vapor diffusion method from a well solution of 18% PEG 4450, 0.2 M calcium acetate, and 50mM BME. Crystals were cryo-protected using well solution plus 25% ethylene glycol. Compounds were prepared for soaking as a 100 mM stock in 100% DMSO and diluted to a final concentration of 2.5 mM using well solution. Crystals were soaked overnight by adding 4 µL of compound stock to 4 µL of well solution containing the crystal. The final concentration of compound in these experiments was 1.25 mM.
Data sets collected from crystals soaked with small fragment compounds were measured at the Advanced Photon Source at Argonne National Labs (Chicago, IL) on beamlines 22ID (Mar 300 detector) and 22BM (Mar 225 detector) and at the Canadian Light Source on beamline 21ID-D (Rayonix 300 detector). All of the crystals used in these experiments diffracted to at least 2.0 Å resolution. The data sets obtained from crystals containing the small fragment compounds ZT0143 and ZT0451 were collected on a rotating anode X-ray source with a Mar 345 detector at the UCSD Biomolecule Crystallography facility to somewhat lower resolution (2.3 Å). The two crystals that contained the elaborated compounds ZT1595 and ZT1597 diffracted to medium resolution (2.5–2.8 Å) at the Canadian Light Source on beamline 21ID-D. All data sets measured at synchrotron sources were integrated and merged with the HKL2000 software.
18
The two data sets collected at the UCSD laboratory source were integrated with MOSFLM
19
and merged with SCALA.
20
Structure solution calculations were initiated by molecular replacement with MOLREP
21
using a search model developed from PDB entry 2OUR,
14
and models were refined with the program REFMAC.
22
Structures were initially refined without solvent and then refined subject to a limited water-picking protocol. Using this automated protocol, the resulting models were sufficiently well refined to calculate initial, unbiased electron density maps for the visual assessment of compound binding. All of the soaked crystals and protein conformations were highly isomorphous to the apo crystals (space group P212121 a = 50.6, b = 50.6, c = 155.7) and are very similar to a previously solved crystal form.
13
The models associated with the data sets that revealed bound fragments were finalized with additional cycles of model building and refinement (
Fragment Optimization
Chemical synthesis of elaborated fragments was done at Peptech Corporation (Bedford, MA). Synthetic details and compound characterization can be found in the supplementary material.
Results
The calorimetric activity assay was validated using three known general PDE inhibitors and a PDE10A-specific inhibitor: IBMX, pentoxifylline, and papaverine (
Table 1
;
Inhibition constants and ligand efficiencies of compounds sorted based on ligand efficiency (LE).
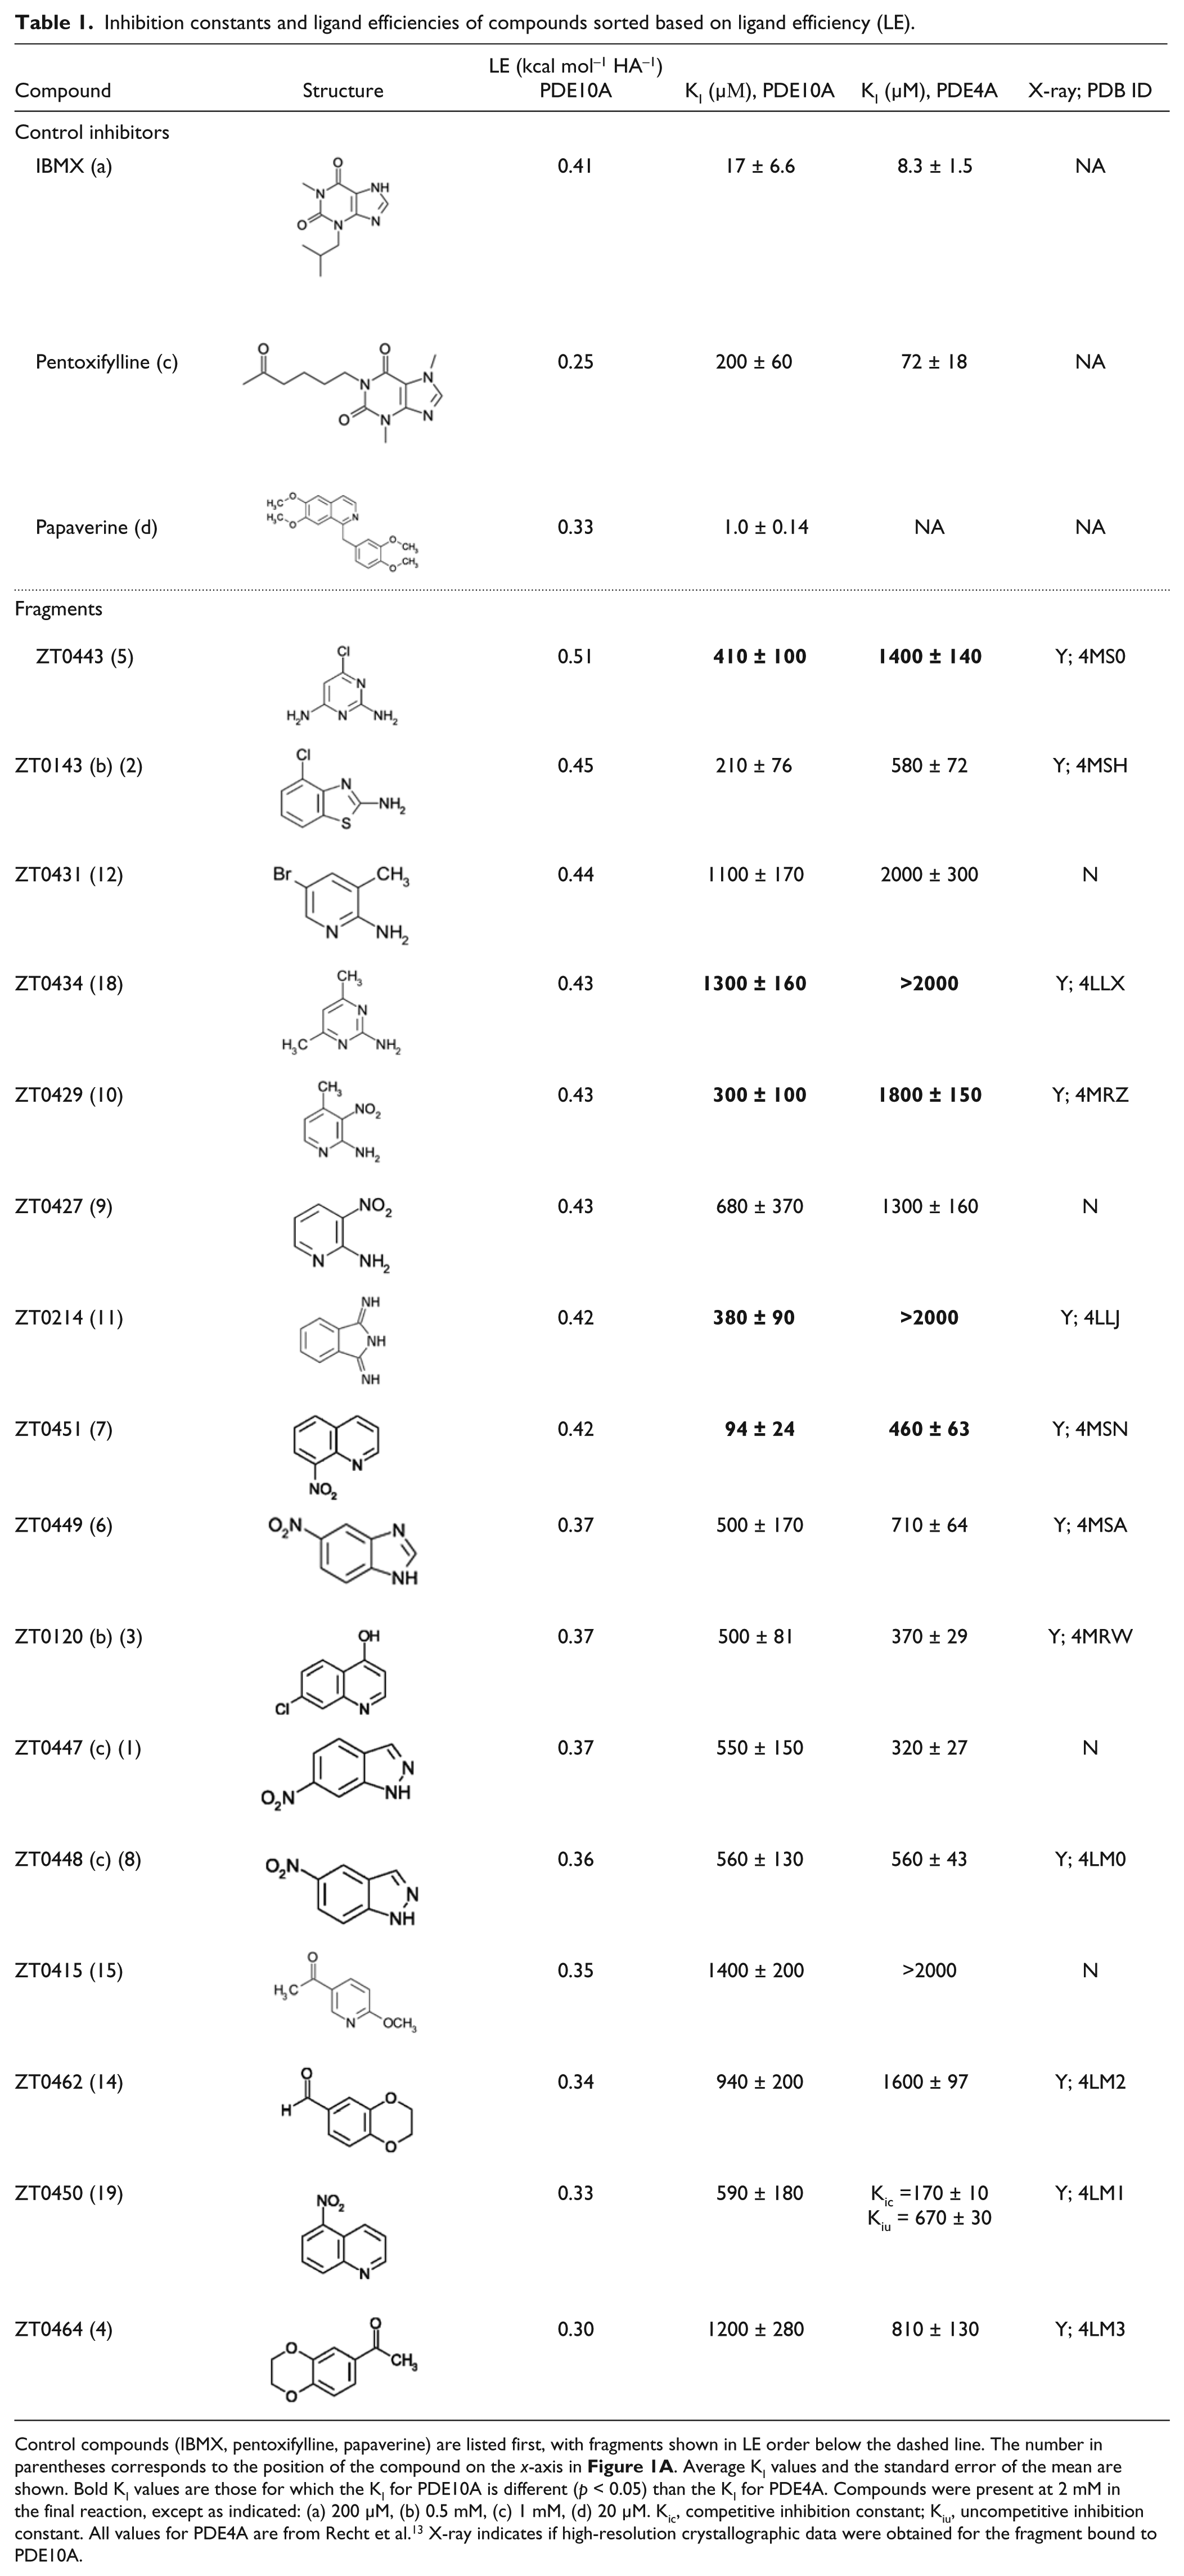
Control compounds (IBMX, pentoxifylline, papaverine) are listed first, with fragments shown in LE order below the dashed line. The number in parentheses corresponds to the position of the compound on the x-axis in Figure 1A . Average KI values and the standard error of the mean are shown. Bold KI values are those for which the KI for PDE10A is different (p < 0.05) than the KI for PDE4A. Compounds were present at 2 mM in the final reaction, except as indicated: (a) 200 µM, (b) 0.5 mM, (c) 1 mM, (d) 20 µM. Kic, competitive inhibition constant; Kiu, uncompetitive inhibition constant. All values for PDE4A are from Recht et al. 13 X-ray indicates if high-resolution crystallographic data were obtained for the fragment bound to PDE10A.
Previously, we had used the enthalpy array technology to identify inhibitors of the 3′,5′-cAMP–specific phosphodiesterase, PDE4A. 13 We tested these inhibitors against PDE10A, and the results are shown in Figure 1A and summarized in Table 1 . All of the fragments that showed activity against PDE4A also inhibited PDE10A with ligand efficiencies (LEs) greater than or equal to 0.30. Five of the compounds showed significantly higher potency against PDE10A than PDE4A. Fragment ZT0450, which showed mixed inhibition against PDE4A, showed only competitive inhibition against PDE10A. In contrast to the increase in KM and reduction in kcat observed with ZT0450 and PDE4A, only an increase in KM was observed with PDE10A at the highest concentration of ZT0450 tested (2 mM). It is possible that the differences in the substrate contact pattern and the overall shape and size of the substrate-binding pocket of these two phosphodiesterases14,25 contribute to the different observed inhibition mechanisms.
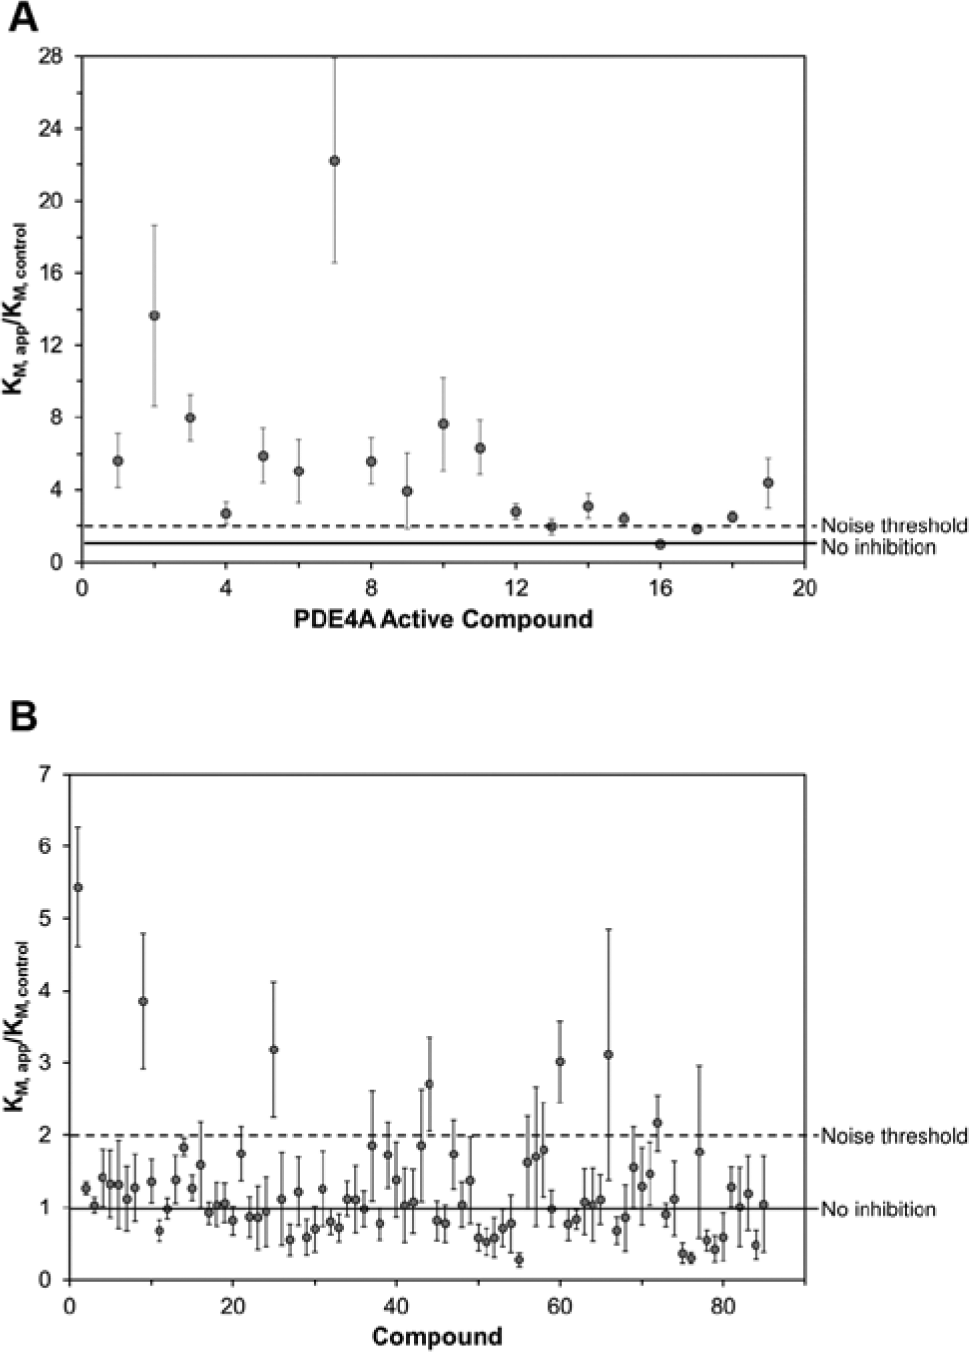
Results of the fragment screen for inhibitors of PDE10A using the calorimetric activity assay. The ratio of the KM in the presence of the fragment (KM, app) to the KM of an associated control reaction (KM, control) is shown. Compounds were tested at 2 mM concentration. For every five compounds, an associated control reaction (no inhibitor) was run and served as the KM control for those compounds. The solid line indicates a KM ratio of 1, which means no effect compared with control. The dashed line indicates a KM ratio of 2, the noise threshold selected for a compound to be classified as a hit. The error bars indicate the standard error of the mean for the KM ratio. (
The activity-based enthalpy array screen with the catalytic domain of PDE10A against an 85-compound fragment library was performed at a compound concentration of 2 mM. Corresponding control reactions in the absence of any inhibitor were performed for every five fragments tested and acted as the basis for comparison of KM values for those five fragments. Figure 1B displays the results of the fragment screen as the ratio of the KM in the presence of fragment (KM, app) to the KM of the corresponding control reaction (KM, control). Seven compounds produced a KM ratio ≥2. These were considered hits, and six of seven were confirmed to have KI ≤2 mM using fresh stocks of fragments and protein and testing using the microcalorimetry assay. The one compound that did not have a KI <2 mM upon retesting (ZT0826) also had a LE lower than 0.3. The KI and LEs for all compounds that produced a KM ratio greater than 2 are presented in Table 2 .
Inhibition constants and ligand efficiencies of inhibitors of PDE10A.
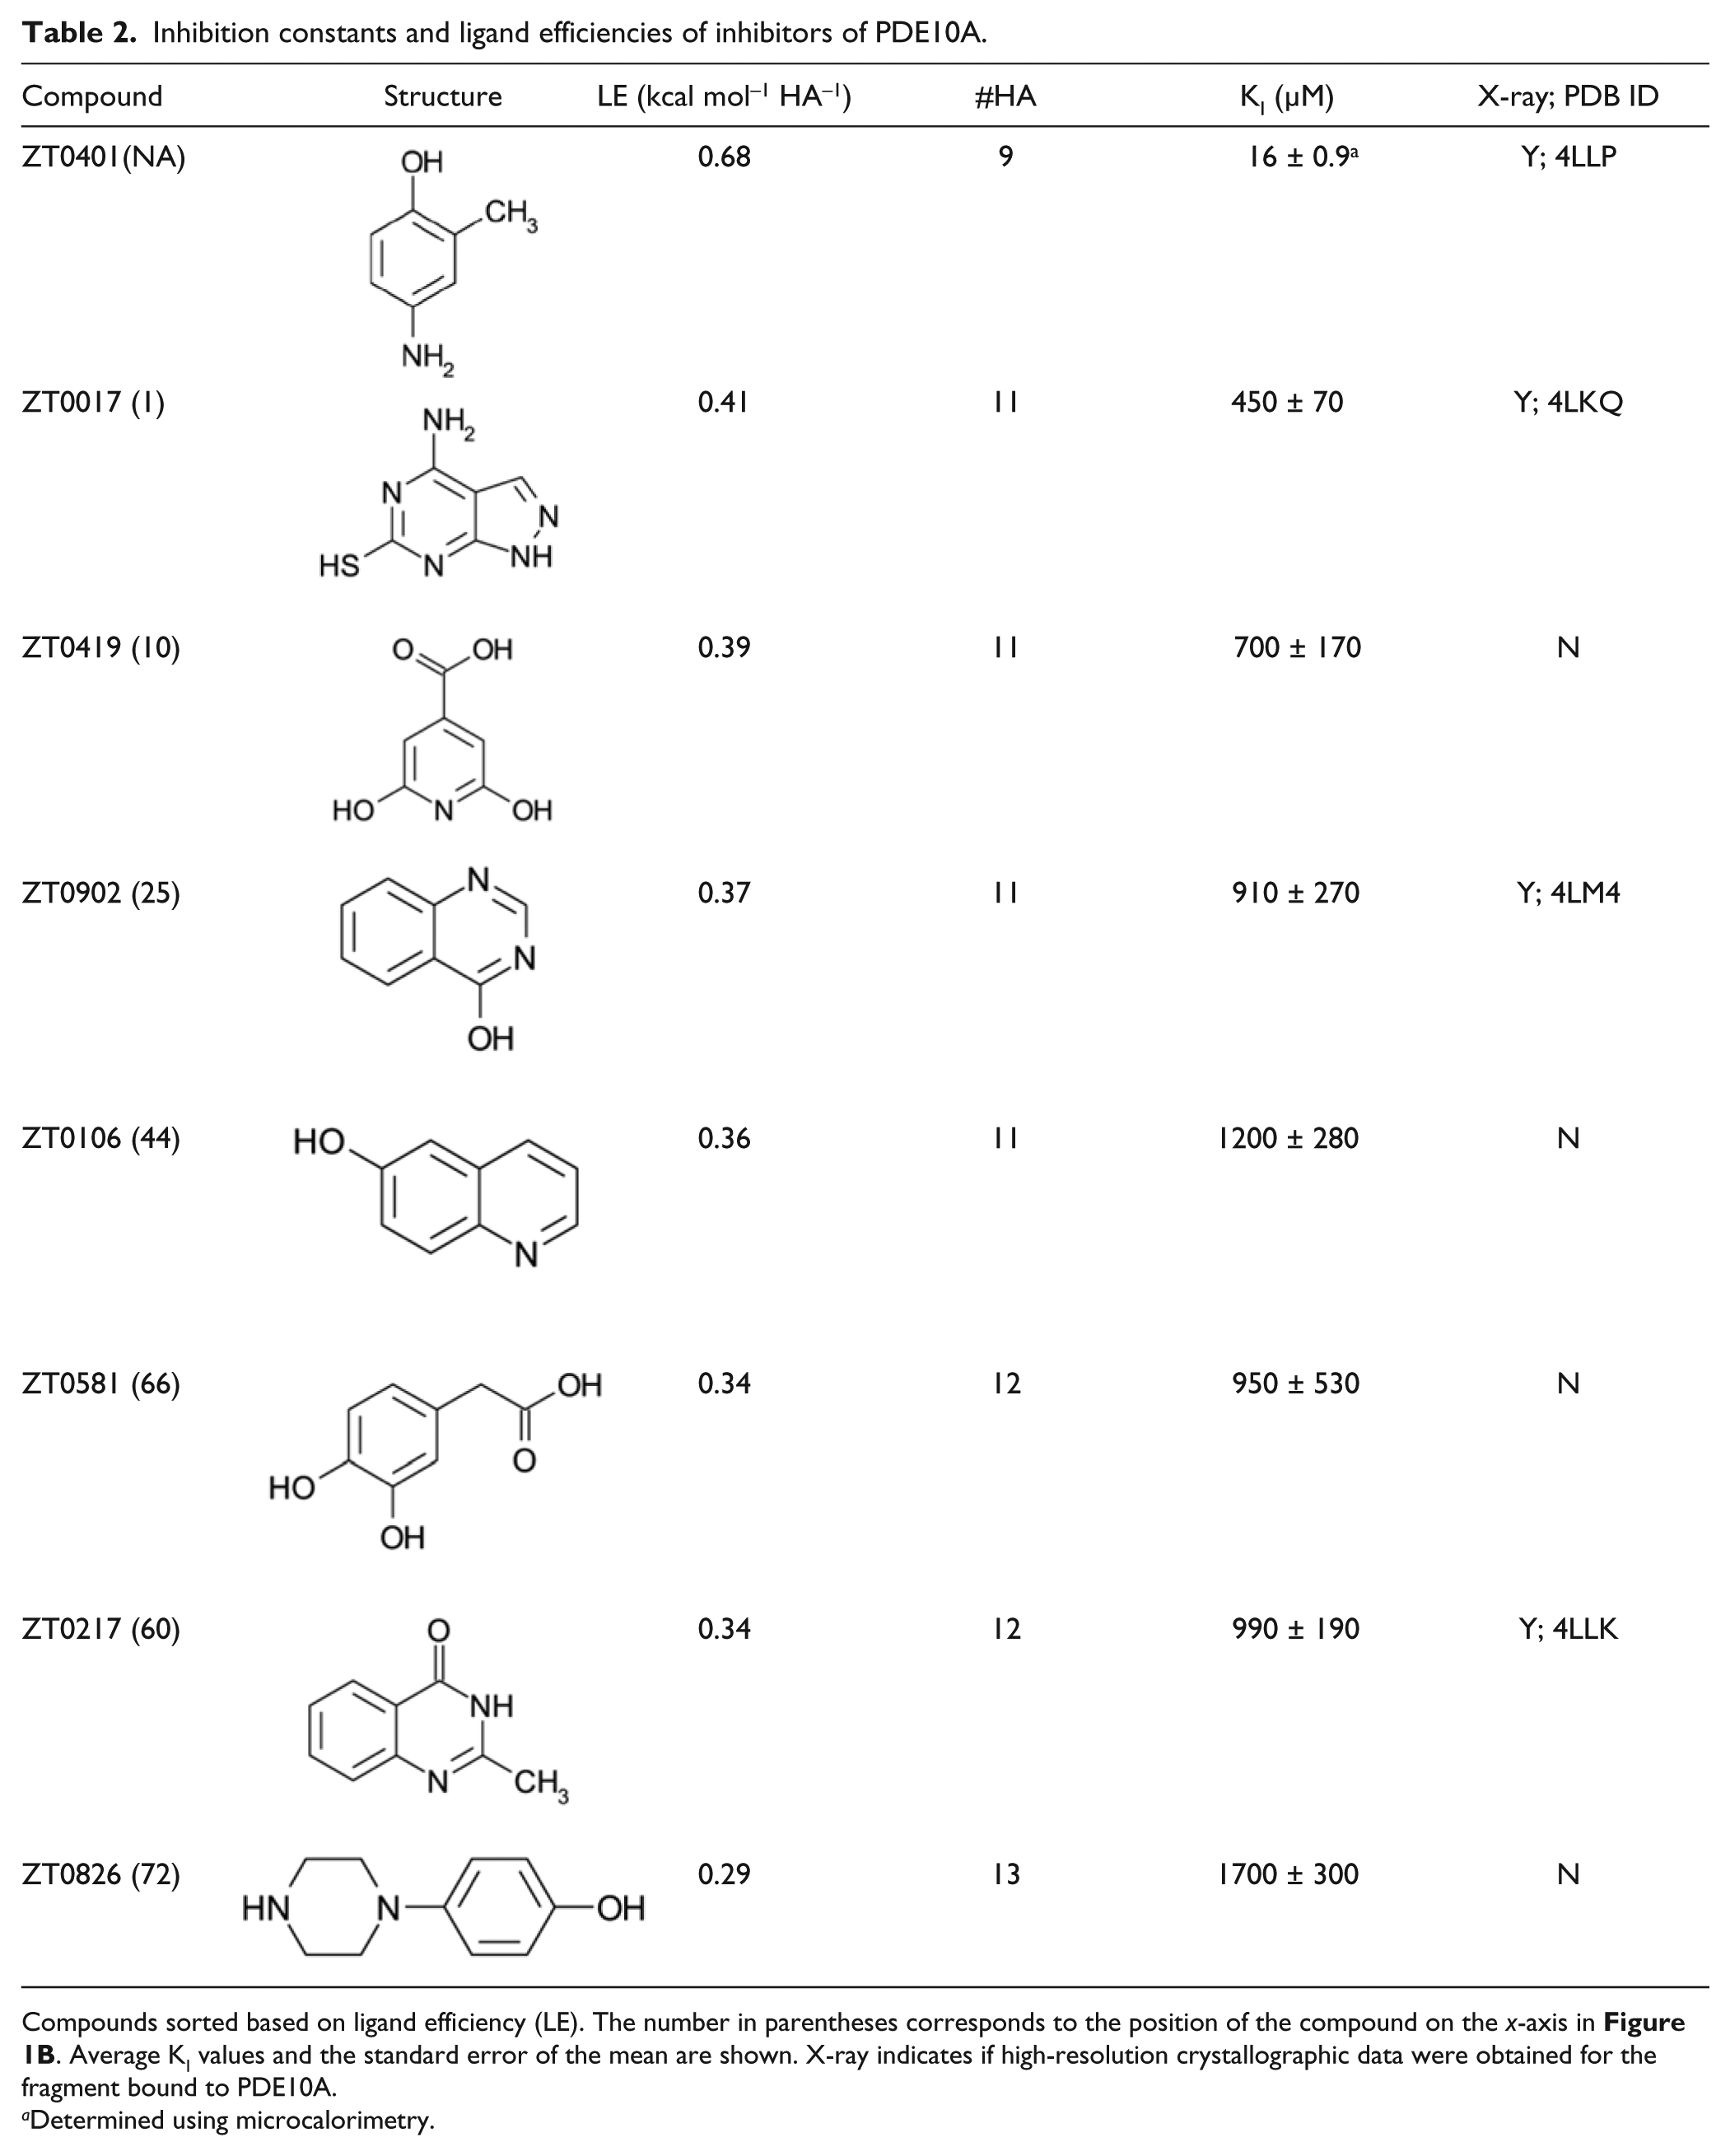
Compounds sorted based on ligand efficiency (LE). The number in parentheses corresponds to the position of the compound on the x-axis in Figure 1B . Average KI values and the standard error of the mean are shown. X-ray indicates if high-resolution crystallographic data were obtained for the fragment bound to PDE10A.
Determined using microcalorimetry.
There was one compound (ZT0401) that produced highly sticky drops on the surface of the enthalpy array, making quantitative analysis of the inhibition data difficult. This compound was tested using the microcalorimeter-based enzymatic assay, yielding the KI and LE data shown in Table 2 .
All eight inhibitors identified in the PDE10A screen as well as the 16 previously identified PDE4A hits were moved into X-ray crystallography studies. As we were able to obtain high-quality apo-PDE10A crystals, soaking experiments were performed and yielded complexes in 16 of 24 cases (66.7%) at the ligand concentration tested (1.25 mM). We obtained co-crystal structures with 4 of the 8 PDE10A inhibitors (50%) and with 12 of the 16 (75%) previously identified PDE4A inhibitors ( Tables 1 and 2 ). We did not attempt additional soaking experiments at higher ligand concentration, as this resulted in crystal cracking.
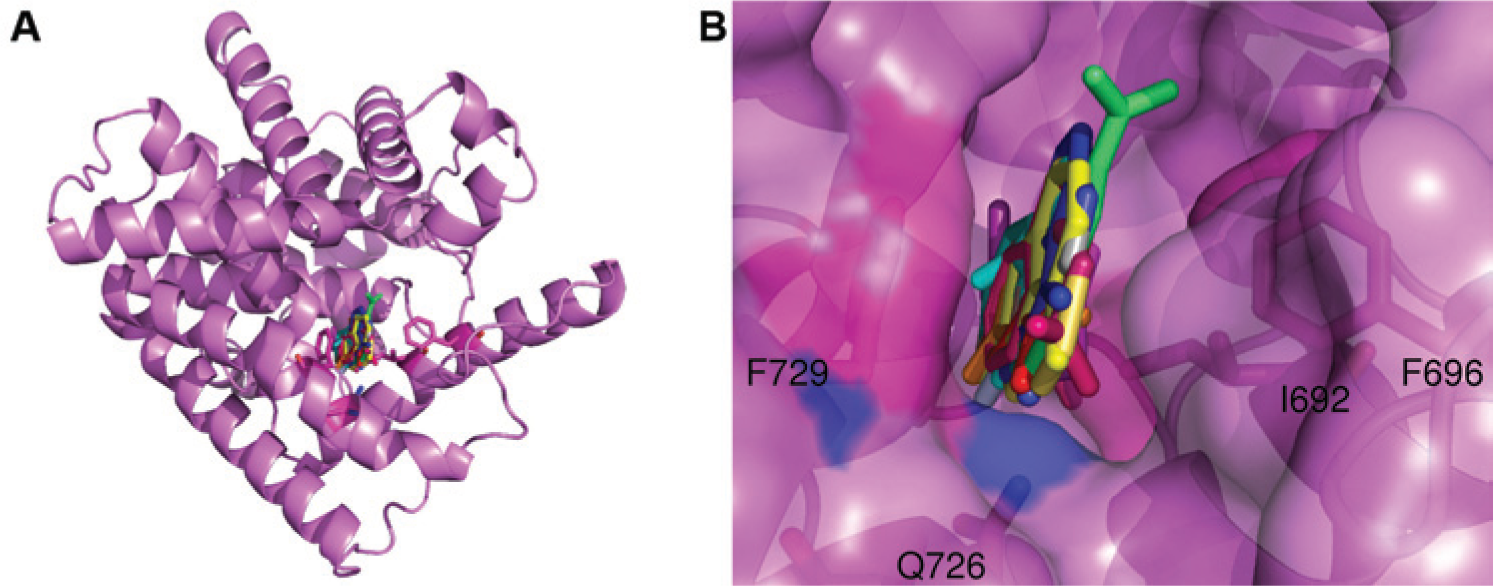
Figure 2 shows a superposition of all the co-crystal structures of fragments bound to PDE10A. All of the fragments bind in the primary binding pocket in PDE10A sandwiched between Phe 729 on one side and Ile692 and Phe696 on the other. Some compounds have hydrogen bond donors or acceptors within standard hydrogen bonding distance of Gln 726. No additional binding sites were identified using our protocol.
(
For PDE10A, a second “specificity” pocket at the active site has been identified, 26 and compounds that occupy this site have been shown to be specific for PDE10A over other PDEs. 1 PDE10A has a unique glycine residue (725) that is typically a larger side chain that blocks this site in other PDEs.
We selected two fragment hits (ZT0143 and ZT0451) to optimize and to occupy the specificity site based on the X-ray structure of the PDE10A complex. To ensure specificity and minimize added molecular weight, we focused on improving the potency of our fragments by growing into the specificity site first. These fragments were selected because they were of reasonable starting potency (~100 µM), LE (>0.4), and had functional groups for chemical modification directed toward the specificity pocket as revealed by their X-ray crystal structures.
Figures 3A and B show the crystal structures of the fragment hit ZT0143 and an optimized compound (ZT1597; PDB ID 4MSE) obtained by growing the fragment into the specificity pocket. The N3 and 2-amino groups of ZT0143 are within standard hydrogen bonding distance to Gln726. The optimized compound has a 2-amino to 2-methyl substitution compared with the original fragment hit, which appears to be tolerated in the binding pocket, as evidenced by the equal potency of compound ZT1608 compared with the original fragment ( Fig. 3C ). The benzothiazole core of the optimized compound rotates compared with the fragment ( Fig. 3B ), moving the N3 beyond standard hydrogen bonding distance to Gln726 but placing the nitrogen of the quinoline moiety within standard hydrogen bonding distance of Tyr693 in the specificity pocket. The single substitution in the specificity pocket leads to a 100-fold improvement in potency. Substituting at either the 4- or the 5-position while maintaining the 2-amino group (ZT1752, ZT1694) did not lead to improved potency compared with the optimized compound ( Fig. 3C ).
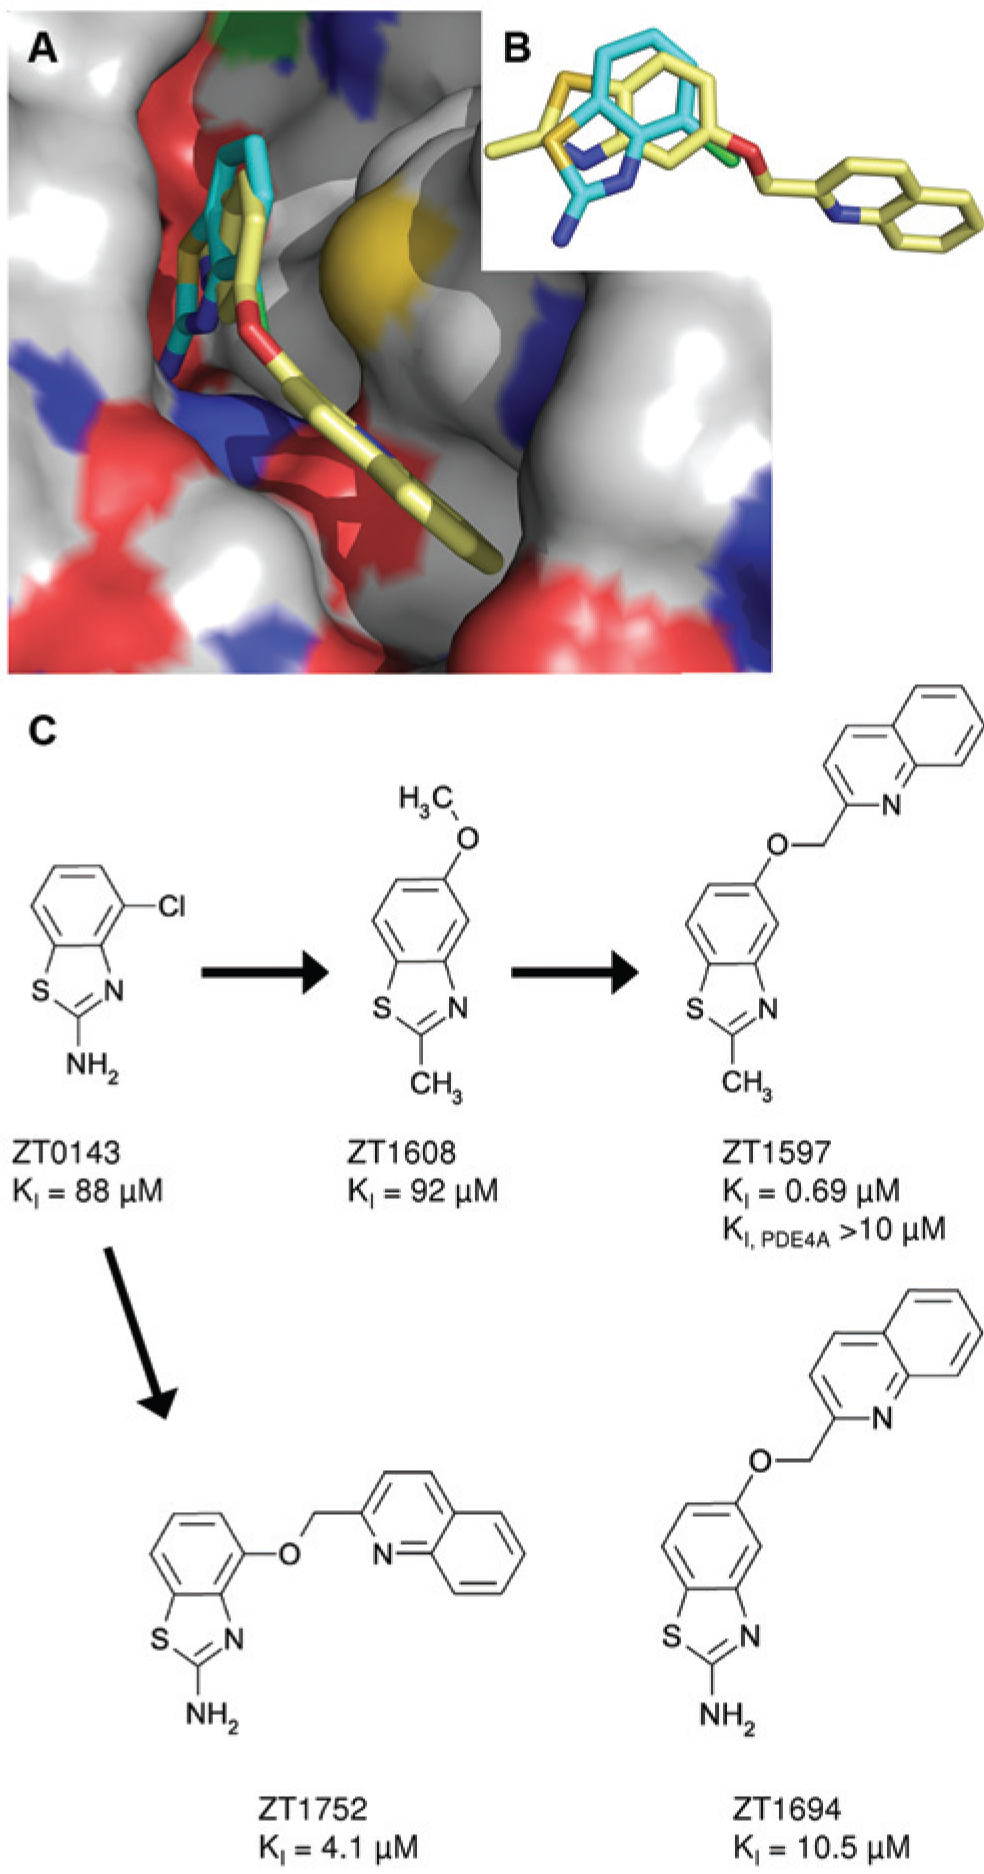
Crystal structures for key compounds derived from fragment ZT0143. (
Crystal structures and optimization of fragment ZT0451 are shown in Figure 4 . The N1 of ZT0451 is within standard hydrogen bonding distance to the side chain of Gln 726, and the 8-nitro group may also make a long hydrogen bond with Gln 726. The optimized compound (ZT1595; PDB ID 4MSC) is substituted at the 7-position, and the quinoline core rotates compared to the original fragment. This rotation places the N1 of the quinoline core beyond the standard hydrogen bonding distance to Gln726 but places the nitrogen of the second quinoline within standard hydrogen bonding distance of Tyr693 in the specificity pocket. Again, the single substitution in the specificity pockets yields an approximately 100-fold increase in potency compared with the fragment hit. Substitutions at either the 8-position (ZT1638, ZT1525) or the 7-position (ZT1595, ZT1598) yield compounds with similar potency ( Fig. 4B ). In all cases, the optimized compounds showed competitive inhibition of PDE10A.
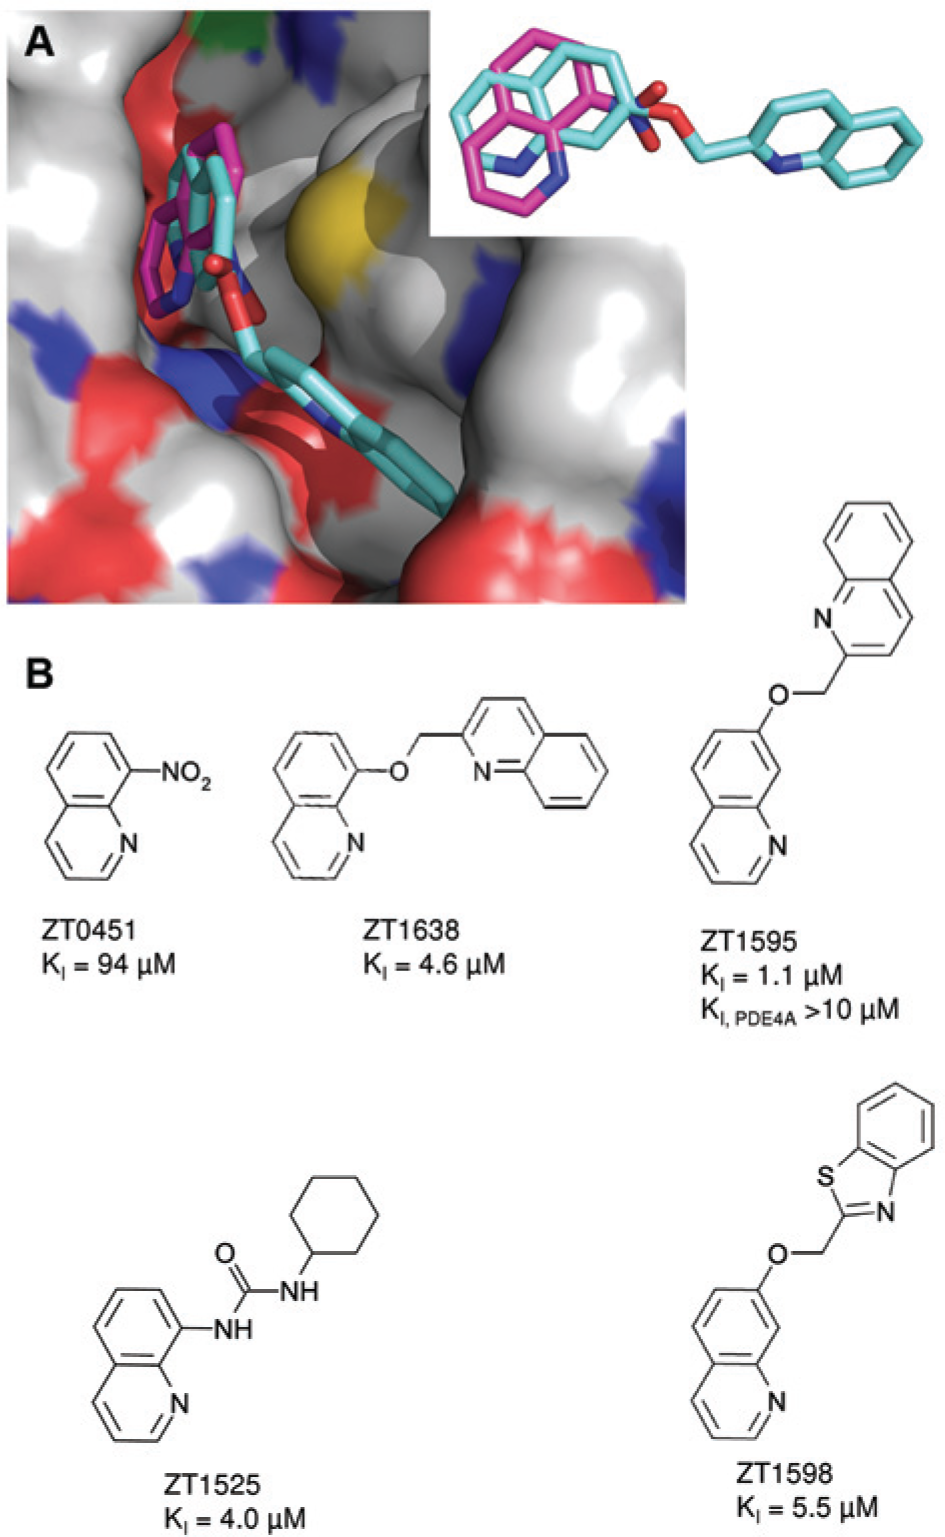
Crystal structures for key compounds derived from ZT0451. (
Both optimized fragments (ZT1597 and ZT1595) show specificity for PDE10A, having at least 10-fold more potency against PDE10A than PDE4A (
Figs. 3
Discussion
We observed that two-thirds of the calorimetrically identified fragment hits yielded X-ray structures. Compared with reports in literature using other techniques (surface plasmon resonance, nuclear magnetic resonance, and fluorescence),27,28 this is a higher proportion of fragment hits yielding X-ray structures. There are several possible explanations for the high proportion of crystallizable fragment hits seen here. First, the compounds in the library have high aqueous solubility, allowing them to be screened at high concentration in the activity assay with 2% residual DMSO and to be soaked at high concentration into the apo protein crystals. Our cutoff for defining a hit is a KI <2 mM and an LE ≥0.3, which selects for relatively potent fragments that are active at a concentration well below their solubility limit. Other researchers will try to crystallize hits with Kd greater than 10 mM and LE lower than 0.3, which may result in solubility limitations being an issue during crystallization trials. Second, the hits act as competitive inhibitors, ensuring that they bind in the substrate binding pocket, which is accessible in the apo protein crystals. In addition, selecting only competitive inhibitors means that the compounds are unlikely to be aggregators (promiscuous inhibitors) 29 and thus provides a way to minimize the number of hits that are non-druglike “nuisance” compounds. Finally, the identity of the protein target is a factor. We obtained high-quality crystals of the apo form of the protein into which fragments could be soaked, which is not always the case. For example, we were unable to obtain X-ray structures of any fragment hits bound to PDE4A, 13 even though we obtained crystals with 75% of the PDE4A active fragments in complex with PDE10A.
Fragments that crystallized had a higher potency on average (KI = 590 ± 94 µM) than those that did not (KI = 1000 ± 140 µM; p = 0.018). Although the p value indicates significance in KI’s of fragments found in crystals compared with those that did not crystalize, use of a threshold to decide which fragments to crystallize is not ideal. For example, using a threshold of 870 µM (average plus 3 sigma) would yield three false-positives (from a total of eight true-negatives) and five false-negatives (from a total of 16 true-positives). Consistent with our observation here, Wielens et al. 28 reported obtaining crystal structures with fragments that “appear to be generally more potent.”
Comparison of other properties of the fragments (LE, calculated logP [clogP], ligand lipophilicity efficiency [LLE], and polar surface area [PSA]) did not yield any statistically significant differences between those that crystallized and those that did not. Therefore, we would favor trying to crystallize all confirmed fragment hits from the activity-based calorimetric assay rather than setting another threshold for moving forward to crystallization trials.
With the availability of X-ray structures of complexes, optimization of fragments can be performed by synthesizing specific structure-based modifications. These modifications include growing the fragment into potential binding pockets (as we have done here) or linking two fragments that bind to nonoverlapping sites in the target.
10
Elaboration of fragment hits into specificity pockets yielded increased potency and specificity for PDE10A over PDE4A (
Figs. 3
For initial screening, enthalpy arrays can be used to identify hits with inhibition constants as low as 2 mM, but the technique is not well-suited to characterization of potent inhibitors. As previously observed, the lower limit for which KI can be reliably determined is 1/50th of the enzyme concentration. 16 For assays with PDE10A, which was present at 15 µM in the final reactions, the limit on accurate determination of KI is 300 nM. As it is unlikely that a fragment will bind with this level of potency, the enthalpy array method is ideal for the initial fragment screen. More potent compounds may be tested using a conventional microcalorimeter. The lower enzyme concentration (100 nM) used in these assays still yields good signal-to-noise and extends the limit of KI determination down to the single-digit nanomolar range. Alternatively, for this level of potency, more conventional activity assays are accurate and would most likely be used at this point of the discovery program.
In principle, one could perform an activity-based fragment screen using an automated conventional microcalorimeter such as the MicroCal Auto iTC200. The advantage of this technique over the enthalpy arrays is the higher sensitivity and ability to accurately measure KI over a broader range (~10 nM to ~2 mM for microcalorimetry compared with ~500 nM to ~2 mM for the enthalpy array). 30 The tradeoff of using a lower enzyme concentration is that it takes about 30 min to run each reaction, limiting the throughput to a little more than 20 compounds per day. One could increase the throughput by raising the enzyme concentration by a factor of 2 to 3, but this solution has two limitations: first, for substrates with KM values less than 1 µM (such as 3′,5′-cAMP with PDE10A), one loses the ability to measure KM (and therefore KI of competitive inhibitors) with high accuracy because the rate at which the reaction decays as the substrate concentration drops below the KM occurs on a time scale that is fast compared with the instrument response time (~10 s). Second, the maximum differential power signal (P = ΔH*kcat*[E]*volume) that can be recorded (12 µcal/s) may be exceeded by having the reaction occur at too high a rate. For initial screening, smaller libraries of a few hundred compounds, Auto iTC200 would be a viable option.
Using calorimetry to prescreen fragments for inhibition of enzymatic activity has several benefits: First, only 10% of the fragments showed inhibition and were subsequently fed into the X-ray crystallographic secondary screen. This significantly reduced the number of structural characterizations, resulting in savings in labor and material costs. Second, the prescreening data show which compounds have an effect on the activity of the enzyme and their inhibition mechanism, indicating that a fragment is binding to a site of functional interest rather than simply binding. Finally, because calorimetry is a label-free technique, the assay is resistant to compound interference that can occur with fluorescence- or absorbance-based enzymatic activity assays. When combined with a structural technique, such as X-ray crystallography, calorimetry is an effective method to improve the efficiency of fragment-based drug discovery for enzyme targets.
Footnotes
Acknowledgements
We thank Rick Walter and Gina Ranieri (Shamrock Structures) for data collection at the Advanced Photon Source and the Canadian Light Source. We thank Nicholas Nguyan for assistance with equipment at the UCSD Biomolecule Crystallography Facility.
Declaration of Conflicting Interests
The authors declared the following potential conflicts of interest with respect to the research, authorship, and/or publication of this article: Michael I. Recht and Francisco E. Torres are employed by Palo Alto Research Center Incorporated. All other authors are employed by Zenobia Therapeutics.
Funding
The authors disclosed receipt of the following financial support for the research, authorship, and/or publication of this article: This work was supported by grant R01EB009191 from the National Institute of Biomedical Imaging and Bioengineering, National Institutes of Health (NIH). Its contents are solely the responsibility of the authors and do not necessarily represent the official views of the NIH.
References
Supplementary Material
Please find the following supplemental material available below.
For Open Access articles published under a Creative Commons License, all supplemental material carries the same license as the article it is associated with.
For non-Open Access articles published, all supplemental material carries a non-exclusive license, and permission requests for re-use of supplemental material or any part of supplemental material shall be sent directly to the copyright owner as specified in the copyright notice associated with the article.