
Abstract
Compound mechanism-of-action information can be critical for drug development decisions but is often challenging for phenotypic drug discovery programs. One concern is that compounds selected by phenotypic screening will have a previously known but undesirable target mechanism. Here we describe a useful method for assigning mechanism class to compounds and bioactive agents using an 84-feature signature from a panel of primary human cell systems (BioMAP systems). For this approach, a reference data set of well-characterized compounds was used to develop predictive models for 28 mechanism classes using support vector machines. These mechanism classes encompass safety and efficacy-related mechanisms, include both target-specific and pathway-based classes, and cover the most common mechanisms identified in phenotypic screens, such as inhibitors of mitochondrial and microtubule function, histone deacetylase, and cAMP elevators. Here we describe the performance and the application of these predictive models in a decision scheme for triaging phenotypic screening hits using a previously published data set of 309 environmental chemicals tested as part of the Environmental Protection Agency’s ToxCast program. By providing quantified membership in specific mechanism classes, this approach is suitable for identification of off-target toxicity mechanisms as well as enabling target deconvolution of phenotypic drug discovery hits.
Keywords
Introduction
Phenotypic drug discovery (PDD) relies on the use of complex biological assays, either animal models or cell-based assays, for the screening and selection of potential new drugs. PDD programs are an attractive complement to target-based drug discovery programs. 1 Compounds identified by PDD are often more likely to be active in vivo, and by providing new biology, PDD programs can contribute diversity and innovation to drug discovery portfolios. 2 For these programs, however, the lack of molecular target information can be a liability, as this information is considered important for the design of preclinical and clinical studies and for managing safety risks. It is also important to rule out known or undesirable mechanisms early in a program before large expenditures are made. Thus, technologies that can help identify compound mechanisms of action will be useful to PDD programs.
We have previously described a platform of primary human cell–based assays (BioMAP systems) for phenotypic drug discovery.3 –5 These assays contain a diversity of early passage primary human cell types, including endothelial, epithelial, fibroblast, smooth muscle, and immune cell types, with individual assay systems covering tissue and disease biology of the vasculature, skin, lung, stromal, immune, and inflammatory tissues. Compound profiles are generated by measuring changes in the levels of a set (8–12) of biomarkers (proteins, mediators, known disease risk factors, etc.) in each system. Several data sets of compound activity profiles generated in panels of 4 to 8 BioMAP systems have been previously published.3 –7 Agents tested include well-characterized compounds with known and unknown mechanisms of action, approved and failed drugs, and environmental chemicals. In addition to these published studies, we have been profiling compounds for pharmaceutical companies, academic collaborators, and the US government for a number of years. These include small molecules from various target-based and phenotypic drug discovery programs, compounds from diversity and focused libraries, natural products collections, biologics, and nanomaterials.5–9 BioMAP profile signatures have been shown to distinguish compounds based on the mechanism of action (MoA) and target selectivity, and BioMAP activities have been correlated to in vivo biology.3–6,10 –12
In previous work, we have generated MoA hypotheses from unsupervised searches of a reference database using BioMAP profile signatures. However, while this approach generates testable hypotheses, it requires expert review of results and does not quantify the significance of mechanism assignments. An automated method using machine learning can help mitigate these limitations but requires a large reference data set. In this article, we take advantage of a reference database of compound activity profiles to build predictive models for 28 mechanism classes with a support vector machine (SVM) approach. For this effort, we prioritized those mechanisms that were frequently identified as hits in phenotypic screens and for which we had profile data from well-characterized, selective compounds.
Here we present our approach for building these models, their performance with respect to a reference compound data set, and results from the application of these models to an example data set, the ToxCast phase I chemicals profile data set that has been previously published. 7 We show the use of these models in a decision scheme developed for triaging compounds selected from phenotypic screens. We also show how these models can be used to automatically classify toxicity mechanisms and compare these results with a previous study that used a manual approach. 7 By combining the broad coverage of pathway and target biology found in complex primary human cell–based assay systems with an efficient and automated way of classifying resulting biomarker activity patterns, this approach could prove valuable in the evaluation and rapid prioritization of hit and lead compounds identified from phenotypic drug discovery programs.
Materials and Methods
BioMAP Systems
BioMAP systems employed (Diversity 8 panel of BioMAP systems) are shown in
Compounds
Reference compounds used for building SVM models are listed in Table 1 . The ToxCast phase I chemicals and data set have been previously published. 7
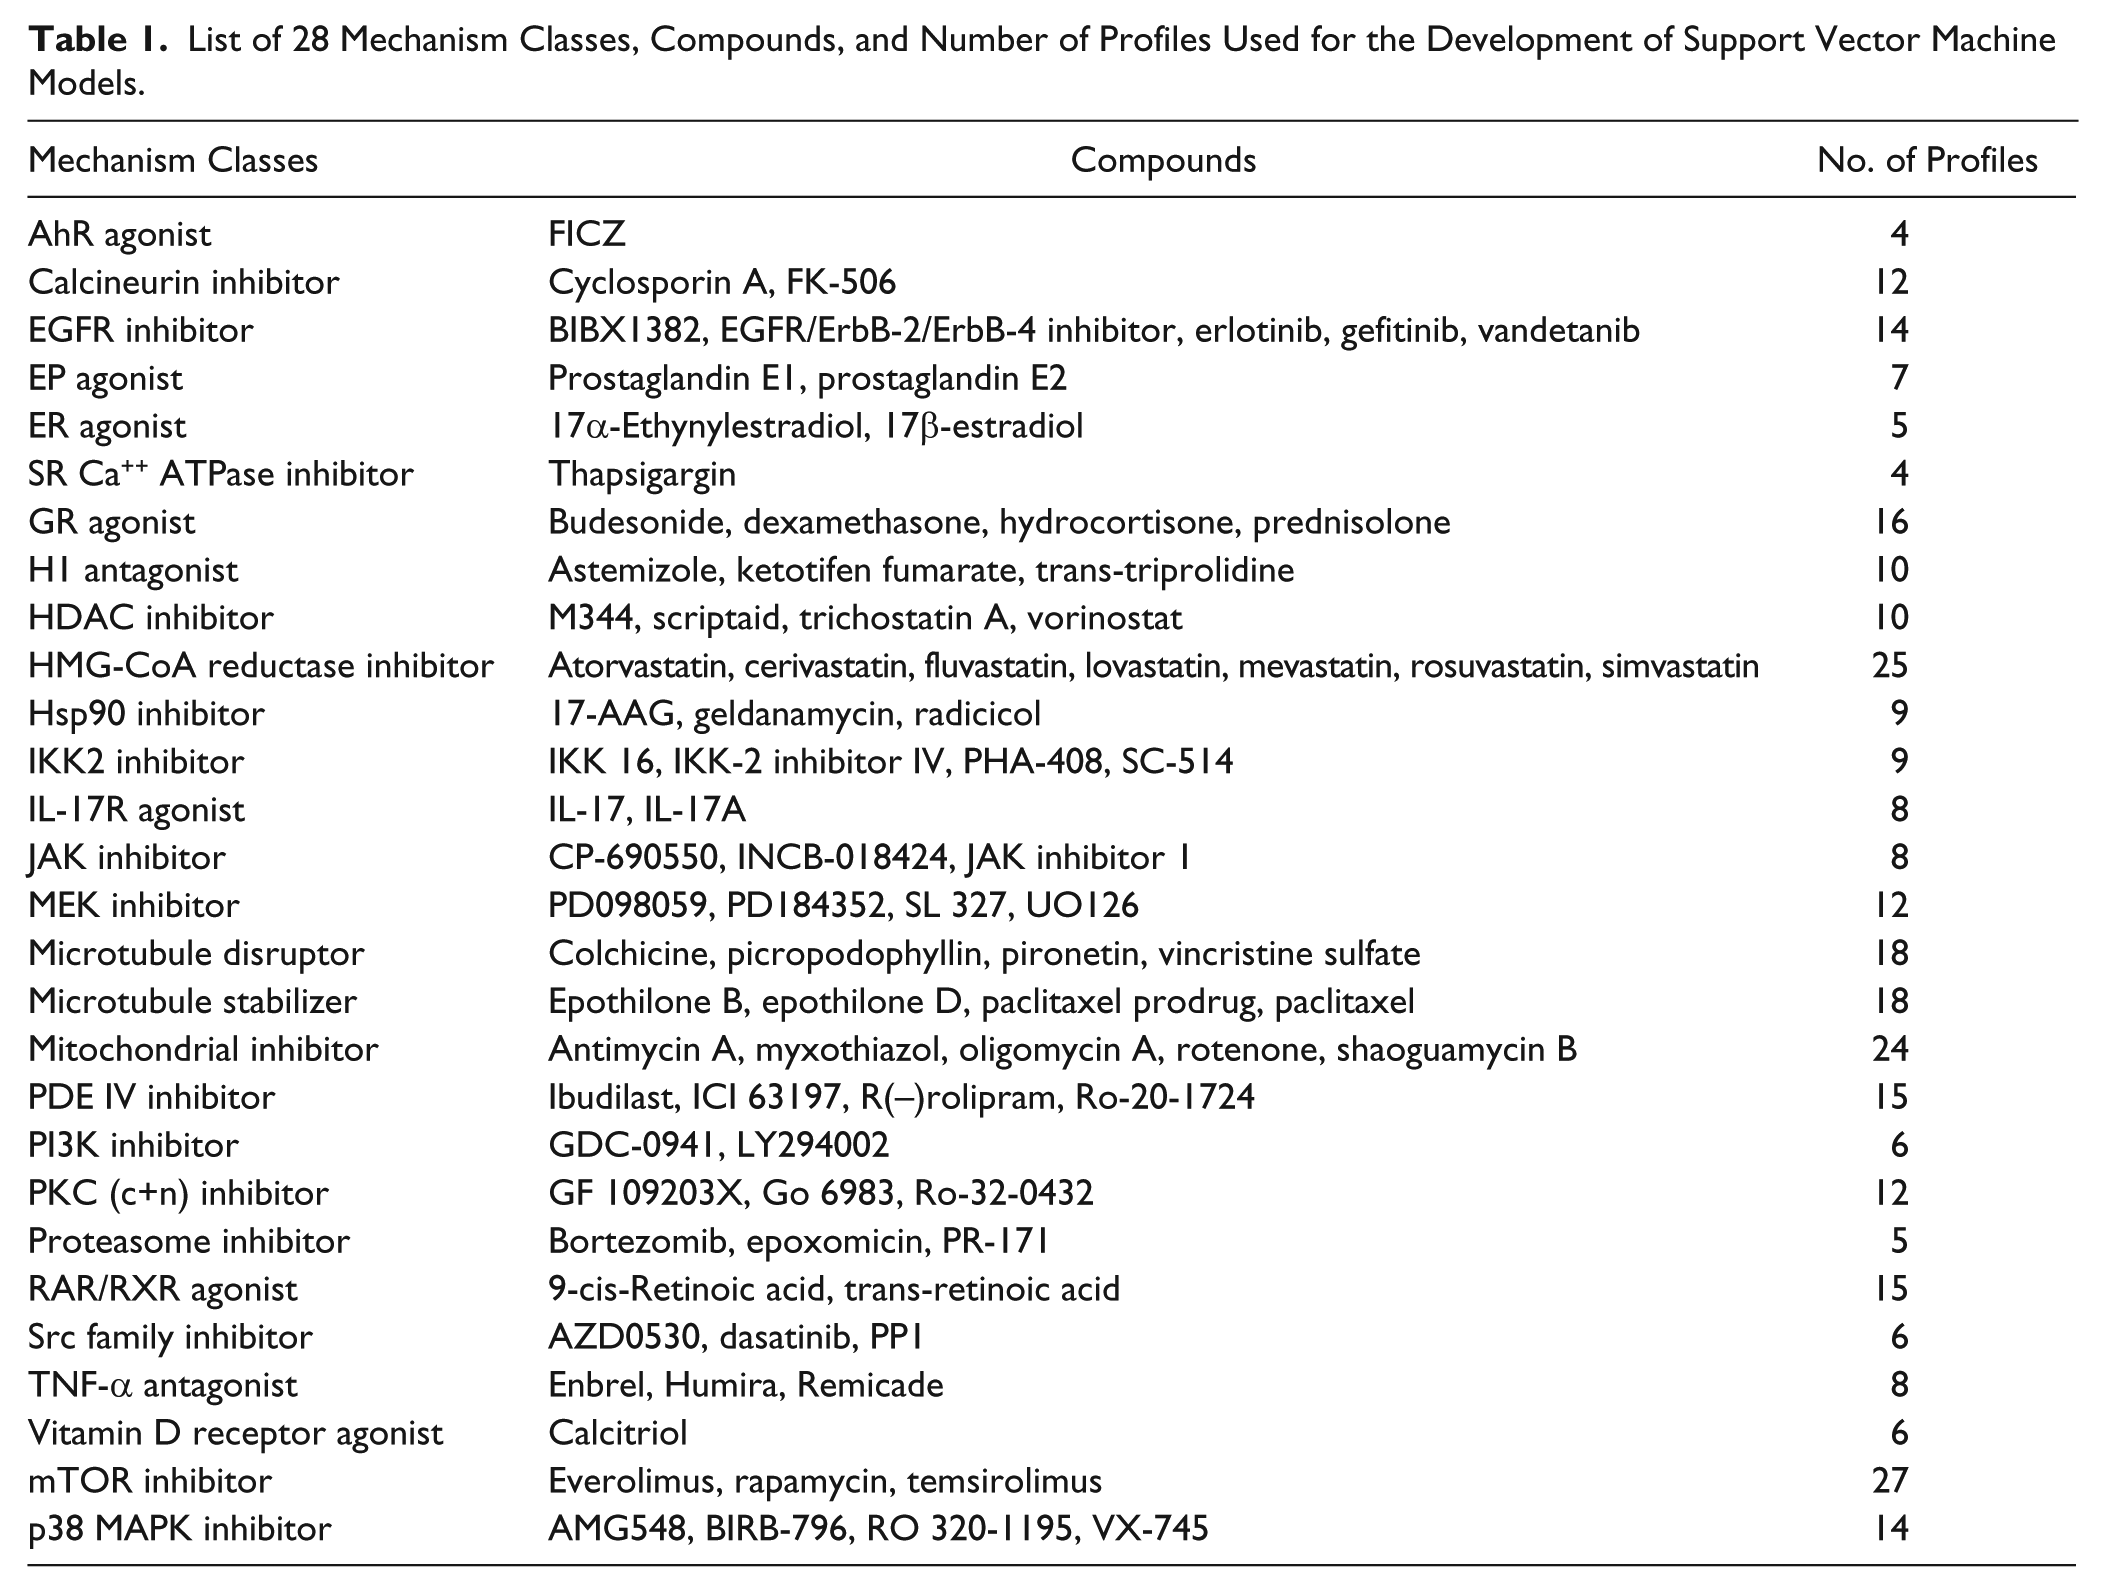
List of 28 Mechanism Classes, Compounds, and Number of Profiles Used for the Development of Support Vector Machine Models.
Selection of Data for SVM Models
For each mechanism class, where possible, multiple compounds from structurally distinct chemical classes were employed, and for all classes, profiles generated from compounds tested at more than one concentration were included. Selection of data is further described in
Building SVM Models
Predictive models for 28 mechanism classes ( Table 1 ) were built using a two-class approach with SVM. 13 SVM was selected as this method gave the best performance among a number of machine-learning algorithms that were tested, including lasso, random forest, gradient boosting method, and linear discriminant analysis14–17 (data not shown).
The R SVM package e1071 (www.r-project.org) was used to build the SVM models for each mechanism class. Based on performance testing using cross-validation with reference and other data, the key variables for building SVM models were determined to be (1) row (profile) normalization of both model and test data with no column (marker) normalization, (2) selection of linear kernel, and (3) cost set to 500, resulting in a small increase in positive predictive value (PPV) and a decrease in sensitivity. Other parameters were set to default values.
There are several different ways to employ SVM to build predictive models in our case. These include “one class versus the rest of the classes,” “one class versus zero (or null) class,” or a “multiclass classification mode,” where for k classes, k(k – 1)/2 number of “one versus one” binary classifiers are trained, and the appropriate class is assigned by a voting scheme. When evaluating the approach of “one class versus the rest of the classes,” testing against external data sets revealed that a greater number of models performed very poorly. We did not test the multiclass classification mode, given that the number of classes is large (k = 28 in our case), and building k(k – 1)/2 number of “one versus one” binary classifiers quickly becomes unwieldy. In addition, the number of classes would be continuously growing as we generate data on more compounds and add additional classes to our set. Thus, in the current study, the mode of “one class versus zero (or null)” was selected as the most appropriate method. For the “null” class, we randomly generated a set of weak profiles using control data (log10 ratio values within the 95% significance envelope of the controls). In cases where profiles generated from the same compound but at different concentrations gave different mechanism classes, separate SVM models were built as “one class versus the other class (or classes)” and profiles retested. The few missing values in the reference data set were filled in using the KNNimpute method from the R package imputation.
Criteria for Assigning Mechanism Classes to Profiles
For assigning mechanism classes to compound profiles at each concentration tested, individual profiles were tested against each of the 28 class models. The resulting decision value (DV) against each model was calculated as described, 13 with DV reflecting the distance from the hyperplane separating the two classes (in this case, the selected mechanism class vs. the null class). Support vectors of the positive class (subset of the positive class profiles) have decision values near 1. Any DV >0 indicates class membership; however, as DV increases, confidence in class membership will increase.
For each test profile, however, there may be more than one class that gives a DV >0. In these cases, the class with the highest DV becomes the predicted class. The performance of this scheme (“largest DV = assigned class”) was tested using cross-validation on reference profiles, where 10% of the profiles (“test profiles”) from each class were set aside, and the remaining 90% of profiles from each class were used to build models. Then, the set-aside “test profiles” were evaluated and assigned according to the “largest DV = assigned class” scheme. From the results, measures of performance (PPV = TP/(TP + FP), where TP = true positive and FP = false positive) and sensitivity (=TP/(TP + FN), where FN = false negative) were calculated (see Results).
As described above, the process of generating the “null” class, randomly generated as a set of weak profiles using control data, introduces some variance to the decision values obtained each time a prediction is run. The standard deviation of multiple runs was 0.005. Thus, in cases where multiple classes gave DV >0, we required that the difference between the highest DV and second highest DV be >0.03, which represents six standard deviations for class assignment.
Criteria for Assigning Mechanism Classes to Compounds
Once compound profiles at each dose were classified using the “largest DV = assigned class” decision scheme described above, each compound was assigned to a single class if, for that compound, (1) all classified doses (number of doses >1) were assigned to the same class, or (2) only one dose was classified but with DV >0.5. Compounds were also assigned to a single class if profiles at different doses were assigned to different classes, but further testing of these profiles with an SVM model built as “one class against the other class (or classes)” resulted in DV >0, the highest of which were for the same class. If further testing still resulted in different classes for different doses, the compound could not be assigned to a single class, and profiles at different concentrations were assigned separately. This situation could arise when a compound is found to have a secondary target at higher concentrations.
Results
Development of Predictive Models for 28 Mechanism Classes Using SVM
In previous studies designed to identify compound MoA from BioMAP profiles, we used unsupervised searches of a reference data set of compounds with known mechanisms to generate MoA hypotheses.
7
Although useful, this approach requires manual expert review of the results and does not provide a measure of confidence in the results. Thus, we were interested in developing an automated and more quantitative approach, such as that provided by machine learning. To build predictive models, we compiled a data set consisting of reference compounds specific for each of 28 mechanism classes (
Table 1
). Mechanism classes were selected on the basis of (1) their frequent occurrence as hits in phenotypic screens, (2) the availability of selective inhibitors or ligands, and (3) the existence of sufficient profile data in our reference database. Compounds were tested in a panel of eight BioMAP systems (
As shown in the network graph in
Figure 1
, many of the mechanism classes were easily distinguished, occupying distinct areas of the graph. In this figure, the average mechanism class profiles (calculated by averaging the values for each biomarker end point for all class profiles, as described in Materials and Methods and
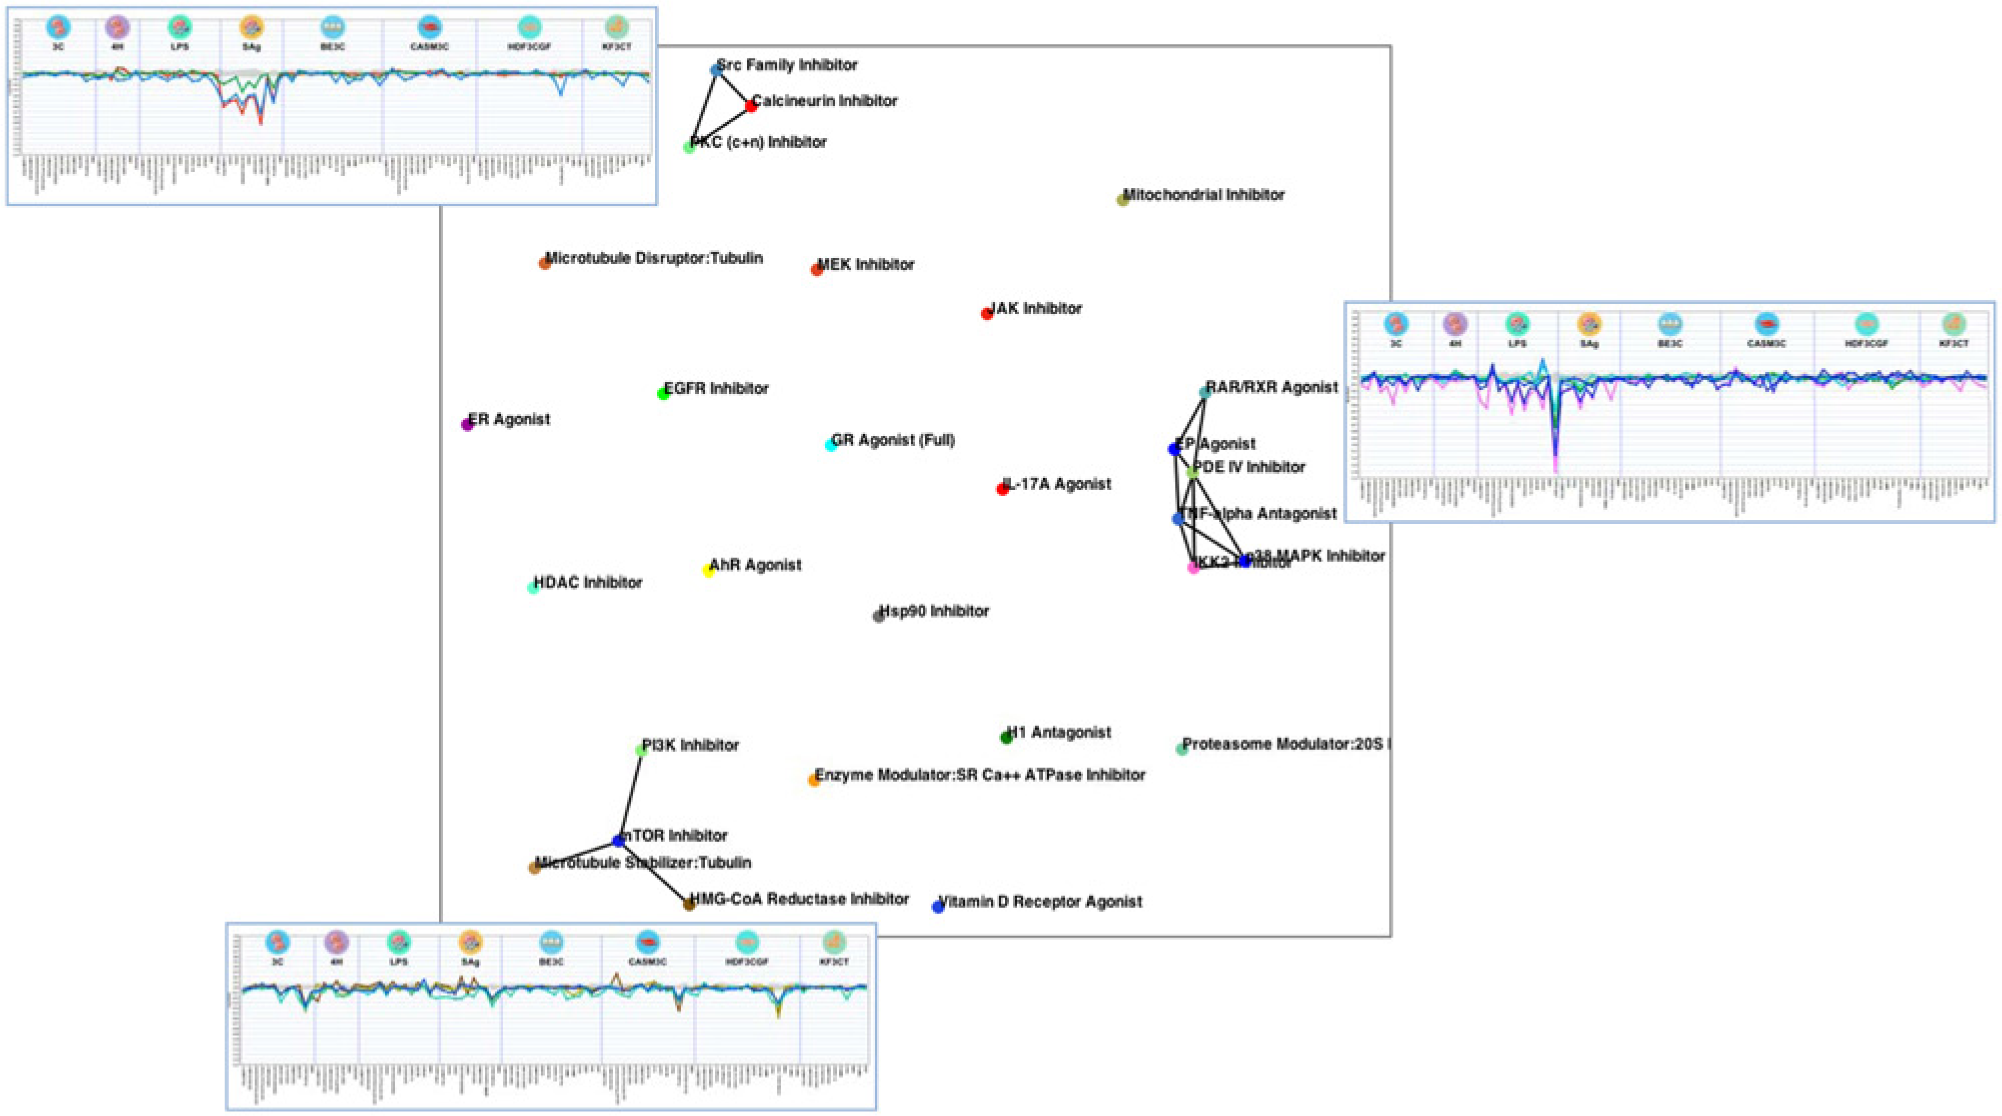
Function similarity map of mechanism class profiles. Mechanism class profiles were generated by averaging profiles as described in Materials and Methods. The 28 mechanism class profiles were compared pairwise and correlations analyzed and subjected to nonlinear projection (see Materials and Methods). Profiles similar to one another are close together in the graph (in clusters), and profile similarities above the selected correlation threshold value (Pearson’s correlation of r > 0.8) are shown as connected lines or edges. Profiles are labeled by their mechanism model name. Profile plots are shown for clustered mechanisms. These include mechanisms that selectively target T-cell activation (top left) or monocyte activation (right) or show antiproliferative effects (bottom).
The reference data set described above was then used to build 28 predictive models, or classifiers, for each mechanism class using an SVM approach (see Materials and Methods). We evaluated several machine-learning algorithms on test data sets (see Materials and Methods). Since SVM gave the lowest cross-validation error rate, this method was selected for further evaluation. SVM has been used extensively for microarray gene expression analysis, including classification of tumor samples.18,19
As described in Materials and Methods, SVM models were built as “one class versus zero (or null class)” models, and separate compound profiles for each dose were tested for membership in any of the 28 mechanism classes. The zero or null class was built by randomly generating profiles from data points within the 95% significance envelope of control data. Test profiles were assigned according to the DVs, which are metrics generated by each model, and profiles could be assigned to a class if DV >0, or in cases where multiple classes gave DV >0, profiles were assigned to the class yielding the largest DV (see Materials and Methods).
Performance of SVM Models and Assignment by Largest DV
The performance of each model, by assigning class according to the largest DV with DV >0, was tested using cross-validation on reference compound profiles as described in Materials and Methods. The performance metrics—PPV, a measure of precision, and sensitivity—were calculated for each model (see Materials and Methods). For 24 of the 28 classes, PPV was equal to 1 (PPV = 1) at DV >0, such that for test profiles in these 24 classes, assignment by largest DV always made the correct classification. For only four classes—the calcineurin inhibitor, Hsp90 inhibitor, PI3K inhibitor, and EP agonist classes—the PPV was <1 for DV >0 (PPVs were 0.93, 0.85, 0.84, and 0.85, respectively, at DV >0). Performance curves for selected models are shown in
Figure 2
, and performance curves for all models are shown in
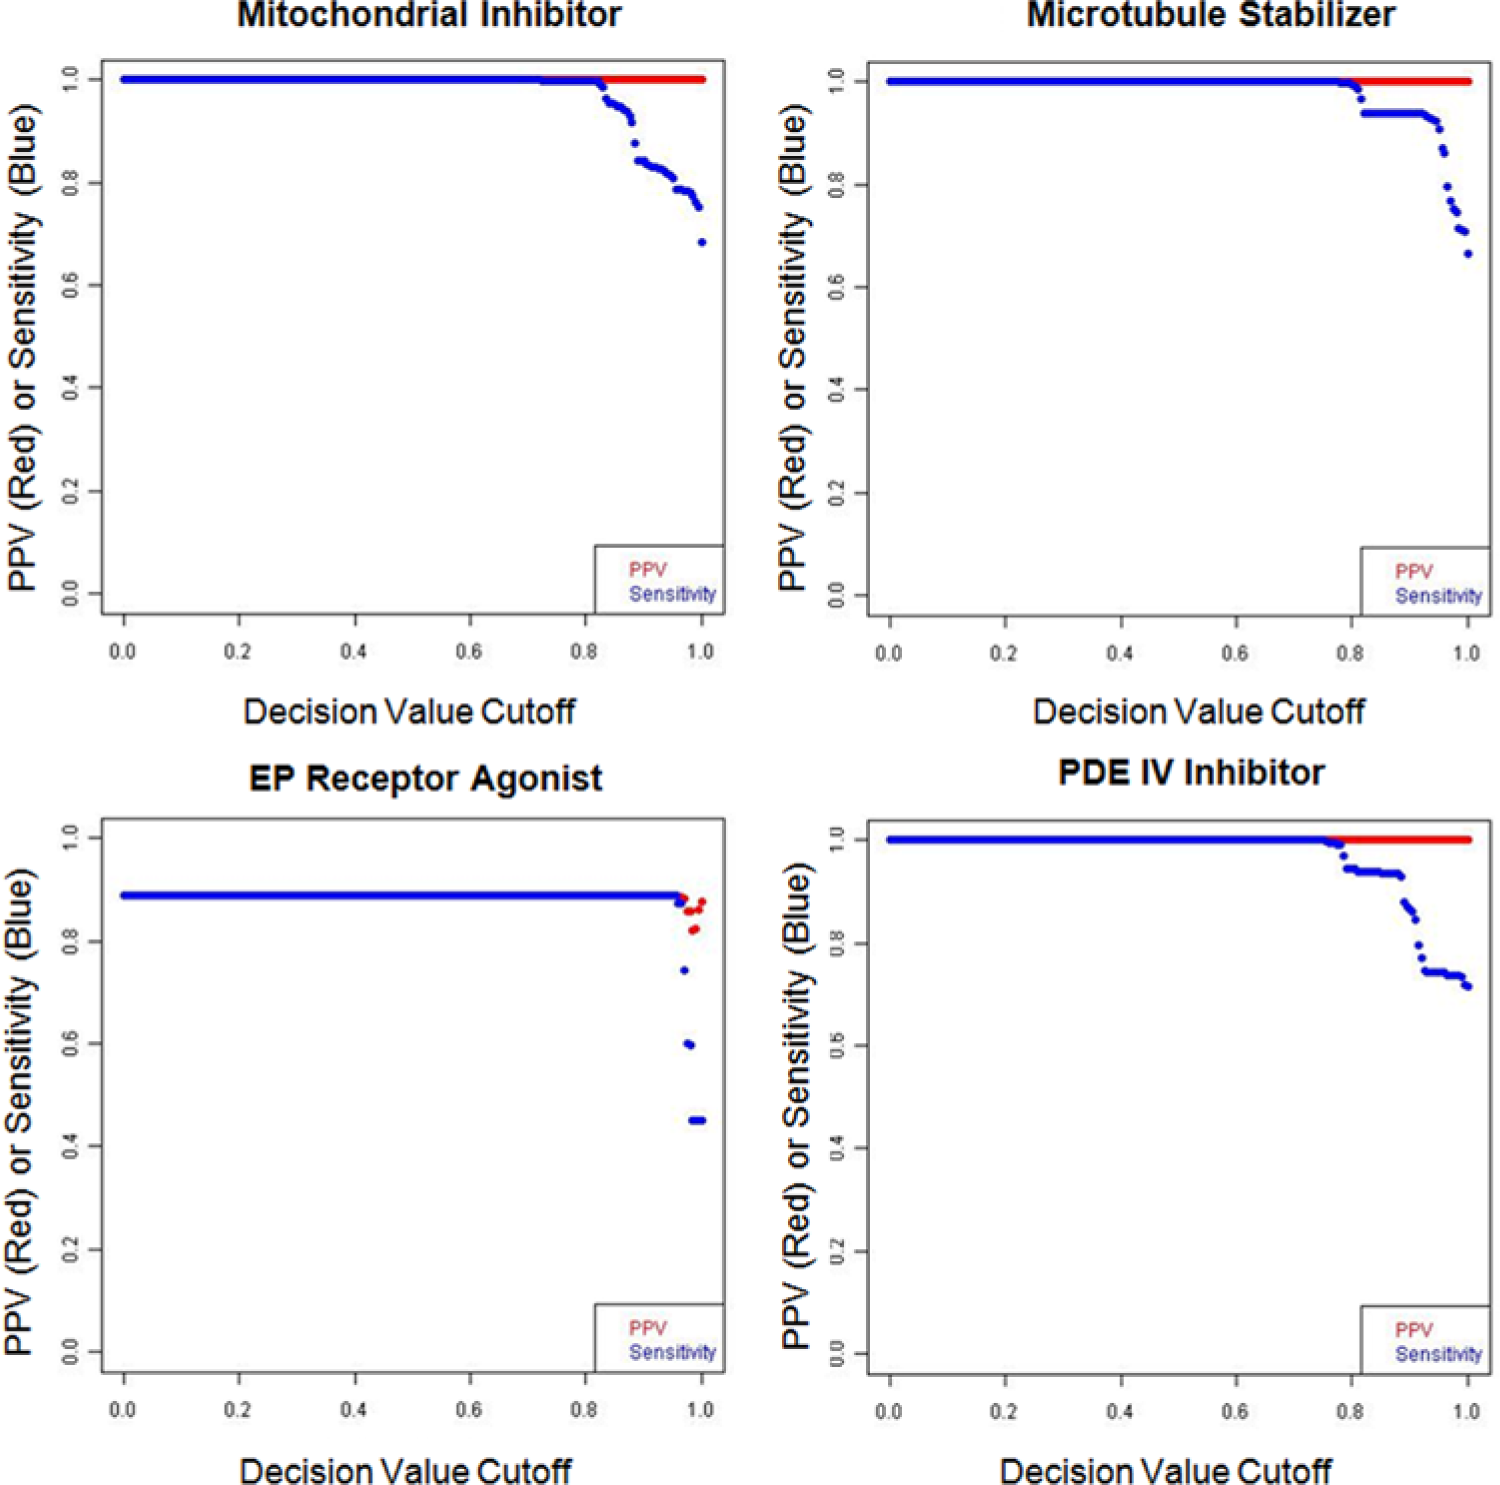
Performance of selected support vector machine (SVM) models based on reference compound profiles. Reference compound profiles were tested on each SVM model using 10-fold cross-validation, and the positive predictive value (PPV) and sensitivity were calculated at increasing decision values (DVs). PPV = TP/(TP + FP) and sensitivity = TP/(TP + FN), where TP = true positives, FP = false positives, and FN = false negatives. Methods for building SVM models and 10-fold cross validation are described in Materials and Methods. Performance curves for all SVM models are shown in
From the 10-fold cross validation results, we also examined the differences in DV in cases where multiple classes gave DV >0. For test profiles of the EP agonist class, 10% of profiles had DVs where the difference between the highest and next highest DV was <0.03. In most of these cases, the next highest DV was PDE IV, consistent with the finding that these two classes are difficult to separate. The differences between highest and next highest DVs for test profiles of other classes were much larger, and for 24 of the 28 classes, none were <0.03.
Application of SVM Models to an External Data Set
To explore the utility of these models with an example external data set, we tested a previously published data set, the ToxCast phase I data from 309 environmental compounds. 7 This data set is useful for illustrating two applications of the SVM models. First, this set of compounds is not designed to be pharmaceuticals and so can be viewed as a small bioactive collection and used to illustrate the application of a decision scheme that we apply for triaging phenotypic drug discovery hits. Second, since several of the SVM model mechanisms are associated with toxicities, these models may be useful for automated classification of compounds at specific concentrations into known toxicity mechanism classes.
Application of SVM Models for Triaging Phenotypic Hits
As an example data set, we processed the previously published ToxCast phase I data according to the decision scheme for triaging phenotypic drug discovery hits shown in Figure 3 . The criteria in this scheme are stringent so as to focus resources only on the most promising compounds. First, overtly toxic compounds, those for which one or more concentrations resulted in cell death in one or more systems (as defined in Materials and Methods), were identified and removed. Next, inactive and weakly active profiles (in this case, profiles having bit counts <14, as described in Materials and Methods) were removed. Finally, to identify the best compounds to move forward, we tested the remaining compounds for “dose resistance.” Dose-resistant compounds generate mathematically similar profiles at multiple concentrations (in the ideal case over a large concentration range). In the present case, we classified compounds as dose resistant if the BioMAP profiles at two or more concentrations were similar above the selected similarity threshold of Pearson’s correlation of r > 0.7. In our experience, approved or clinical stage compounds (e.g., with good therapeutic indexes) and compounds highly target selective tend to exhibit dose-resistant profiles, whereas early stage and/or poorly selective compounds often do not. 3 Dose resistance can be further quantitated by the concentration range over which profiles are similar and is a helpful metric for tracking compounds as they progress in discovery.
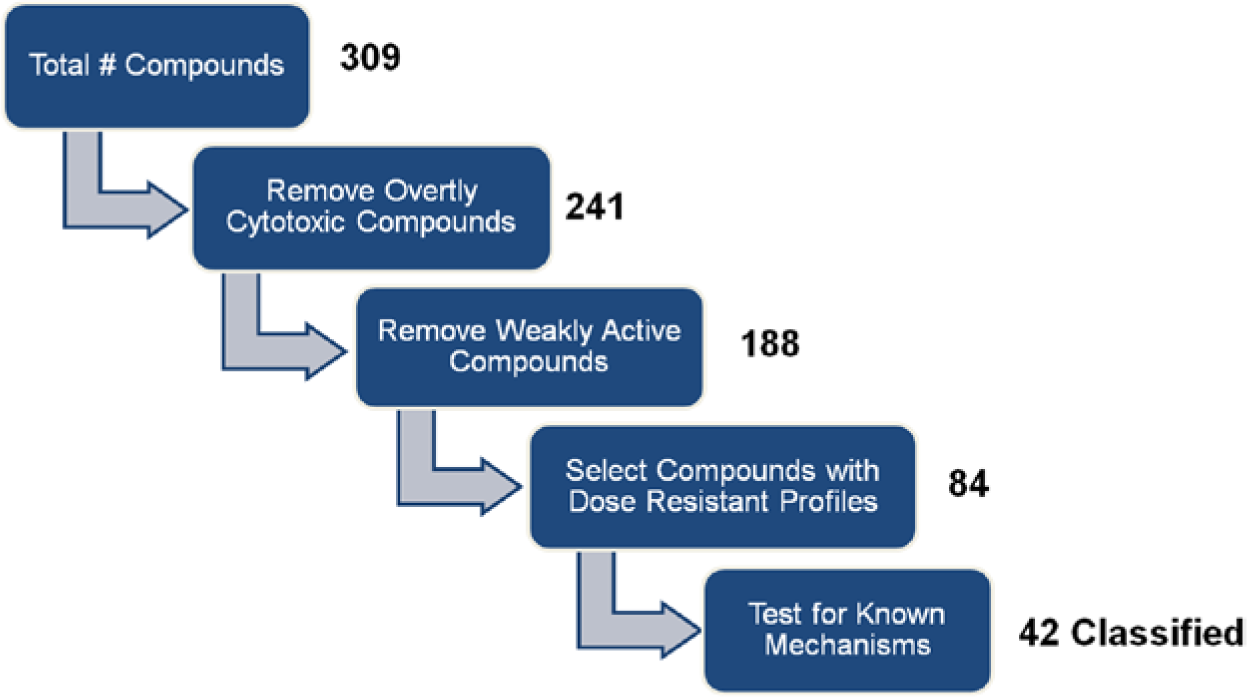
Data analysis decision scheme for phenotypic drug discovery hit assessment and triage. The results of processing the Environmental Protection Agency’s ToxCast phase I BioMAP profiling data set through this decision scheme are shown as the numbers of compounds remaining after each step in the process. Overtly cytotoxic and weakly active compounds were identified as described in Materials and Methods. Compounds showing dose resistance were defined as having two or more profiles at different concentrations that are similar (r > 0.7).
Of the 309 compounds in the ToxCast phase I data set, 188 remained following removal of overtly cytotoxic and weakly active compounds, and 84 (27%) were found to meet all of the criteria in our decision scheme. These 84 compounds were then tested against the 28 SVM models, and as shown in
Table 2
, 42 compounds (50%) were able to be classified.
Classification of Selected ToxCast Phase I Chemicals Based on 28 SVM Mechanism Models.
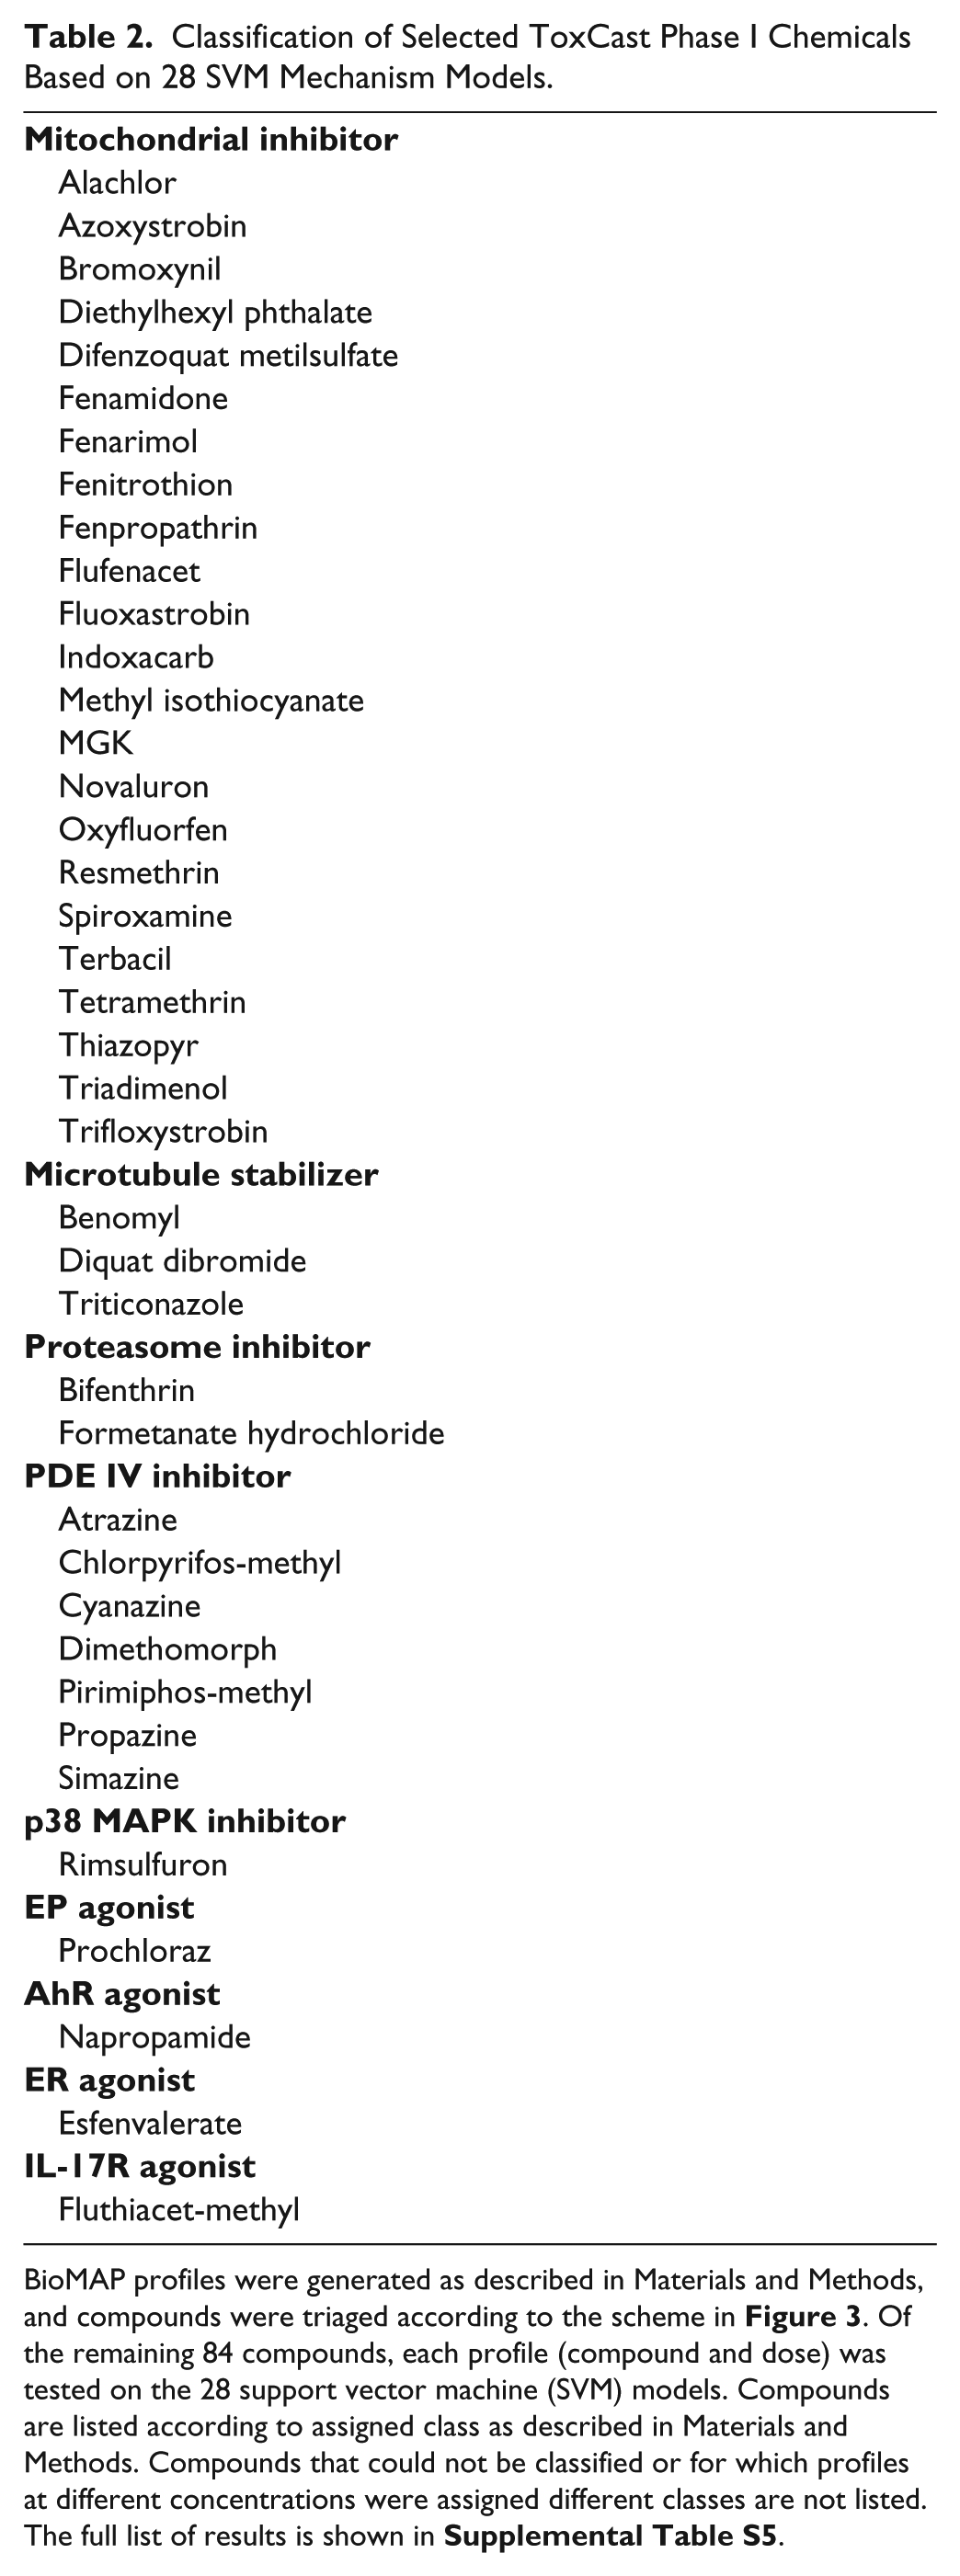
BioMAP profiles were generated as described in Materials and Methods, and compounds were triaged according to the scheme in
Figure 3
. Of the remaining 84 compounds, each profile (compound and dose) was tested on the 28 support vector machine (SVM) models. Compounds are listed according to assigned class as described in Materials and Methods. Compounds that could not be classified or for which profiles at different concentrations were assigned different classes are not listed. The full list of results is shown in
Application of SVM Models for Assigning Toxicity Mechanisms of Action
For purposes of identifying toxicity mechanisms that may not be due to the primary target but rather relate to secondary off-targets, the results of mechanism assignments identified at only a single concentration may be relevant. Thus, we also inspected the results from testing all profiles in the ToxCast phase I data set through the 28 SVM models. In this case, we removed strongly toxic profiles, defined as resulting in overt cytotoxicity in three or more systems, and weakly active profiles (defined as having a bit count of <8), as described in Materials and Methods. Previously, we reported analysis of these data and assignment of compounds into five mechanism classes based on similarity to compounds with known mechanisms of action, using unsupervised searches.
7
These five classes were mitochondrial dysfunction, microtubule inhibitors, endoplasmic reticulum (EndoR) stress inducers, nuclear factor (NF)–κB inhibitors, and cAMP elevators. Since the previous method required some degree of expert interpretation and provided a qualitative but not quantitative assessment of mechanism assignment, we reexamined this data set, testing it against the 28 SVM mechanism models. The 28 classes in the present study are more specific than in the earlier report. The EndoR stress inducer class has been replaced with the sarco/endoplasmic reticulum Ca2+-ATPase (SERCA) inhibitor class, the NF-κB inhibitor class has been replaced with the IKK-2 inhibitor and proteasome inhibitor classes, and the cAMP elevator class has been replaced with PDE IV inhibitor and EP receptor agonist classes. In addition, there are separate classes for microtubule stabilizers and microtubule disruptors. The results from testing the profiles from all ToxCast phase I compounds are shown in
The largest class previously identified by BioMAP profiling in the ToxCast phase I data set included mitochondrial inhibitors.
7
Notably, the SVM approach enabled classification of 17 additional compounds as mitochondrial inhibitors, including alachlor, hexaconazole, and diethylhexyl phthalate (
Testing against the SVM models also gave more specificity to the mode of action of compounds previously classified as NF-κB inhibitors. Several compounds that were previously classified as NF-κB inhibitors were reclassified as proteasome inhibitors by SVM, whereas only one was classified as an IKK-2 inhibitor. The NF-κB pathway subunit IκB is processed by the ubiquitin/proteasome pathway, 22 suggesting that the environmental chemicals tested may preferably target this arm of the NF-κB pathway.
Fewer compounds were assigned to the microtubule inhibitor class than previously. Of the 15 compounds previously classified as microtubule inhibitors in the ToxCast data set, only 1, benomyl, was classified by SVM in the microtubule class. Two compounds, cyprodinil and fludioxinil, were classified as ER agonists, whereas hexythiazox, parathion-methyl, and pyridaben were reclassified as mitochondrial inhibitors. Pyridaben has been shown to inhibit mitochondrial complex I. 23 Given that we have two SVM models for microtubule inhibition, disruptors and stabilizers, these classes may be more stringent than our previous assignment. We have previously described similarity of BioMAP profiles of 17-β estradiol (ER agonist) and microtubule inhibitors. 7
Compounds previously identified as EndoR stress inducers fell into other classes when tested on the SVM models here. Only one target class related to endoplasmic reticulum stress, SERCA, was developed as an SVM model for the present study. None of the ToxCast phase I chemicals were identified as SERCA inhibitors using the SVM model. This suggests that the environmental chemicals classified as EndoR stress inducers may not act via SERCA but could be affecting endoplasmic reticulum stress via other target mechanisms.
The ToxCast phase I chemicals were active in six additional SVM models: AhR (aryl hydrocarbon receptor) agonist, ER (estrogen receptor) agonist, H1R (histamine H1 receptor) antagonist, GR (glucocorticoid receptor) agonist, p38 MAPK inhibitor, PKC (c+n) inhibitor, and IL-17R agonist. For the AhR agonist class, only one compound was identified: napropamide, consistent with a recent report. 24 Three compounds were identified in the estrogen receptor, ER agonist class: cyprodinil, fludioxinil, and esfenvalerate. Modulation of ER function by fludioxinil and fenvalerate has been reported.25,26 One compound was classified as an IL-17R agonist, fluthiacet-methyl. Interestingly, IL-17 family members play a role in epithelial cell immunity, and IL-17 has been associated with epithelial-mesenchymal transition (EMT), a process associated with embryogenesis during development and cancer metastasis.27,28
For a number of compounds with DV >0 for one or more classes, the mechanism class could not be assigned. In some cases, the difference between the highest and next highest DV was too small to confidently assign (<0.03), and in other cases, the mechanism class assigned at higher doses was clearly different from that of lower concentrations (see Discussion).
Discussion
We have previously described a panel of primary human cell–based assays and their use in characterizing drug biological effects based on modulation of a set of protein-level end-point measurements. Since 2004, these BioMAP assays have been used by industrial and academic collaborators for compound characterization and small library screening.3–6,29,30 These assays have also been employed by the Environmental Protection Agency (EPA) for their ability to detect and distinguish environmental chemicals according to mode-of-action and toxicity end points.7–9 We have reported clustering of compounds based on their activity profiles and results from an unsupervised search of a database of reference compound profiles to generate an MoA hypothesis. Here we extend these studies to describe the development and performance of predictive models for a set of 28 mechanism classes developed from a group of well-characterized chemicals and bioactive agents.
The present results demonstrate that phenotypic assay data can be sufficiently robust and reproducible for the development of predictive models. None of the individual protein biomarker assays that comprise the BioMAP profiles is a direct measure of target activity. Rather, biomarker end points are indirect sentinels, downstream and sensitive to the activities of multiple targets, such that the pattern of end-point changes (increased or decreased levels) can be associated with a particular mechanism class. These mechanism classes can be general processes, such as the previously described EndoR stress inducer class,5,7 or specific targets, such as the SERCA inhibitor class, described in this report.
The current study illustrates both the benefits and limitations of our approach. Benefits include coverage of mechanisms for which target-based assays are not available or difficult to measure, such as mitochondrial dysfunction. Among limitations of this approach is the requirement for well-characterized, target-selective compounds or bioactive agents to generate informative classifiers. Fortunately, the identification of selective “probes” for specific targets continues to improve, and selective compounds for many common mechanisms of interest are now available. Another limitation is that due to the topology of the data set and high degree of similarity of some mechanism classes to each other, employing a single generalized method for constructing classifiers, such as the two-class SVM procedure described here, will not be optimal for all classes. Future strategies that address this limitation may involve the implementation of a tiered method, where compounds are first tested for membership in a mechanism superclass, such as the EndoR stress inducer class. Subsequently, compounds assigned to the superclass would be further refined using SVM models for specific targets, such as the SERCA inhibitor class. This may be needed as models for more target mechanisms are included. We have preliminary data suggesting that good models can be built for additional target classes, including cyclooxygenase, the epigenetic BET family, and additional kinases and biologics (TLR agonists, cytokines, and growth factors; data not shown).
Another approach to expand the coverage of mechanism classes is to include additional biological systems. We have recently described an expanded panel of 12 BioMAP systems (BioMAP Diversity PLUS panel) that includes a model of T-cell–dependent B-cell activation (BT system), 31 a myofibroblast system (MyoF system), a bronchial epithelial cell-fibroblast co-culture (BF4T), and a macrophage-endothelial cell co-culture (Mphg system). This panel has been useful for characterizing inhibitors of BTK and PI3Kγ/δ isoforms.29,30
In the studies presented here, we demonstrate how these SVM models can be applied in a decision scheme for triaging hit compounds from phenotypic drug discovery screens. Ideal hits will be noncytotoxic to diverse primary human cell types, have desired activity at multiple doses, and will not belong to a known obvious mechanism class. The decision scheme shown in Figure 3 and results from processing the ToxCast phase I data set illustrate this application. The ToxCast phase I compounds are primarily environmental chemicals and thus can be viewed as a sample collection of bioactives. More than 50% of these compounds were active, although the top dose (40 µM) would be considered on the high range for primary screening. Of the 84 compounds that showed suitable characteristics, 50% could be classified with a known mechanism. In some cases, it was not possible to assign compounds to a single mechanism class. For dimethomorph, the DVs for two classes (EP agonist and PDE IV) were high and too close to distinguish, suggesting that additional biological systems may be required to discriminate these mechanisms. In the case of prochloraz, it was classified as a mitochondrial inhibitor at the top dose but as an EP agonist at lower doses, suggesting possible polypharmacy.
This second case supports the application of SVM models for investigation of secondary activities and toxicity mechanisms. For the purpose of identifying known mechanisms, the present study’s results show the value of a more quantitative approach. This method is automated and does not require curation of results by a scientific expert to assign mechanism classes. Mechanism class assignments that can be quantitated will help build confidence in the results, are unbiased, and can help guide additional correlation analyses with in vivo toxicology study results. Finally, some of the additional classification results reported here may be of particular interest. Specifically, while the identification of three chemicals as members of the IL-17R agonist class was initially unexpected, the association of IL-17 with immune-epithelial biology and the process of epithelial-mesenchyme transition suggest that this area may be of interest for further exploration.27,28
Our previous approach of analyzing the results of an unsupervised similarity search of a reference profile database, although it does not provide confidence for known mechanisms, offers other benefits. Toxicity information is available for many agents for which target mechanisms are unknown. Thus, a compound that has an activity profile similar to that of another compound known to cause an adverse effect may also have an increased probability of causing that adverse effect even if the underlying mechanism is unknown. Thus, the results can be used to infer activities of compounds other than target mechanisms.
In phenotypic drug discovery, compounds are selected based on their activity in a disease-relevant biological system, such as a cell-based assay or animal model, without predisposition of a particular drug target. The method reported here illustrates one of the challenges with PDD—namely, that phenotypic assays can be sensitive to multiple mechanisms. The panel of assays and SVM models described here provides a rapid means of assessing phenotypic hits and lead compounds for these common pathway mechanisms.
Footnotes
Acknowledgements
We gratefully acknowledge the excellent technical support from Dat Nguyen, Mary Plavec, Stephanie Fong, Lily Litrus, Liisa Alajoki, Charleen Rayl, Elijah Johnston, Hannah Cho, and Naomi Brown; helpful discussions with Alison O’Mahony; and software development support from Antal Berenyi.
Declaration of Conflicting Interests
The authors declared the following potential conflicts of interest with respect to the research, authorship, and/or publication of this article: All authors are employees of BioSeek, a division of DiscoveRx.
Funding
The authors received no financial support for the research, authorship, and/or publication of this article.
References
Supplementary Material
Please find the following supplemental material available below.
For Open Access articles published under a Creative Commons License, all supplemental material carries the same license as the article it is associated with.
For non-Open Access articles published, all supplemental material carries a non-exclusive license, and permission requests for re-use of supplemental material or any part of supplemental material shall be sent directly to the copyright owner as specified in the copyright notice associated with the article.