
Abstract
The process of conducting cell-based phenotypic screens can result in data sets from small libraries or portions of large libraries, making accurate hit picking from multiple data sets important for efficient drug discovery. Here, we describe a screen design and data analysis approach that allow for normalization not only between quadrants and plates but also between screens or batches in a robust, quantitative fashion, enabling hit selection from multiple data sets. We independently screened the MicroSource Spectrum and NCI Diversity Set II libraries using a cell-based phenotypic high-throughput screening (HTS) assay that uses an interferon-stimulated response element (ISRE)–driven luciferase-reporter assay to identify interferon (IFN) signal enhancers. Inclusion of a per-plate, per-quadrant IFN dose-response standard curve enabled conversion of ISRE activity to effective IFN concentrations. We identified 45 hits based on a combined z score ≥2.5 from the two libraries, and 25 of 35 available hits were validated in a compound concentration-response assay when tested using fresh compound. The results provide a basis for further analysis of chemical structure in relation to biological function. Together, the results establish an HTS method that can be extended to screening for any class of compounds that influence a quantifiable biological response for which a standard is available.
Introduction
High-throughput screening (HTS) systems using cell-based phenotypic assays are often more complex and costly than comparable HTS using target-based biochemical assays. As a consequence, cell-based approaches might involve screening several small libraries of compounds or subsets of a large library in batches rather than a single large screen. Alternatively, a small library might be subject to an initial screen to direct the subsequent selection and screening of additional libraries. Furthermore, cell-based assays are generally more susceptible to batch-to-batch or day-to-day variability when compared with target-based assays. Given these challenges for cell-based assay systems, there is a need for methods to accurately hit-pick across multiple screens and thereby enable the inherent advantages of phenotypic screening for first-in-class drug discovery. 1
We encountered these difficulties with cell-based screening in our work to discover new antiviral drugs. We developed an HTS system to identify small molecules that enhance the endogenous interferon (IFN) signaling pathway as a means to inhibit viral replication without the toxicities of exogenous IFN administration ( Fig. 1 ).2–6 The system uses a cell line engineered to express a luciferase reporter under IFN-stimulated response element (ISRE) regulation and was validated in a pilot screen of the Johns Hopkins Clinical Compound Library ( Fig. 1B ). 5 To identify additional hits for drug development, we proceeded to screen two additional compound libraries but realized the need to normalize the data not only between plates in an individual screen but also between screens to pick the most active hits from both screens together in a robust, quantitative fashion, which cannot be achieved using conventional analytical approaches for HTS data that are largely based on outlier identification. Plate median and B-score normalization methods do not account for agonist concentration-response behavior or its variance from run to run. Similarly, scaling data points to maximum and minimum values from positive and negative controls does not account for the differences in variance, since it assumes that there is no heterogeneity in the nonlinear variance of the dose-response curve from run to run.
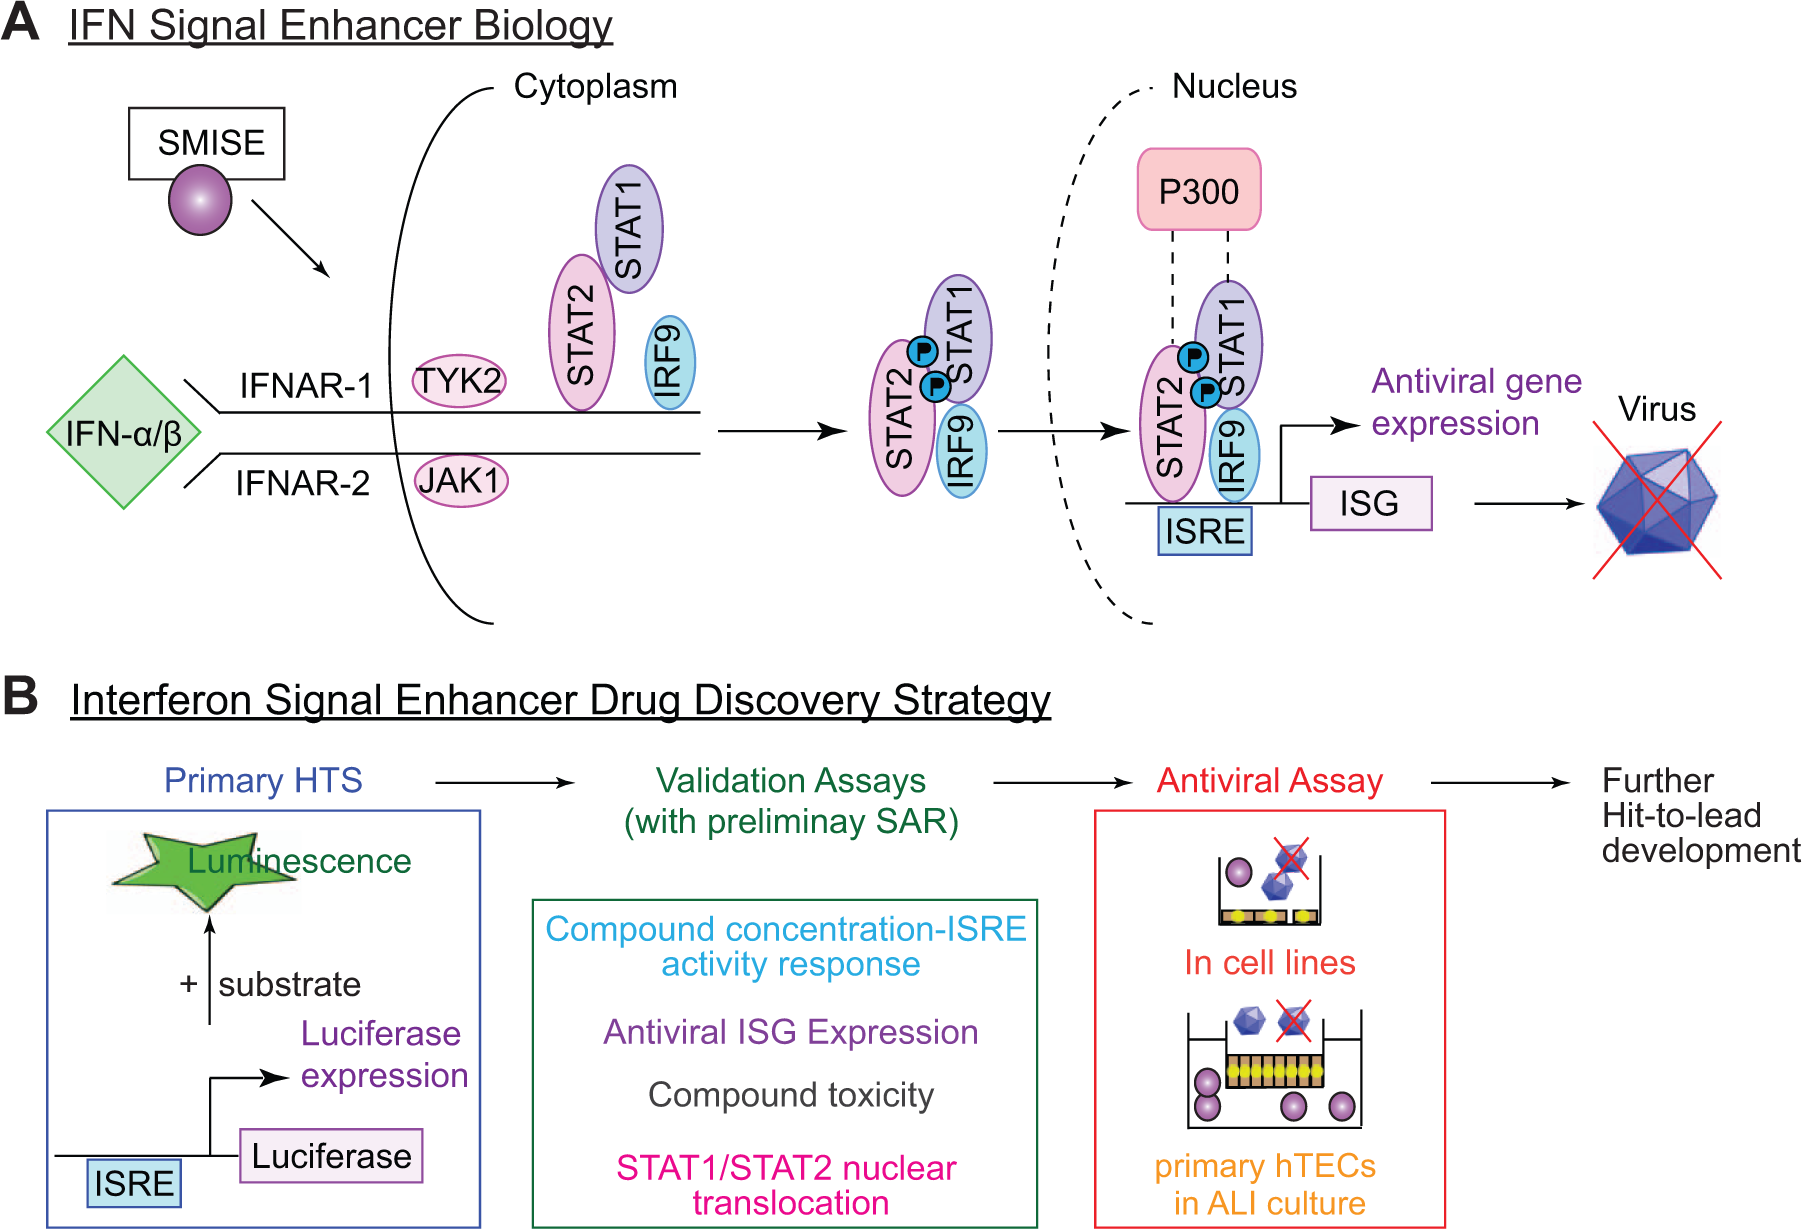
Scheme for discovery of small molecule interferon (IFN) signal enhancers (SMISEs) as broad-spectrum antiviral drugs. (
Here, we report a solution to these problems, the development of a quantifiable biological response HTS design and data analysis approach that includes a replicated standard curve for each quadrant on each plate. Screening data are fitted to the concentration-response curve, converting the assay readout (luciferase reporter luminescence) to a standardized biological response (effective IFN-β concentration). This provides a simple, precise normalization and data representation, thereby enabling hit picking across multiple screens and evaluating compound activity in units that are directly relevant to the biological response.
Materials and Methods
Screening Libraries and Chemical Compounds
Aliquots of the Spectrum library (MicroSource Discovery Systems, Gaylordsville, CT) and NCI Diversity Set II library (National Cancer Institute–Developmental Therapeutics Program [NCI-DTP], Frederick, MD) were obtained from the Washington University Chemical Genetics Screening Core. Library compounds were diluted to 5 mM in DMSO in 96-well plates, sealed using a Flexiseal plate heat sealer (K Biosciences, Beverly, MA), and stored at −20 °C. Plates were thawed, equilibrated to room temperature, and centrifuged before use. IFN-β was obtained from PBL Interferon Source (Piscataway, NJ). Compounds for hit confirmation and further analysis were obtained from Sigma Aldrich (St. Louis, MO), MicroSource Diversity Systems, VWR (Radnor, PA), Specs (Cumberland, MD), Princeton Bimolecular Research (Monmouth Junction, NJ), Toronto Research Chemicals (Toronto, Canada), MP Biomedicals (Santa Ana, CA), Santa Cruz Biotechnology (Dallas, TX), or TimTec Drug Discovery (Newark, DE).
ISRE Activity-Luciferase Reporter Assay and Automation
The ISRE activity assay using 2fTGH-ISRE-CBG99 cells that stably express CGB99 green luciferase under control of ISRE promoter activity was described previously. 5 For the present experiments, cells were plated in 384-well plates and allowed to grow for 13 to 15 h, then treated with compound and/or IFN-β for 7 to 11 h, the window for maximal assay signal. After simultaneous cell lysis and addition of luciferin using the SteadyLite plus reagent (PerkinElmer, Waltham, MA), cells were incubated for 40 min at room temperature. Luminescence was then read using a Synergy 4 plate reader (BioTek, Winooski, VT). Screening was performed in a fully automated screening facility that contains a Caliper Sciclone ALH 3000 workstation (PerkinElmer) and EL406 washer (BioTek) for liquid handling, an automated Liconic incubator (Thermo Scientific, Waltham, MA) for storage of plates at 4 °C, an automated Cytomat incubator (Thermo Scientific) for cell culture, a separate hotel for storage of plates at room temperature, a Synergy 4 plate reader, a Caliper Twister II, and a Beckman Sagian Orca robotic arm on a linear rail (Beckman Coulter, Fullerton, CA), all enclosed in a customized BSL2 laminar flow hood.
HTS Protocol
The Spectrum and NCI Diversity Set II libraries each contained 2000 compounds. Each library was plated in 96-well plates (n = 25/library) and was screened separately with a 1-month interval between screening runs. Each compound was represented on duplicate plates at four different concentrations (0.24, 1.2, 6, and 30 µM), all in the presence of IFN-β (15 U/mL) (
Screening was performed as described previously. 5 First, compound dilution plates containing 0.24, 1.2, 6, and 30 µM compound in media with 15 U/mL IFN-β were made and stored at 4 °C. Corresponding DMSO concentrations in final treatment solutions were 0.6%, 0.12%, 0.024%, and 0.0048% in these compound solutions, respectively, well below the assay tolerance limit of 1% DMSO. 5 The IFN-β control solutions were pipetted into the first and last columns of these dilution plates. Next, cells were plated onto duplicate assay plates and maintained at 5% CO2 and 37 °C. Then, assay plates and compound dilution plates were transferred to the Sciclone liquid handler to treat cells with compound or control solutions. The assay plates were incubated at 5% CO2 and 37 °C for 11 h, after which the luciferase assay was performed by aspiration of media followed by addition of the SteadyLite reagent, incubation at room temperature for 40 min, and measurement of luminescence. Taking into account the 11-min rate-limiting step of reading each plate, the screening schedule was designed to provide equivalent time periods for incubation, treatment, and luciferase assay for each assay plate. Total screening time for each compound library was approximately 42 h.
HTS Data Analysis
The screening data from each compound library were analyzed using two methods. For the first method, data from each library were treated individually. The CellHTS2 software package was used for statistical analysis.7–9 Raw data were normalized using plate median methods and variance adjusted using B-score normalization.7,10 Next, z score transformations were applied to center each data set across the entire individual screen. Replicates for a given compound at a given dose (n = 2 for each dose/compound combination) were then mean summarized. A z score threshold of ≥2.5 for any compound concentration was used to identify hits from each library.
For the second method of analysis, the two screening data sets were normalized to combine the data sets before computing z scores. Raw luminescence values were fit to the IFN-β–concentration-luciferase activity response curve on a per-plate, per-quadrant basis (
Hit Confirmation and Potency Estimation
Hits from the primary HTS were confirmed by measurement of ISRE activity over a range of compound concentrations in the presence of IFN-β (15 U/mL). Compounds were tested in quadruplicate in a 12-point, 2-fold dilution series starting at a concentration of 25, 50, or 125 µM, depending on the DMSO stock concentrations. DMSO concentrations were maintained at 0.5% for all compound dilutions. Data were fit to a log(agonist concentration) versus response curve to calculate compound potency, as defined by the half-maximal effective concentrations (EC50). Structurally similar compounds were included when available.
High-Content STAT1/STAT2 Nuclear Translocation Assay
Compound effects on IFN signaling were further validated with an assay of IFN-stimulated nuclear translocation of STAT1 and STAT2. For this assay, 2fTGH cells (7500 cells/well in 96-well black tissue culture–treated plates) were treated with compound for 18 h and then with compound plus IFN-β (15 U/mL) for an additional 20 min or 2 h at 37 °C. For assay validation experiments in which treatment time with IFN was varied, saturation concentrations for IFN-β and IFN-γ were used. To assess STAT1 and STAT2 translocation, cells were fixed in 4% paraformaldehyde and then immunostained for STAT1 using mouse anti–human STAT1 91/84 (BD Biosciences, San Diego, CA) and STAT2 using rabbit anti–human STAT2 (Thermo Scientific, Rockford, IL) for 1 h followed by detection with goat anti–mouse Alexa Fluor 660–conjugated immunoglobulin (IgG) (Life Technologies, Carlsbad, CA) for STAT1 and donkey anti–rabbit Alexa Fluor 555–conjugated IgG (Life Technologies) for STAT2. Cell nuclei were stained with Hoechst 33342 (Thermo Scientific) and then imaged using an ArrayScan VTI High Content Imaging system (Cellomics/Thermo Scientific, Pittsburgh, PA) with a 10× objective. Images were analyzed using vendor software as follows. To measure STAT fluorescence intensity in the nucleus, a circle was defined 1 pixel inside the nuclear-cytoplasmic boundary. Similarly, STAT fluorescence in the cytoplasm was measured in a ring of 1-pixel thickness, the inner edge of which was defined by the nuclear-cytoplasmic boundary. STAT nuclear translocation was then calculated for each cell as the difference in pixel-averaged fluorescence intensity between the circle defined in the nucleus and the ring defined in the cytoplasm in fluorescence units. Values are reported as the average STAT nuclear retention values for all cells imaged per well for three to four wells (15 images and 700 cells per well). Values are negative for untreated cells, since average STAT2 fluorescence intensity is higher in the cytoplasm than in the nucleus at baseline.
IFN-Stimulated Gene Expression Assays
Compound effects on IFN signaling were also assessed with assays of IFN-stimulated gene (ISG) expression. For these assays, 2fTGH cells were treated with compound, with or without IFN-β, for 12 h and then lysed using the Cells-to-cDNA lysis buffer (Life Technologies). After DNAse treatment, the lysates were used to generate complementary DNA (cDNA) using the High Capacity Reverse Transcription Kit (Life Technologies). The quantitative PCR (qPCR) assays for 2′-5′-oligoadenylate synthetase 1 (OAS1), myxovirus resistance 1 (MX1), and IFN-induced protein with tetratricopeptide repeats 1 (IFIT1) messenger RNA (mRNA) expression were performed in accordance with Minimum Information for Publication of Quantitative Real-Time PCR Experiments (MIQE) guidelines.12,13 Expression of ornithine decarboxylase antizyme (OAZ1) mRNA was used as the normalizer, as described previously. 5 For IFIT1 mRNA quantification, the RTPrimerDB assay ID 4052 was used, with the following forward primer, reverse primer, and probe, respectively: 5′-cgctatagaatggagtgtcca-3′, 5′-tttcctccacacttcagca-3′, and 5′-/56-FAM/aatagactgtgaggaaggat-gggcc-3′. 14 Primers and probes were obtained from Integrated DNA Technologies (Coralville, IA). A cDNA vector was used as the IFIT1 standard (clone ID: 4250452; Thermo Open Biosystems, Huntsville, AL). Assay reagents and standards used for the OAS1, MX1, and OAZ1 expression assays were described previously. 5 All qPCR assays were run on a 384-well LightCycler 480 (Roche Applied Science, Indianapolis, IN) real-time PCR system in 3-µL duplicate reactions. Quantification cycle values were computed using a second derivative maxima algorithm with the LightCycler 480 software.
Virus Infection Assays
Compounds with IFN signal enhancing activity were assessed for antiviral activity in 2fTGH cells and primary-culture human tracheobronchial epithelial cells (hTECs). 2fTGH cells cultured in 96-well plates (2000 cells per well) were treated with compound or IFN-β either for 6 h before virus infection, and then after for 18 to 20 h, or only after virus infection. Virus was inoculated with cells for 1 h at 37 °C. Thereafter, cells were washed and medium containing 2% fetal bovine serum (FBS) added before collection for viral titer. hTECs were isolated and cultured as described previously. 15 For the present experiments, hTECs were grown to confluence under submerged conditions (4–8 days) in bronchial epithelial growth medium (BEGM) and then under air-liquid interface (ALI) conditions in ALI medium as described previously. 16 Differentiation of cells was verified after 21 days by visualization of beating cilia using a Nikon Ti-S inverted phase-contrast microscope (Nikon, Tokyo, Japan) enclosed in a customized environmental chamber maintained at 37 °C. The average cilia beat frequency was measured to be 7 to 13 Hz. For infection, the basal compartment media were changed to medium containing only 0.5 mg/mL BSA and 5 × 10⁻⁸ M retinoic acid, and 16 h later, virus was added to the apical compartment for 2 h at 34 °C. Cells were then washed, and basal medium was replaced with medium containing compound, IFN and DMSO, or DMSO alone.
Viruses included encephalomyocarditis virus (EMCV), strain VR-129B (ATCC, Manassas, VA) at a multiplicity of infection (MOI) of 0.01; human rhinovirus (HRV-A1), used at an MOI of 0.1 (obtained from J. Gern, University of Wisconsin); and respiratory syncytial virus (RSV Long, GenBank accession number AY911262, obtained from R. Brazas, Duke University) at MOI 2. Standard plaque assay protocols were followed to calculate plaque-forming units (PFUs). 17 For EMCV, virus particles in cell supernatant were lysed by heating for 10 min at 95 °C and then quantified using a one-step qPCR assay for the EMCV 3D gene as described previously. 5 For HRV-A1, one-step qPCR was performed using primers 5′-cctccggcccctgaat-3′ and 5′-aaacacggacacccaaagtagt-3′, as well as probe 5′-/56-FAM-ctaaccttaaacctgcagcca-3′, complementary to the 5′ UTR for HRV-A1, as described previously. 18 For RSV Long qPCR, the F1 and F2 primers and RS-F3 probe were used as described by Mentel et al. 19 Purified RNA from virus stocks were used as standards. Virus particles in the apical washes were normalized to expression of OAZ1.
Results
Primary HTS for ISRE Activity
We anticipated run-to-run variance of the primary HTS assay for ISRE activity based on cell stock, IFN batch, IFN storage conditions, and time after dilution. The IFN-β concentration–ISRE activity responses from the first plates of the NCI Diversity Set II screen and the Spectrum library screen demonstrate that while the coefficient of variance per data point does not change significantly from experiment to experiment, the absolute values and slope of the log(agonist)-response curve do vary between experiments ( Fig. 2A ). Normalization of the raw data by conversion to a percentage maximum activity using the minimum activity (0 U/mL IFN-β) and maximum (200 U/mL IFN-β) controls cannot account for the change in the Hill slope or the right-shift of the entire activity response curve near the first inflexion point ( Fig. 2B ). In other words, normalization to a minimum-maximum activity scale is insufficient to characterize the inherent heterogeneity in experiment-to-experiment variance in different IFN-β concentration regimes.
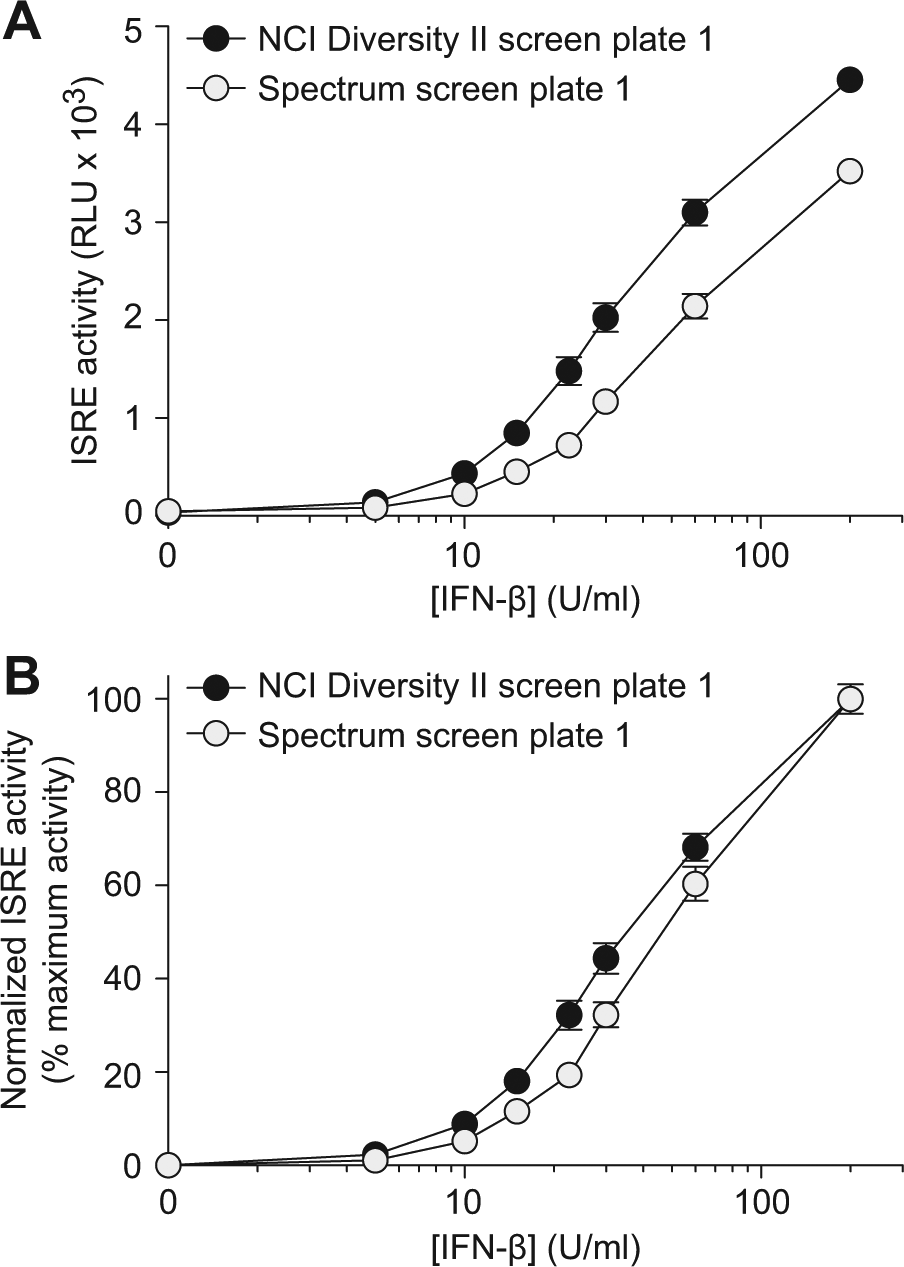
Interferon (IFN)–β concentration-response for interferon-stimulated response element (ISRE) activity. (
When we screened the Spectrum library and the NCI Diversity Set II libraries, we first analyzed the two library data sets individually as we described previously. 5 For this type of analysis, data from each library screen were normalized separately using plate median and B-score normalization to adjust for plate-to-plate variance and obtaining z scores for each individual set. In this analysis, four data points corresponding to four test concentrations represent each compound, and compounds are ranked by maximum z score at any concentration for ease of visualization ( Fig. 3A ). Based on the criterion of a maximum z score ≥2.5 for any compound concentration, we obtained 9 hits from the NCI library and 23 hits from the Spectrum library, for a total of 32 hits out of 4000 compounds screened, yielding a hit rate of 0.8%.
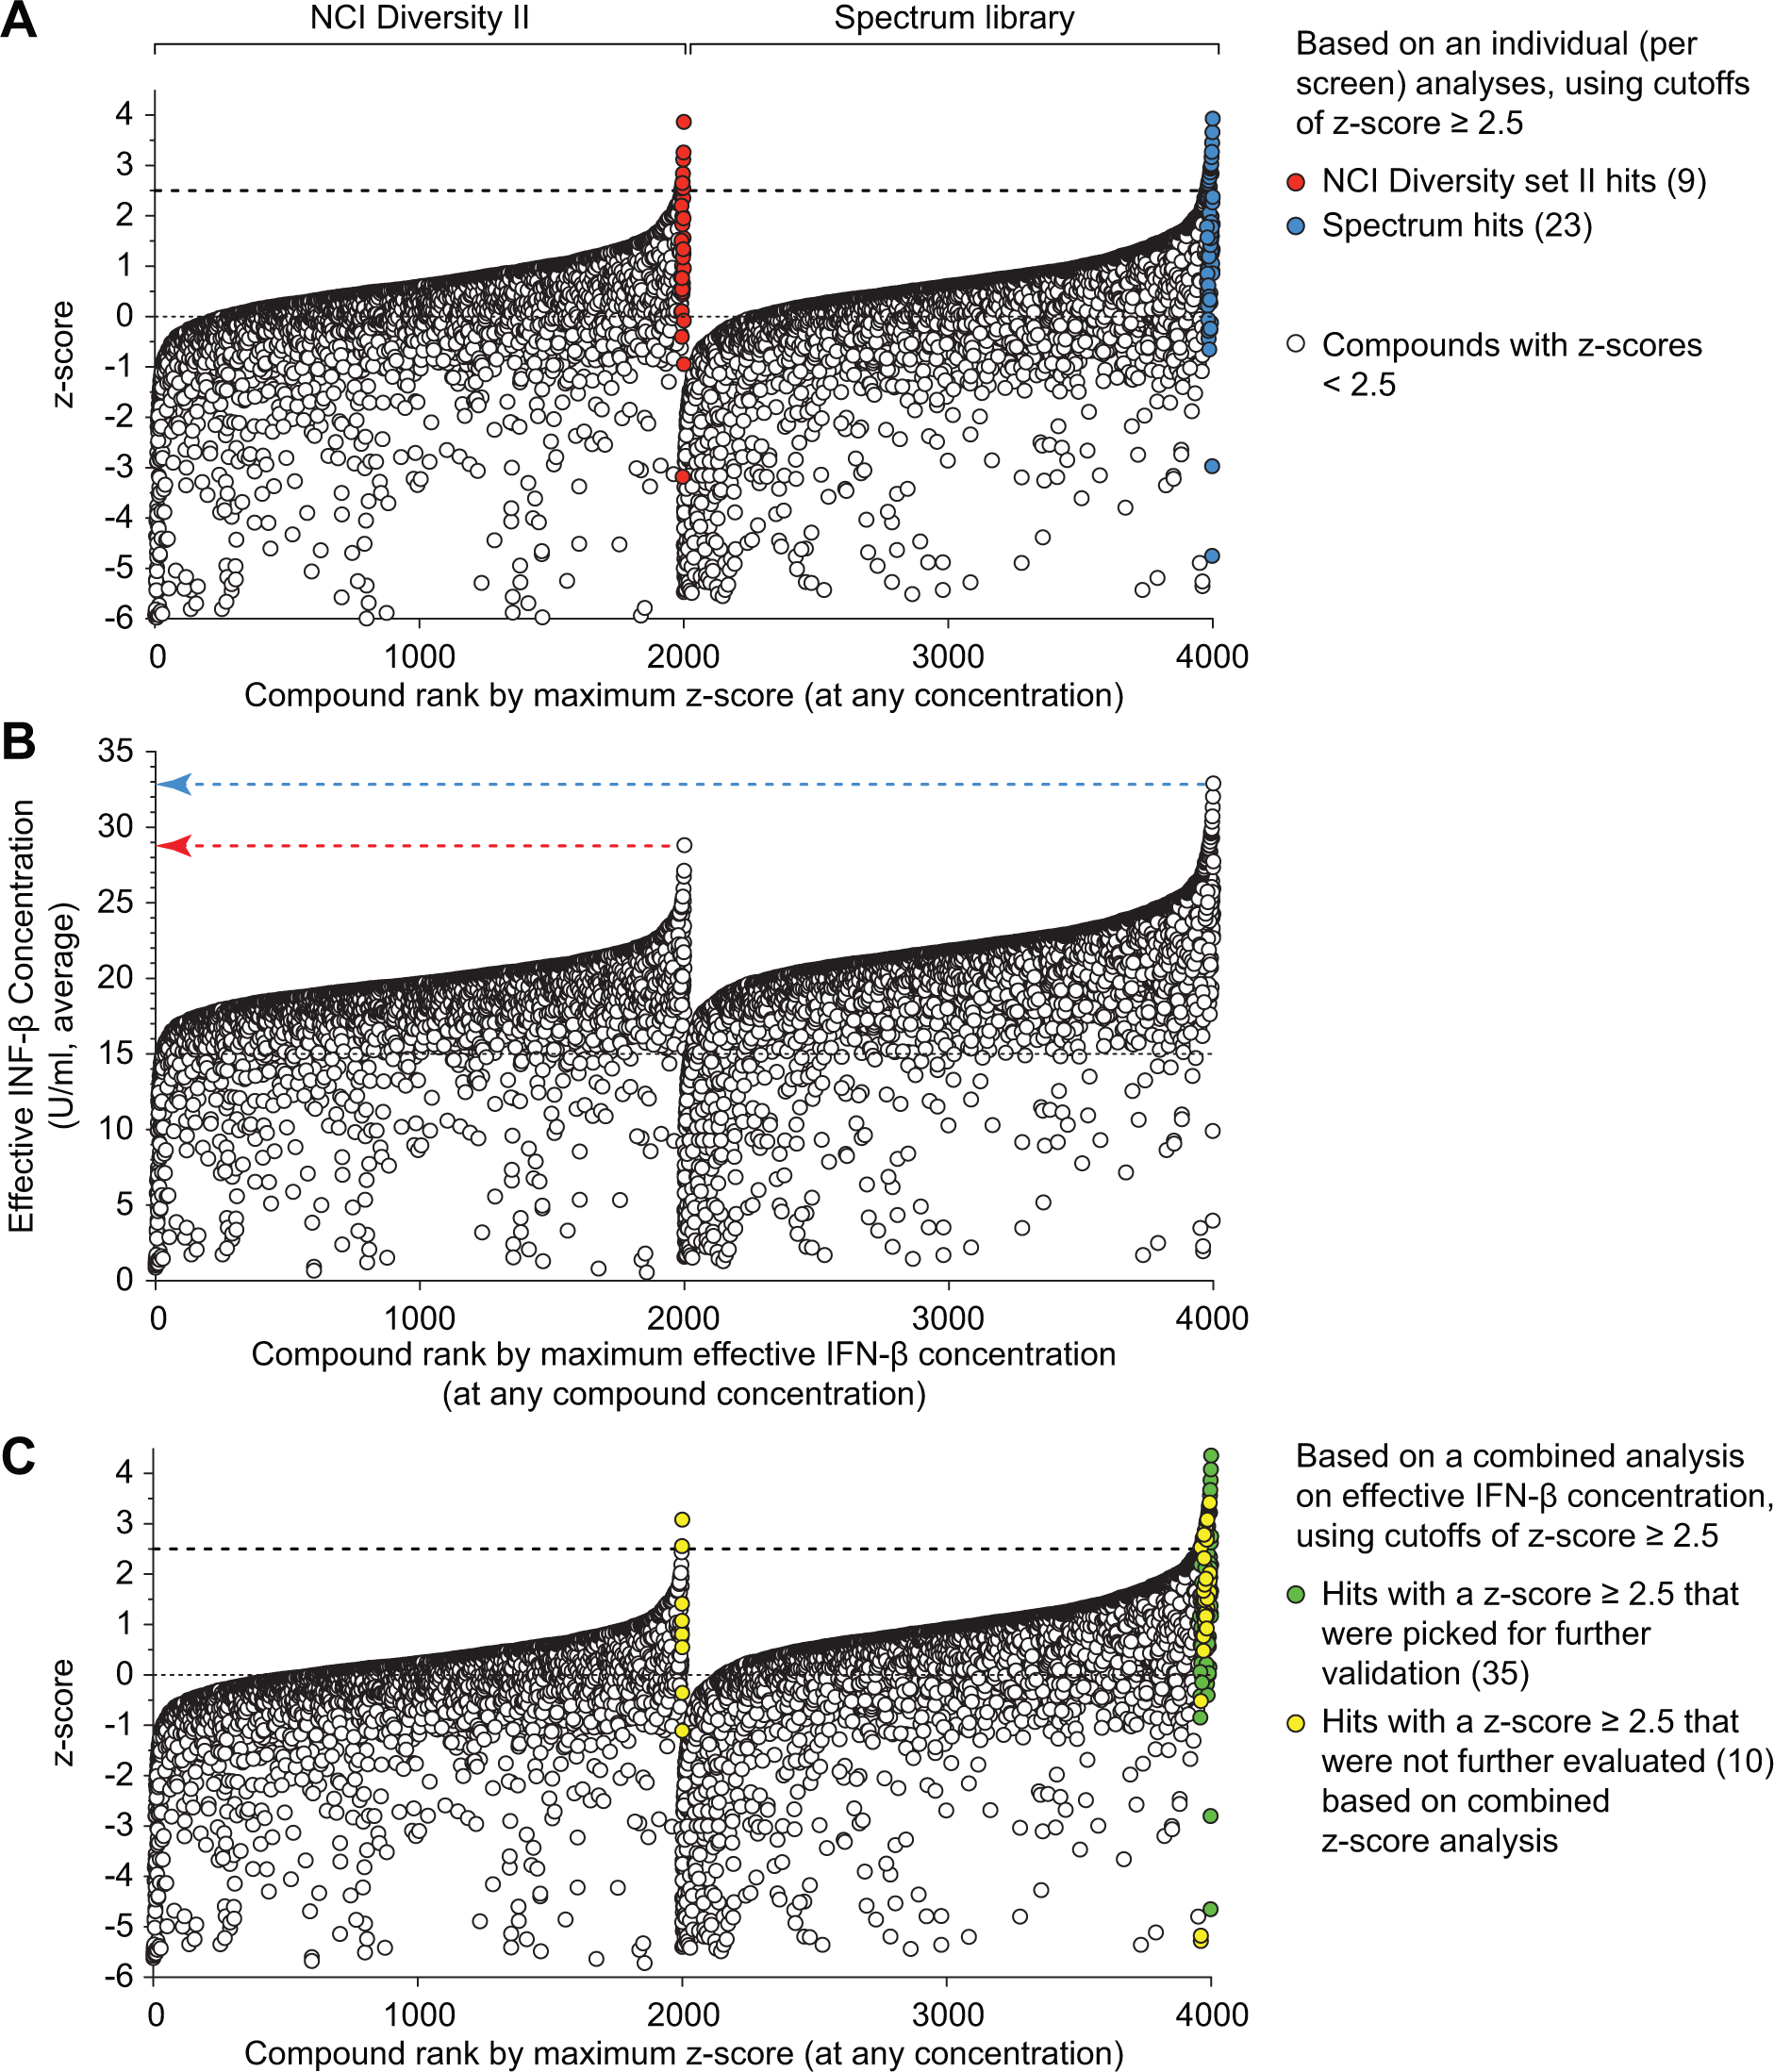
Data from screening the National Cancer Institute (NCI) Diversity Set II and the MicroSource Spectrum libraries. (
While the 9 compounds selected from the NCI library and the 23 compounds selected from the Spectrum library were the best performing of the 2000 compounds queried per individual set, we questioned if these 32 compounds were indeed the best performing of the 4000 small molecules tested in total. To answer this question, we would need to analyze the two sets of screening data as a single set. Therefore, we needed to implement a type of analysis that would require normalization that did not rely solely on statistics but also could take into account the heterogeneity of the run-to-run variance of the assay. However, we also recognized that the two library screens produced different responses to IFN-β (
Fig. 2
). For example, a compound that increased ISRE activity by 5% compared with IFN-β treatment alone in one screen was not equivalent to a compound that increased activity by 5% in the second screen, because the Hill slope of the IFN-β concentration–ISRE activity response is different (
Fig. 2
). In fact, since we know the activity of IFN-β depends greatly on incubation time after dilution, there might be not only screen-to screen but also plate-to-plate variances in response. To address these issues for normalization, we fit the test data to the IFN-β concentration–ISRE activity luminescence curve on a per-plate, per-quadrant basis. Since we included eight replicates of each IFN-β concentration control, four on each of the left-most and right-most columns, we had two replicates of each IFN-β concentration on a particular quadrant (
The difference in activity distribution between the NCI and Spectrum libraries suggests that the 32 hits picked through analyses of each library separately were not the 32 most active compounds of the total 4000 compounds tested. When the combined data set of effective IFN-β concentrations was transformed to z score values, we again used a z score threshold of 2.5 to select active compounds, identifying 45 hits (hit rate of 1.125%), of which only 2 were from the NCI library, again reflecting the higher activity of compounds in the Spectrum library in our assay ( Fig. 3C ). Thus, we avoided selection of less active compounds from the NCI library as hits, selecting additional, more active hit compounds from the Spectrum library. Furthermore, normalization of test data to quantifiable biological response allowed elimination of outliers among the control wells, without having to exclude data from an entire plate.
Hit Confirmation
Of the 45 hits called from our combined analysis, we selected 35 for further evaluation. Of the 10 remaining hits called, 8 were not selected for further exploration because they were not readily available from commercial sources, and the 2 others were ribavirin and doxorubicin. Ribavirin, an antiviral therapeutic approved by the Food and Drug Administration, was previously reported to augment IFN signaling.20,21 Our previous work shows that doxorubicin acts as an IFN signal enhancer. 5 As a result, all 35 compounds selected for further analysis (indicated with green dots in Fig. 3C ) were derived from the Spectrum library. These compounds represented several structural classes, including CNS monoamine neurotransmitter-like compounds, flavone-like compounds, statins, salicylates, large and lipophilic compounds, lipophilic acids, and small size phenols. When these compounds were obtained from outside the library and subjected to hit confirmation using the same ISRE activity assay across 12 concentrations, we found that 25 of the 35 compounds were confirmed as hits based on concentration-dependent increases in ISRE activity.
Hit Validation and Expansion Using ISRE Activity and Orthogonal Assays
We started evaluating structural classes represented by the confirmed hits using orthogonal assays for IFN signaling by assessing the activities of structurally similar small molecules in each structural class. In particular, we found that 6 of 10 statins tested significantly enhanced IFN-β–driven ISRE activity with varying efficacy and potency ( Fig. 4A , B ). The IFN signal-enhancing property of these statins was confirmed when these compounds also increased ISG expression in 2fTGH cells treated with statin and IFN-β ( Fig. 5A and data not shown). Thus, each of three ISGs with known antiviral activity (OAS1, MX1, and IFIT1) showed significant increases in expression in response to statin plus IFN-β treatment ( Fig. 5A ).
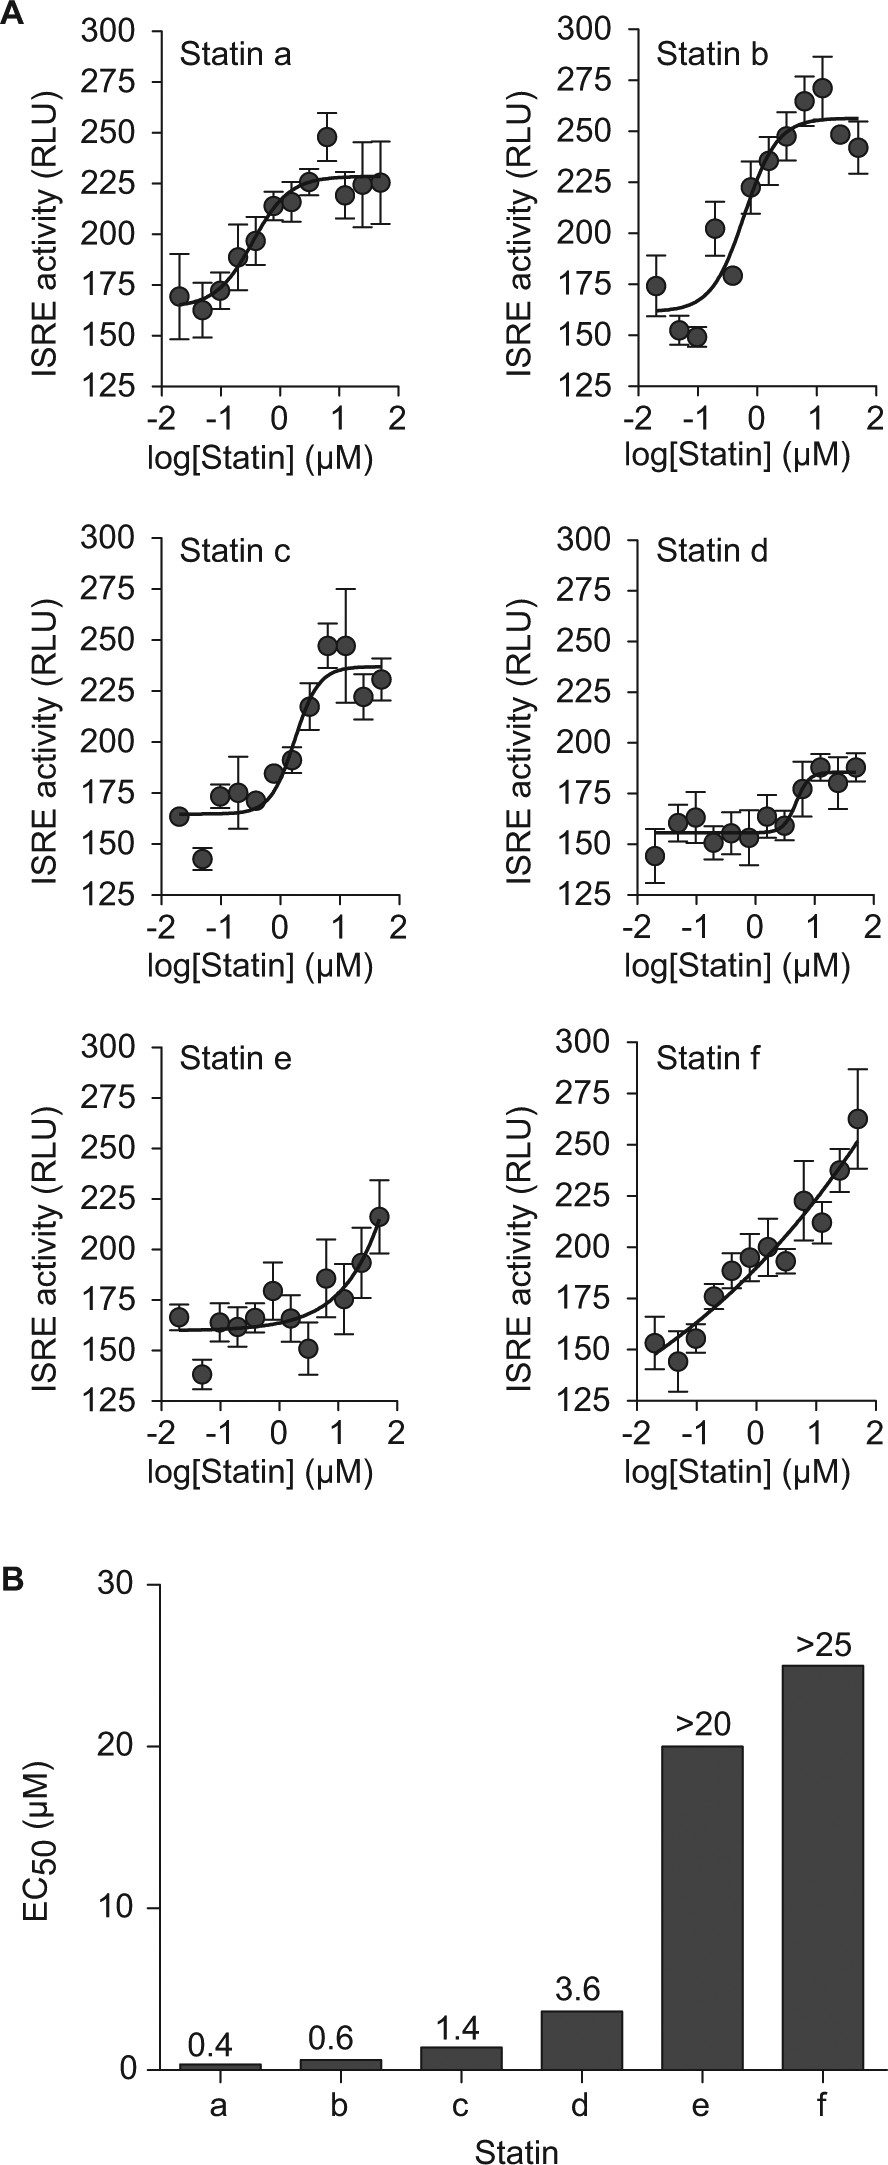
Certain statins enhance interferon (IFN)–driven interferon-stimulated response element (ISRE) activity in a concentration-dependent manner. (
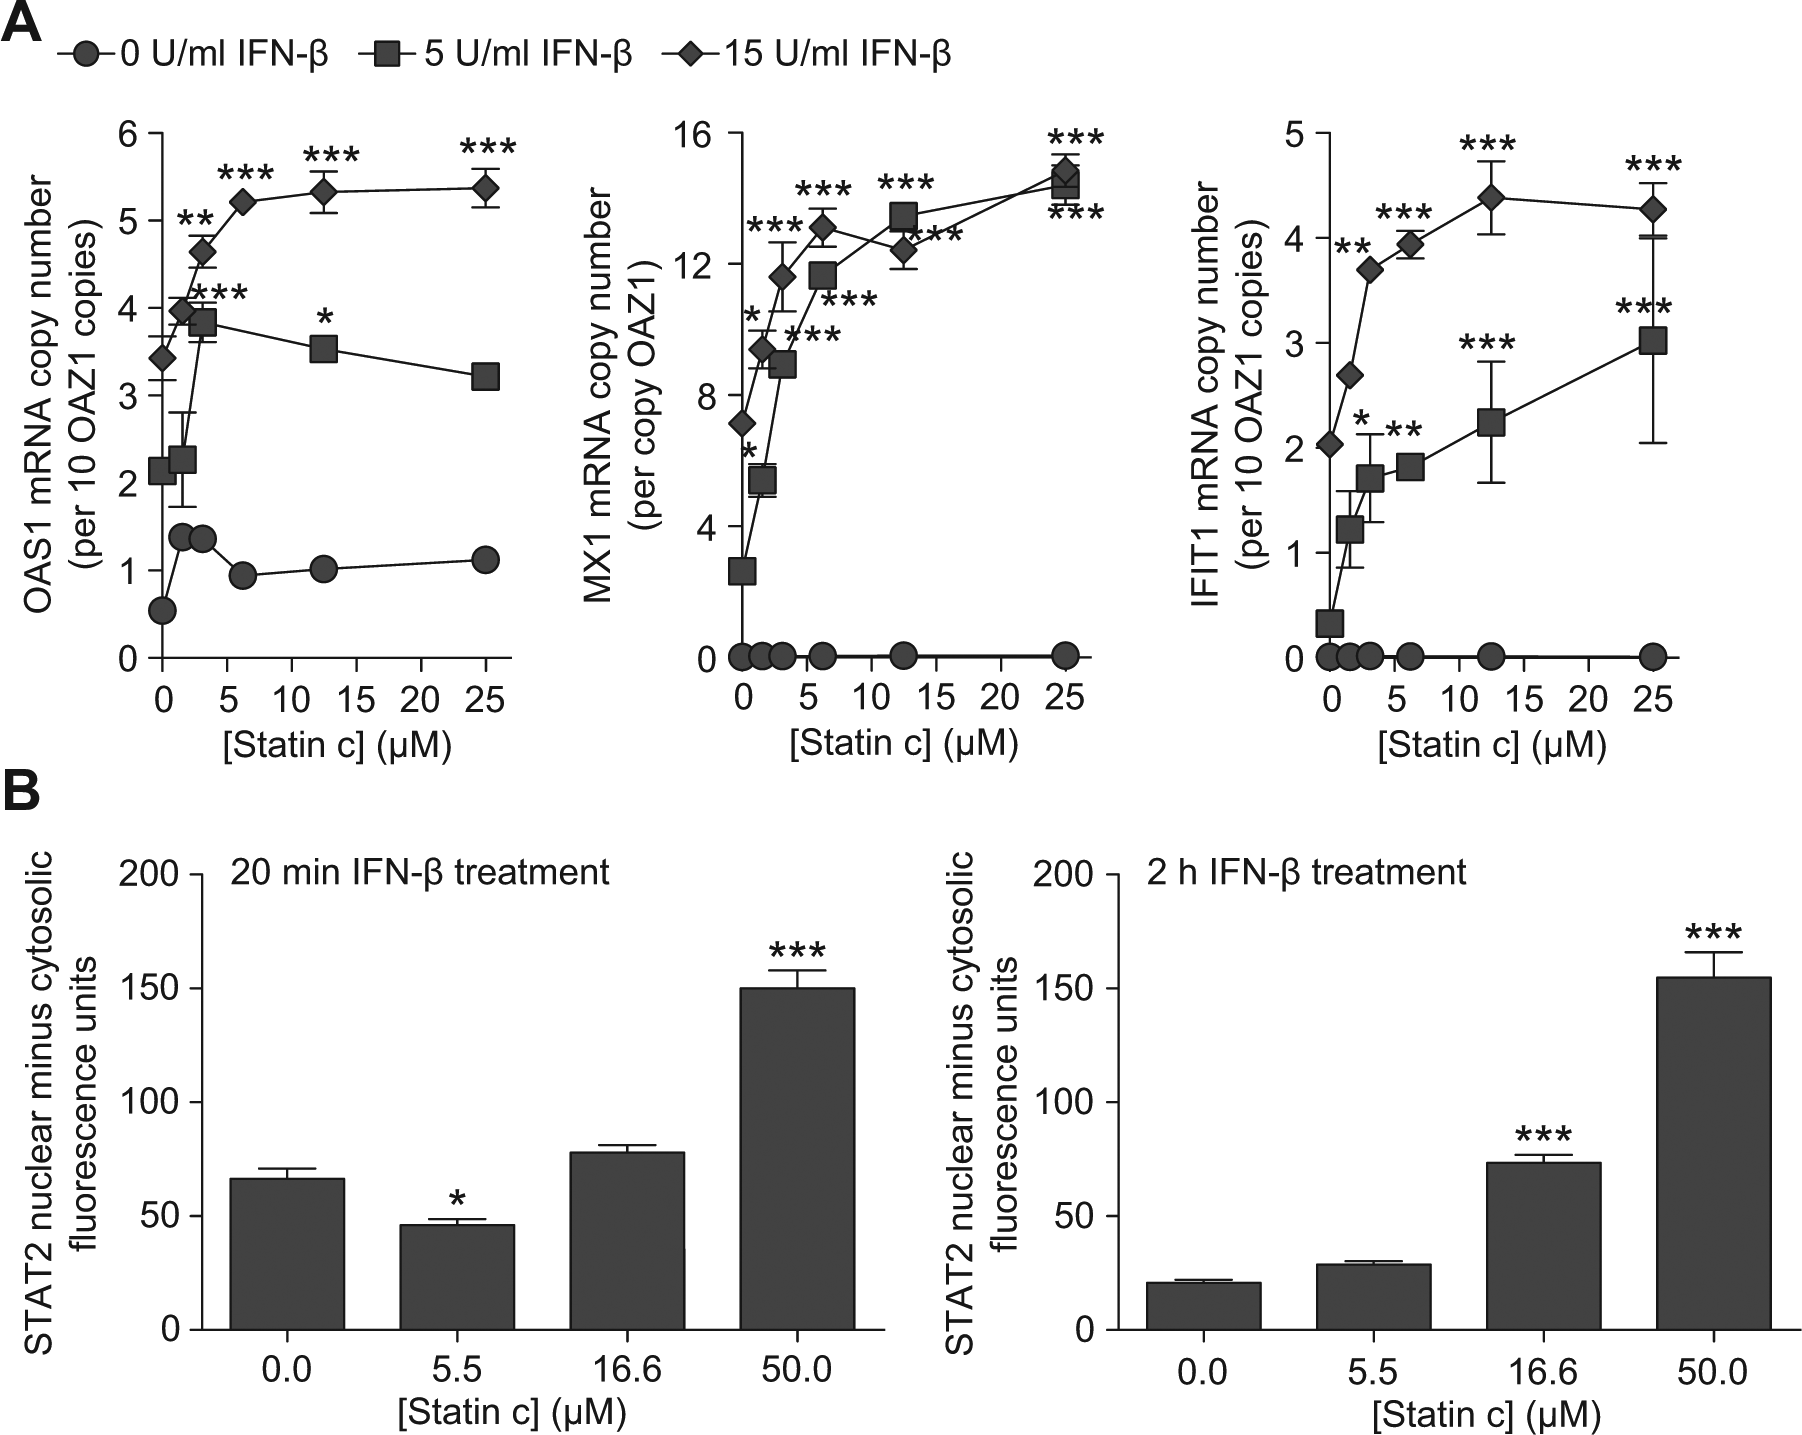
The interferon (IFN) signal-enhancing property of statin c is validated in orthogonal assays for (
To further confirm the effect of select statins on IFN signaling, we also assessed STAT2 nuclear retention as a measure of IFN-β–dependent STAT2 activation. After type 1 IFNs bind the receptor, STAT2 binds to the receptor, enabling recruitment of STAT1 and release of the phosphorylated STAT1-STAT2 heterodimer in the cytoplasm (
Fig. 1A
). The STAT1-STAT2 heterodimer recruits IRF9, and this complex translocates to the nucleus and binds with the ISREs, yielding ISG transcription. Prolonged STAT1 phosphorylation may even be a feature of increased antiviral activity.
6
To determine whether statins might enhance STAT1-STAT2 translocation as a measure of IFN signal enhancement, we developed a high-content imaging assay for monitoring STAT1-STAT2 nuclear translocation (
Validation of IFN Signal Enhancers for Antiviral Activity
To validate our hits in a more biologically relevant context, we assessed the antiviral activity of select statins. In the first set of experiments, we found that statins with potent ISRE-enhancing activity caused a concentration-dependent decrease in the level of two picornaviruses, EMCV and HRV-A1, in 2fTGH cells ( Fig. 6A ). Statins caused maximal decreases of 93% to 96% in EMCV level and 52% to 70% in HRV-A1 level. The IC50 values for antiviral activity correlated with potencies for ISRE-enhancing activities ( Figs. 6B and 4B ).
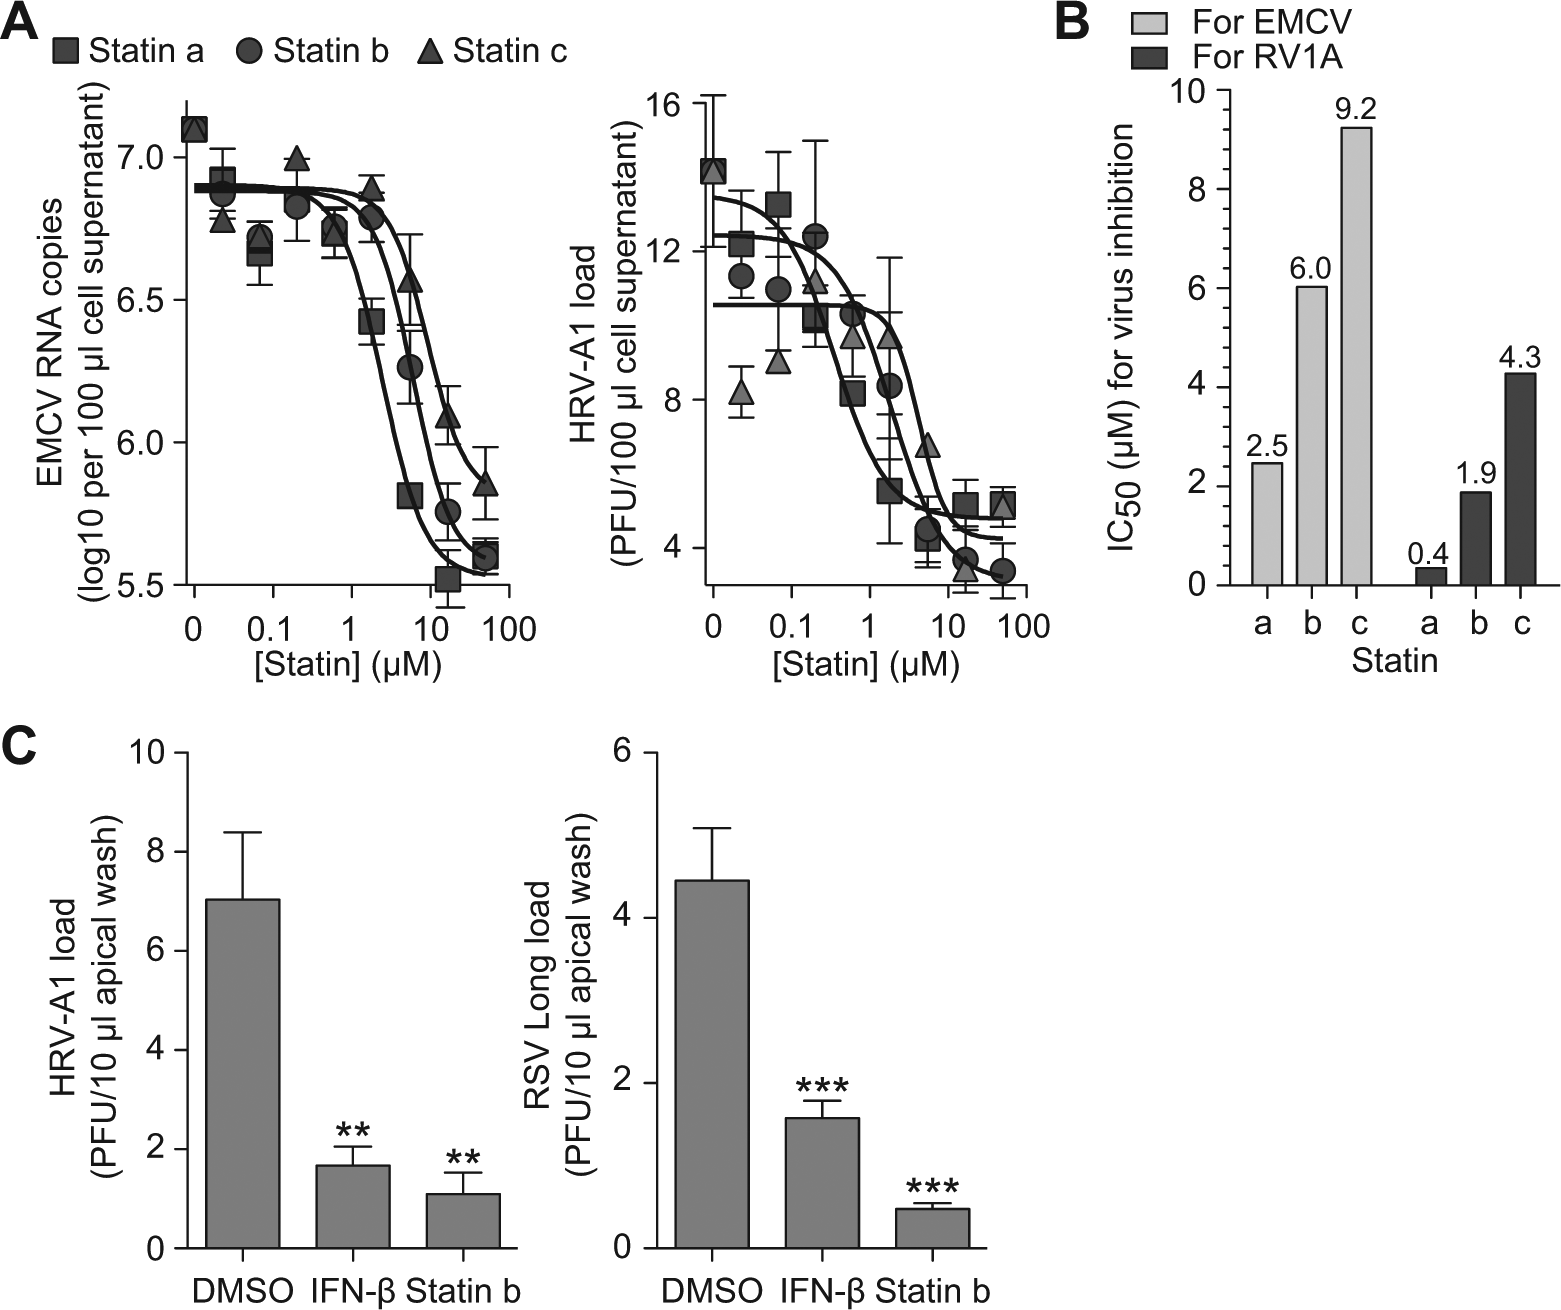
Interferon (IFN) signal-enhancing statins show improved antiviral activity. (
We then moved to test the antiviral activity of statins against common respiratory pathogens (picornavirus HRV-A1 and paramyxovirus RSV) in primary-culture hTECs, which are highly predictive of in vivo findings.15,22 We found that statin b treatment of infected hTECs caused a decrease in viral titers for HRV-A1 (by 83%) and RSV (by 89%), effects similar to that of IFN-β treatment (100 U/mL) ( Fig. 6C ), suggesting that statin b exerts a biologically relevant antiviral effect. Together, these results indicate that our screening strategy was able to identify compounds as IFN signaling enhancers at a level that translates to corresponding functional activity as antiviral compounds.
Discussion
In this study, we developed and applied a new HTS design and analysis method that enables data integration and hit picking across multiple phenotypic screens. Central to this is the addition of a standard curve that allows transformation of assay data to biologically relevant units, allowing both cross-screen normalization and interpretation of results in their functional context. We validated the approach with confirmatory testing of representative hit compounds, as well as an extended analysis of statin analogues as a structural class with significant IFN signal-enhancing and antiviral activity. We found that the most potent statins for augmenting IFN-β–driven ISRE activity showed significant efficacy for ISG expression and STAT2 activation. Moreover, statin enhancement of IFN signaling translated to antiviral activity against EMCV and HRV-A1 picornaviruses in the 2fTGH cell line (the parent screening line) and against HRV-A1 and RSV in primary human airway epithelial cells cultured under physiologic conditions.
Cotreatment with IFN-β increased but was not required for the statin antiviral effect. However, IFN-β costimulus was required for statin-induced enhancement of ISRE activity and ISG expression. Two factors might contribute to this discrepancy. First, viral replication results in activation of the pattern recognition receptors and subsequent production of endogenous IFN, which may drive sufficient IFN signaling for augmentation by statin. Second, IFN-independent antiviral effects of statins may be responsible, consistent with the observation that statins, more formally 3-hydroxy-3-methylglutaryl-CoA (HMG-CoA) reductase inhibitors, can inhibit viral entry and replication by HMG-CoA reductase inhibition–dependent decreases in mevalonate and subsequent decreased prenylation of host proteins.23–25 While others have reported the inhibition of sterol synthesis by type 1 IFN signaling in macrophages,26,27 ours is the first evidence that statin treatment results in enhancement of IFN signaling. In evaluating some statins, Ikeda et al. 24 did not find type 1 IFN signal enhancement. Discrepancies between our results and theirs may be due to different drug incubation times, which statins were tested, and cell type. Furthermore, statins may have multiple modes of antiviral action, which could explain the discordance between observed antiviral capacity of statins and their HMG-CoA reductase inhibitory potencies. 24 Exactly how statins augment IFN signaling has yet to be determined, and both this and a full understanding of statin antiviral activity are the subject of future studies. On the basis of these data, however, we conclude that statins show promise both as treatment for active viral infections and as prophylaxis in times of epidemic threat, in the elderly, or even in young children to prevent virus-induced development of chronic respiratory disease. 28
The term qHTS has been used to describe screening of compounds at multiple concentrations, after which compound concentration-response curves are fit to calculate IC50/EC50 values, depending on whether a gain-of-function or loss-of-function screen is performed.29,30 In this type of analysis, raw data are scaled to a positive control (a high concentration for a positive control compound) and a negative control. In the present study, rather than scaling linearly, we fit each test data point to a complete biological response curve for the phenotype of interest (ISRE-regulated gene transcription) produced by the native agonist (IFN-β). Accordingly, we have designated this methodology quantifiable biological response HTS (qbrHTS), since it requires normalization of screening data to the response generated by a biologically relevant molecule or ligand. In addition to enabling hit picking across multiple screens, this methodology also reduces the impact of systemic drift, potentially eliminating the need for interplate calibrators in large screens. Our analysis allowed us to eliminate weaker hits called by analysis of data for individual screens. Thus, when the data for two library screens were considered together, some of these hits could be eliminated from the hit list since they were now revealed to be significantly less active. Moreover, after performing the analysis, we recognized that there is an additional benefit to a combined analysis. Not only are weaker or less active hits eliminated from validation and subsequent work, but also stronger or more active compounds are picked as hits that would have been excluded from the list of hits based on individual analyses at any given statistical threshold. In the present case, 9 hits were called from the NCI library and 23 hits from the Spectrum library based on independent analyses. Using the combined qbrHTS analytical approach, 2 hits were called from the NCI library and 43 from the Spectrum library, increasing the total number of hits from 32 to 45. The hits in the two types of analyses are quite different, thereby leading to improved prioritization and resource allocation of postscreening development efforts.
There is another benefit to normalization by curve fitting to a biological response. In our case, the expression of screening data as effective IFN concentrations provides an index that is more applicable to a biological system. This type of information can provide more relevant insight into functional implications for hit compounds. For example, interferon activity is more readily extrapolated to potential in vitro and in vivo antiviral activity than a percentage increase in luminescence units for ISRE activity. The biological readout instead enables the investigator to make more informed decisions in designing validation experiments. This type of normalization to the response curve for a biologically relevant ligand is especially useful when a good tool compound is not available for use as a positive control, as would be the case when screening for first-in-class drugs, such as IFN signal enhancers. The method also offers advantages when screening for relatively small increases in gain of function due to its robustness. We found that it was unlikely that a small molecule would produce the magnitude of response as great as the native ligand at high concentrations, particularly at the transcriptional level. However, a maximal response might be undesirable due to the known autoimmune and toxic side effects of IFN treatment.2,4 Furthermore, the balance between type 1or 3 versus type 2 IFN signaling has to be preserved to ensure adequate antiviral as well as bacterial host defense states. 31 Thus, screening for compounds that result in smaller increments of ISRE activity would be advantageous and readily assessed by the present approach.
In summary, conventional normalization and z score–based hit selection on a per-library basis do not allow accurate analyses across multiple runs or screens. Herein, we describe an alternative approach that we have designated qbrHTS, wherein screening data are converted to a biologically relevant readout by fitting to a concentration-phenotype response curve produced by a relevant ligand. This approach allows for the exclusion of less active compounds and enrichment of more active compounds in the hit list based on a more accurate analysis of data from multiple screens achieved by assessing activity across the combined data set rather than status as an outlier within an individual screen. As such, it helps avoid costly validation of lower activity compounds and adds value to postscreening drug discovery efforts. Given the number of possible batch effects in a screening campaign, we believe that application of this approach for other targets or phenotypes, while requiring some additional effort in the assay development and screening stages, will enhance the reliability and accuracy of hit selection, ultimately leading to better rates of hit-to-lead development.
Footnotes
Acknowledgements
We thank Dr. Steven Brody and the Airway Epithelial Cell Core supported by the Children’s Discovery Institute of St. Louis Children’s Hospital and Washington University for assistance and advice in the use of primary-culture airway epithelial cells.
Declaration of Conflicting Interests
The authors declared the following potential conflicts of interest with respect to the research, authorship, and/or publication of this article: Dr. Patel is the recipient of a Roche Postdoctoral Fellowship, and Dr. Holtzman was the Principal Investigator on research grants to Washington University from Forest Labs and Hoffmann-La Roche.
Funding
The authors disclosed receipt of the following financial support for the research, authorship, and/or publication of this article: This work was supported by grants from the National Institutes of Health (NIAID AADCRC U19-AI070489 to MJH, MRCE U54-AI05160 to MJH, NHLBI K08-HL083095 to ACP, and AADCRC New Investigator Award to DAP), Children’s Discovery Institute PD-II-2012-243 to ACP, and Martin Schaeffer Fund to MJH.
References
Supplementary Material
Please find the following supplemental material available below.
For Open Access articles published under a Creative Commons License, all supplemental material carries the same license as the article it is associated with.
For non-Open Access articles published, all supplemental material carries a non-exclusive license, and permission requests for re-use of supplemental material or any part of supplemental material shall be sent directly to the copyright owner as specified in the copyright notice associated with the article.