
Abstract
Numerous assays have been developed to investigate the interactions between G-protein–coupled receptors (GPCRs) and their ligands since GPCRs are key therapeutic targets. Reporter-based assays using the cAMP response element (CRE) coupled with bioluminescence from a luciferase reporter have been used extensively in vitro with high-throughput screens (HTS) of large chemical compound libraries. We have generated a transgenic mouse model (CRE luc) with a luciferase reporter under the control of a synthetic promoter that contains several CREs, which supports real-time bioimaging of GPCR ligand activity in whole animals, tissues, or primary cells. In the CRE luc model, GPCR signaling through the cAMP pathway can be detected from the target GPCR that is in a native cellular environment with a full complement of associated receptors and membrane constituents. Multiple independent lines have been produced by random integration of the transgene, resulting in tissue expression profiles covering the major organs. The goal of the CRE luc model is to accelerate the transition from HTS to profiling of GPCR small-molecule leads in preclinical animal disease models, as well as define the mechanism of action of GPCR drugs in three experimental formats: primary cells, tissue homogenates, and whole animals.
Introduction
For more than a decade, high-throughput screening (HTS) assays have been applied to drug discovery projects as a result of synthesis technologies such as combinatorial chemistry or automated synthesis that have increased compound library size and complexity. In addition, advances in human genetics, molecular biology, and several “omics” have increased the number of drug targets. The combination of these two trends of larger chemical libraries and a wider spectrum of potential targets has increased the throughput strategies for HTS. While the capacity for screening in the early parts of the drug development pipeline has continuously increased, a similar increase in lead compound optimization steps has not occurred, in the phase transition from in vitro assays to preclinical animal model assays.
Significant attrition of potential drug candidates in the current drug discovery paradigm is encountered in the phase transition from cell-based reporter assays to preclinical animal models for several reasons. Numerous in vivo models are available that recapitulate either all or part of a particular human disease, but their capacity to profile a pool of lead compounds within a short period is limited. Failures to alter the induced disease outcomes of animal models are poorly understood yet result in the large attrition rates of lead compounds. Finally, the highly variable and frequently poor predictability of clinical outcomes from studies of disease animal models have progressively eroded the confidence in performing this stage for small molecular drug development. While demonstrating lead compound activity in animal models of disease remains a significant milestone for progression of new small-molecule drugs, it remains a low-throughput step that requires a large resource investment and is insufficient at quantitatively ranking a pool of chemical leads identified from in vitro screening.
In vivo bioluminescent imaging (BLI) is a sensitive tool that is based on detection of light emission from cells or tissues. Because mammalian tissues do not naturally emit bioluminescence, in vivo BLI has considerable appeal because images can be generated with very little background signal, and BLI is emerging as a powerful technology for multiple therapeutic areas.1–3
The utility of reporter gene technology makes it possible to analyze specific cellular and biological processes in a living animal through imaging methods. 1 For several years, bioluminescence-based reporter gene assays have been employed to measure functional activity of G-protein–coupled receptors (GPCRs). 4 By combining animal engineering with molecular imaging techniques, it has become possible to conduct dynamic studies on specific molecular processes in living animals. This approach could potentially affect preclinical animal model protocols, thus widely improving the cycle time and success of lead optimization at this stage in drug development. 5
Molecular and functional imaging applied to the initial stages of drug development can provide evidence of biological activity and confirm that a small-molecule compound lead has an effect on its intended target. There is considerable expectation that investment in molecular imaging technology and mechanistic animal models could enhance drug development. 6 The advantage of molecular imaging techniques over more conventional readouts is that they can be performed in the intact organism with sufficient spatial and temporal resolution for studying biological processes. Furthermore, it allows a repetitive, noninvasive, uniform, and relatively automated study of the same animal model at different time points, which increases the statistical power of longitudinal studies plus reduces the number of animals required, as well as the associated cost of lead optimization.
Mechanistic animal models, particularly BLI-based models that are founded on the same reporter assays used in HTS, could offer a bridge between in vitro biological assays and preclinical animal model efficacy studies. Compared with disease animal models, mechanistic BLI reporter models require less resources, have a higher throughput of lead compounds, and generate quantitative data for compound ranking and optimization. In addition, mechanistic BLI reporter models can quantitatively rank compounds in three formats: primary cells, tissues, and whole animals.
Many transgenic animals engineered with different reporters have been employed in the study of molecular processes such as drug metabolism, 6 genotoxicity, 7 and other potential toxic effects of compounds. 8 To achieve design goals, a GPCR reporter animal model suitable for molecular imaging studies should incorporate genetic elements to achieve a high level of reporter expression to allow a large window of bioluminescent detection and in every cell type to support a broad, acute assay of ligand biodistribution.
The CRE luc transgenic mouse model was designed to incorporate an HTS GPCR assay to screen for activation of GPCRs either directly through the cAMP intracellular signaling pathway or indirectly through the phospholipase C (PLC) pathway. 9 This is a reporter model that supports monitoring of GPCR signaling in a native environment, where the critical membrane interfaces are interacting with the targeted GPCR. The CRE luc mechanistic model is an initial attempt to address the difficult transition from in vitro to preclinical animal model assays frequently encountered in GPCR pharmaceutical programs and to supply tools for quantitatively assaying GPCR receptor activation in a native environment.
Previous GPCR BLI mouse models include an ovarian cancer model tracking the interaction of CXCL12 with CXCR4 10 and a universal GPCR BLI model that uses β-galactosidase activity to image receptor activation. 11 Both of these models are xenografts of engineered cell lines and are not able to report a GPCR’s activation in native states from multiple organs. The ERE-luci BLI mouse, a germ-line transgenic model, overcomes this limitation and generates several novel conclusions for compounds with estrogen-like activity from BLI studies.12,13
We present our model design and development process plus several experiments to demonstrate the GPCR biology and drug development potential that can be accessed with the CRE luc mouse model. We have arranged to make the mouse model available through Taconic (Hudson, NY) to the GPCR community to enhance its utility as a research tool by transferring five key lines with detailed characterization profiles (see
Material and Methods
Transgene Construction
Insulator elements were cloned by PCR from the vector pCpG-LacZ (InvivoGen, San Diego, CA) and combined into a destination vector, pDest2XMARS, that was designed specifically for use with the multisite Gateway Pro Plus Cloning system (Invitrogen, Carlsbad, CA). For all PCR cloning steps, the fragments were amplified from the specified vector through the use of PCR SuperMIx Hi Fidelity (Invitrogen) and fragment-specific primers. The PCR products were then subcloned into a pCR2.1 vector by TOPO cloning followed by DNA sequence confirmation (GENEWIZ, South Plainfield, NJ).
The 6×CRE element was synthetically generated at DNA2.0 and with an attL1 on the forward primer and an attR5 on the reverse primer for four-fragment Gateway cloning. The HSV TK minimal promoter was PCR cloned from a Sanofi DNA vector “661 CreLuc” (Bridgewater, NJ) and with an attB5 site on the forward primer and an attB4 site on the reverse primer. Luciferase complementary DNAN (cDNA) was PCR cloned from the vector pGL4.10 (Promega, Madison, WI). Luc primer sequences have an attB4r site on the forward primer and an attB3r site on the reverse primer. The human growth hormone polyA tail was PCR cloned from the vector pOGH (Nichols Institute Diagnostics, San Juan Capistrano, CA) and with an attB3 site on the forward primer and an attB2 site on the reverse primer. In the final vector construction, the four components of the transgene—6×CRE, HSVTK min, luciferase cDNA, and the hGH polyA—were recombined with the pDest2XMARs destination vector according to the standard Invitrogen protocol and then sequenced confirmed.
Generation of Transgenic Mice
The transgene plasmid was digested with Acc65I and PmeI, and the fragment containing the transgene was purified and microinjected into FVB/NTAC (Taconic, Hudson, NY) one-cell embryos following the protocols in Transgenic Animal Technology: A Laboratory Handbook. 14
Transgenic-positive founder mice were identified by PCR, which produced a specific 405-bp PCR product. The PCR reaction mix was 1× QIAGEN PCR buffer with MgCl2 (QIAGEN, Valencia, CA), 0.2 mM dNTPs, 0.4 µM primers, and 0.5 U Taq polymerase. Cycling conditions were as follows: 1 cycle at 94 °C for 5 minutes followed by 35 cycles at 94 °C for 45 seconds; 57 °C for 45 seconds; 72 °C for 1 minute, then 1 cycle at 72 °C for 5 minutes. The genotyping primers were the following:
Luc2-forward primer: 5′-GAAGATGCCAAAAACATT-AAGAAG-3′
Luc2-reverse primer: 5′-GATCTTTTGCAGCCCTTTCT-3′
CRE luc Induction and Bioimaging in Transgenic Mice
Cheng et al. 15 have reported induction of cAMP plasma levels in response to different phosphodiesterase (PDE) inhibitors. Following this protocol and including various forskolin concentrations, we confirmed the optimal conditions for cAMP induction to be dosing FVB/N mice intraperitoneally (IP) with a combination of 10 mg/kg rolipram (Sigma, St. Louis, MO) and 5 mg/kg water-soluble forskolin (Calbiochem, Damstadt, Germany).
Whole-animal bioimaging of the mice followed the protocol previously described by Contag et al. 16 Mice were anesthetized with isoflurane and injected subcutaneously (SC) with 250 mg/kg d-luciferin (Xenogen, Alameda, CA) dissolved in Dulbecco’s phosphate-buffered saline (DPBS) without Ca2+ or Mg2+. Seven minutes after the luciferin injection, mice were placed in the IVIS Lumina (Xenogen) and imaged with 1-min exposures every 4 min for 45 min. When imaging five mice at a time, the field of view was set at E, wide-angle lens; binning set to 4; and binning, f-stop set at 1.2. Pseudo-color bioluminescent images were superimposed onto photographic images of the mice and analyzed using the Living Image 3.0 software (Xenogen). Luciferase activities were quantified as photon per second per centimeter squared (ps−1cm−2sr−1).
CRE luc founders were screened with forskolin plus rolipram, and expression was considered positive when the luciferase level in any tissue was above the background levels for the system. Founders expressing luciferase protein were then expanded by breeding to FVB/NTAC wild-type mice for two litters to supply offspring for further screening.
Primary Cell Culture Assays from CRE luc Mice
To prepare primary neuronal cultures, cortices were removed from E14 or E17 embryos from lines with a high CNS expression (line 69, 175, 187, or 219). After dissecting the cortex, each brain was then placed in Hank’s balanced salt solution without Ca+2 and Mg+2 and kept on ice. The cortices were then transferred into 5 mL Dulbecco’s modified Eagle’s medium with 10% fetal bovine serum and the tissue disrupted by pipetting for 20 times to produce a cell suspension. The individual neurons were then plated onto a 96-well assay plate at 50,000 cells/well in complete neurobasal medium (cat. no. 21103; GIBCO, Carlsbad, CA) supplemented with b27 (GIBCO), 25 mM glutamate, and 0.5 mM glutamine. Opaque white plates with clear bottoms were used and assays run in triplicate between days 3 and 10 in culture depending on the GPCR ligand combination.
For Gs compounds, the in vitro cortical neuron assay was run in triplicate with E18 embryos as the primary cell source and forskolin at 5 µM, rolipram at 10 µM, and the Gs agonist, isoproterenol (Sigma) or dopamine (SKF82958; Sigma), at 10 µM. After 4 h of drug treatment, the Bright Glo luciferase assay system (Promega) was added and assayed on the Packard TopCount microplate scintillation and luminescence counter (PerkinElmer, Waltham, MA). The plates were counted using the SPC mode at 24 °C with a count time of 1.2 s per well. TopCount data are presented as counts per second (cps).
For Gi compounds, the assay was run on day 3 in culture, and forskolin at 10 µM was first added to increase the Gi agonist response window, and then AMN082 (Tocris, Bristol, UK) was added at 1, 10, and 100 nM and 1 µM. The assay was performed on a TopCount with Bright Glo at 4 and 8 h.
Screening mGluR7 allosteric agonist compounds used forskolin 50 µM and rolipram 10 µM to increase the response window to this Gi receptor. The assays were run in triplicate on day 7 in primary neurons for 6 h. A dose curve from 10 µM to 1 nM for AMN082 was run as the control reference along with 32 mGluR7 program leads. The dose curves for all other Gi compounds were run with 10 µM forskolin and without rolipram.
Tissue Homogenates and Luciferase Assay
To induce the CRE luc reporter, animals were dosed IP with a combination of 5 mg/kg forskolin and 10 mg/kg rolipram with 1% DMSO (Sigma) in DPBS (Invitrogen). Four hours later, the animals were sacrificed by CO2, and target organs were removed and frozen on dry ice. For the luciferase assay, the tissues were homogenized in 1 mL of 5× cell culture lysis buffer (Promega), incubated on ice for 5 min, and then spun in a centrifuge for 5 min. Then, the 20 µL of supernatant was assayed with a luciferase assay system (Promega). Protein concentrations of the samples were measured with the DC protein assay kit (Bio-Rad, Hercules, CA).
Results and Discussion
CRE luc Transgene Design
The CRE luc transgene contains a promoter (6×CRE) that is responsive to activation by CREB via the cAMP or PLC pathway (
The luciferase reporter can be detected using the Caliper IVIS Lumina (Xenogen) system (
The transgene construct has several elements to enhance luciferase expression in transgenic mice (
CRE luc Mouse Model Generation
From microjection of the CRE luc transgene, 425 FVB/NTAC pups were born, of which 112 were transgene positive (26.4%) by PCR genotyping. We expanded our initial efforts at generating CRE luc–positive lines and used random integration for overexpression of the transgene to ensure the greatest possible variation of luciferase-expressing phenotypes to generate lines with a sufficient ligand receptor activation window.
CRE luc Transgenic Mouse Screening Tree
To select an optimal CRE luc induction protocol, we expanded the example by Cheng et al., 15 who determined a 5× induction of plasma cAMP level using 10 mg/kg rolipram (per os [PO]). In our assay, FVB/NTAC wild-type mice were administered various forms of forskolin and/or rolipram for 20 min, and then cAMP plasma levels were determined by enzyme-linked immunosorbent assay (ELISA; Assay Design, Farmingdale, NY). Compared with vehicle alone (1% DMSO in phosphate-buffered saline [PBS]), the combination of water-soluble forskolin (H2OF: 5 mg/kg) and rolipram (10 mg/kg) together had the greatest elevation (15×) in cAMP plasma levels (data not shown).
The primary screen for CRE luc expression used founder mice induced to express luciferase by forskolin plus rolipram administration and then imaged before and after induction (+4 h) on the IVIS Lumina. This first-pass functional screen allowed the generation of a large number of founders and avoided the resource impact of having to first breed lineages for transgene expression screening.
From the 112 transgene DNA-positive founders, 89 (79.5%) were bioimaging positive and had detectable BLI signals above background. The functional elements of the transgene design more than doubled the typical frequency (10%–30%) of generating CRE luc–expressing lineages. As expected, the expression pattern in the founders varied between lineages due to the random integration of the transgene, and those with 5-fold induction in one or more tissues (2× in brain) were bred to supply additional offspring for further selection decisions in our screening tree. Offspring from the inducible lines supplied litter mates for confirmation of the initial whole-animal bioimaging pattern and isolated tissues for the luciferase enzyme assays. The bioimaging pattern of the offspring allowed us to confirm that the pattern of expression in the founders was passing through the germ line and genetically stable, as well as rapidly avoid lines with multiple transgene integrations. The tissue luciferase enzyme assays were an independent, quantitative assay of the transgene induction for further lineage selection. In the tissue dissections, we assayed luciferase in brain, spleen, kidney, heart, lungs, spinal cord liver, thymus, pancreas, skin, and intestine.
The level of CRE luc expression in different tissues allowed the selection of optimal lines with the highest expression levels in target tissues and with unique single or multiple patterns of expression. The enzyme assay also ensured that the CRE luc expression was clearly associated with a particular tissue. In most lines and for all those selected in the final round, luciferase expression was detected in nearly all tissues. The final set of lines was selected to contain peak luciferase expression in a pharmaceutically relevant target tissue (i.e., brain, pancreas, lung, spleen, and liver) and then applied to reference and exploratory profiling with GPCR ligands (
Fig. 1
and
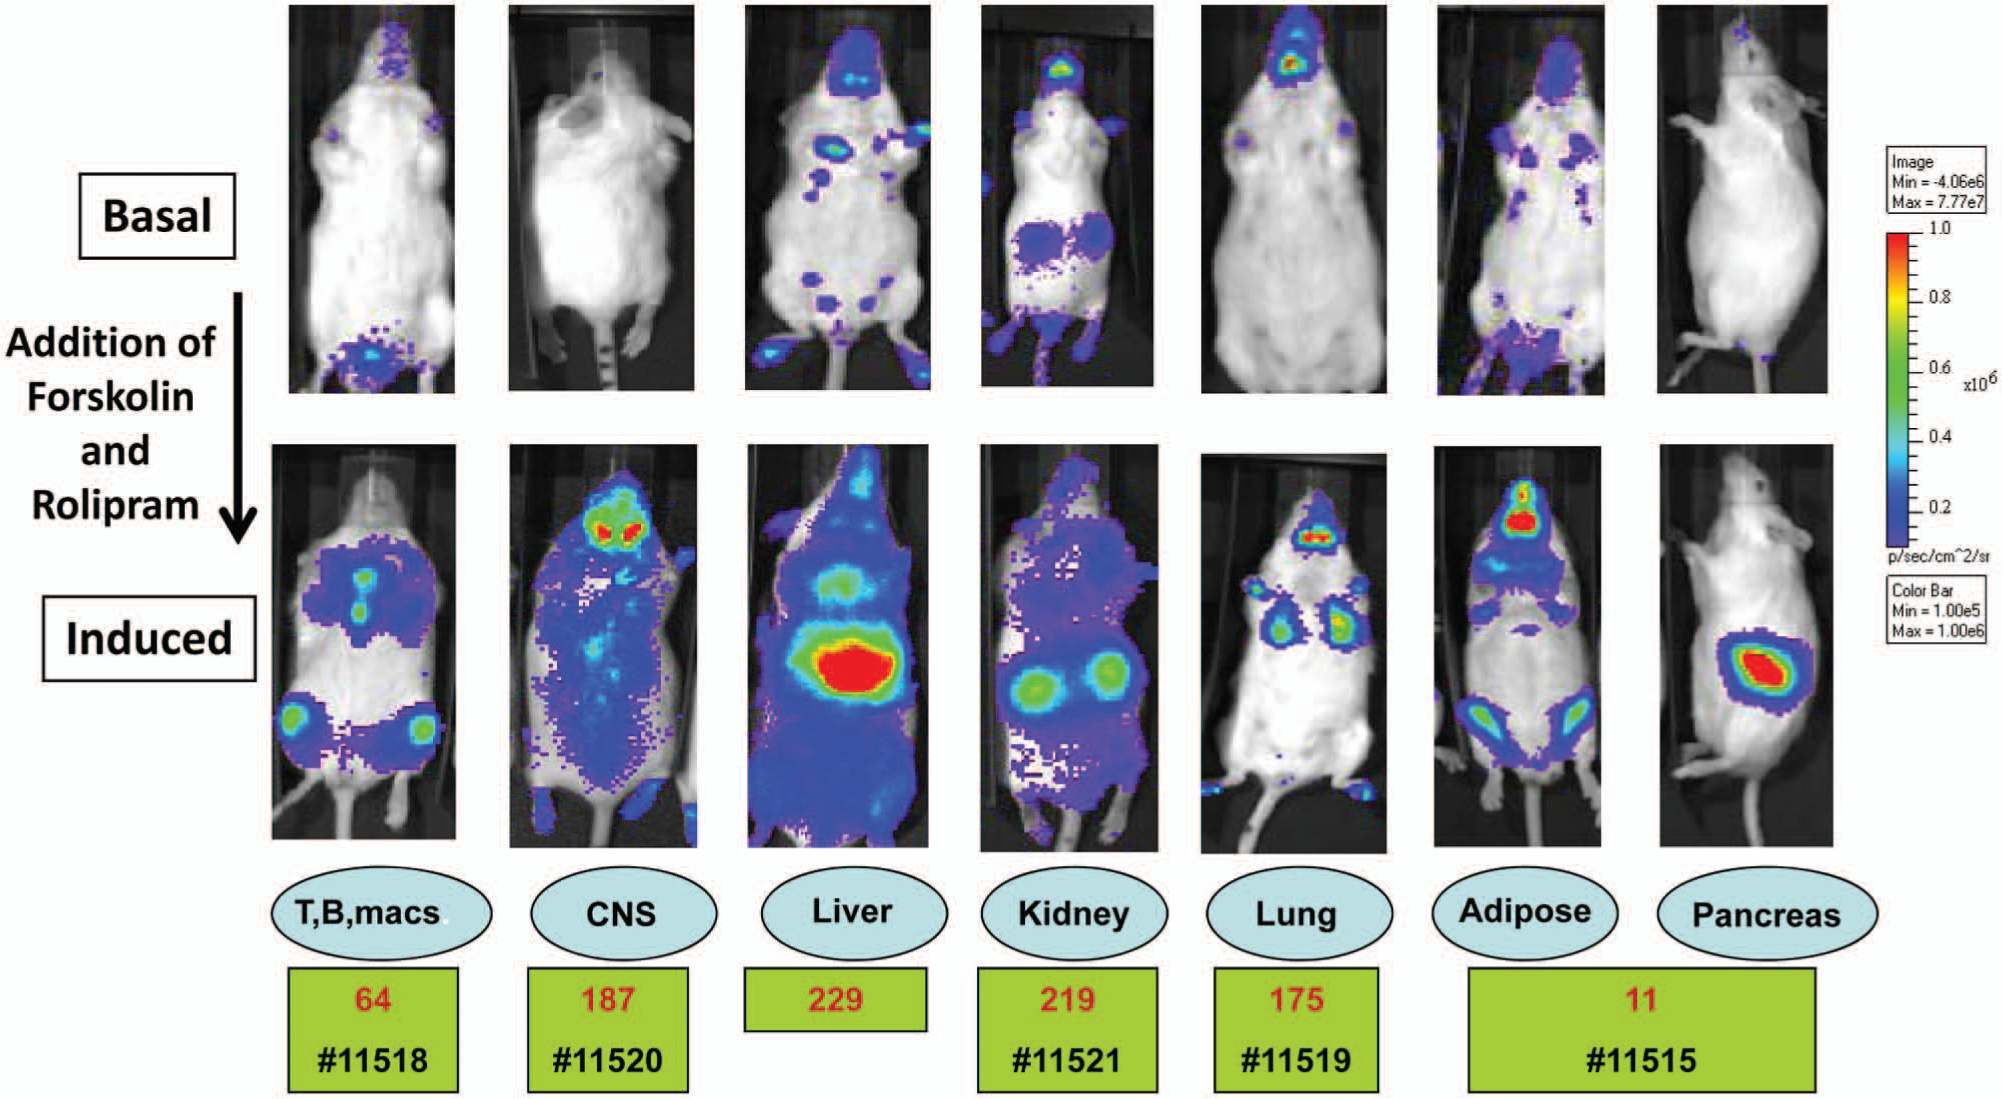
Six CRE luc transgene and mouse lines were selected from 86 founders with optimal and diverse patterns of expression but with one major organ displaying peak induction or a bioimaging signal. All lineages were induced with 5 mg/kg forskolin and 10 mg/kg rolipram intraperitoneally and then imaged at T = 0 and 4 h after induction. The top row contains the basal noninduced signal from the CRE luc transgenic. The bottom row of images is the induced results with the peak tissue for each line indicated above the identification numbers and quantified by the color scale on the right (photons/cm2/s). Taconic ID numbers are in black.
Gs Modulation of the Adrenergic Receptor (ADRβ1/2)
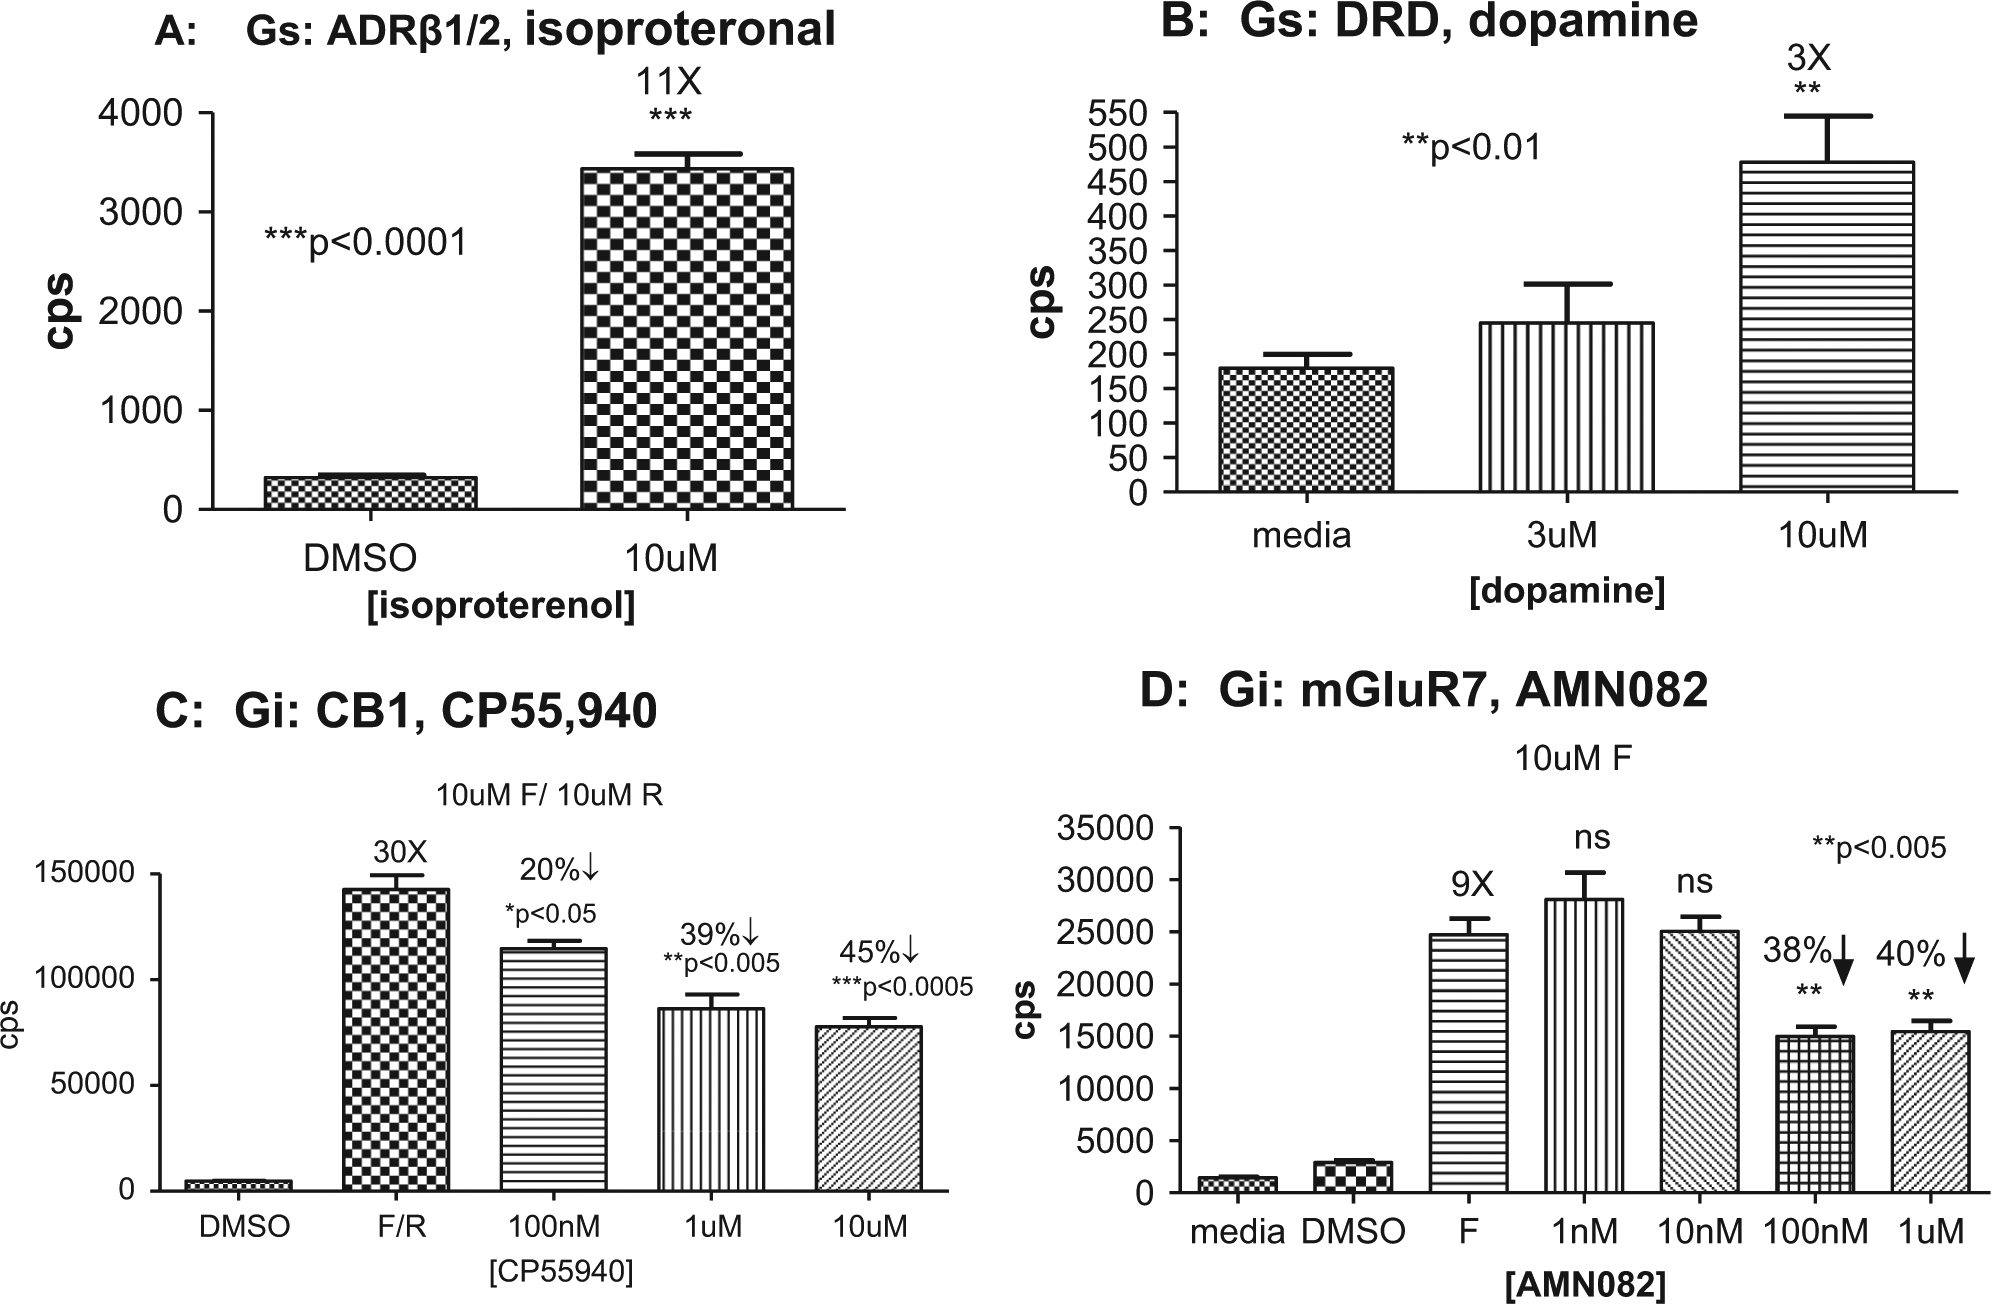
To demonstrate the ability of the CRE luc model to profile ligand activation, we first used the Gs agonist, isoproterenol, and assayed the adrenergic receptor’s (ADRβ1/2) response to this ligand in primary neurons, isolated tissue homogenates, and whole-animal bioimaging. Primary cortical neurons were isolated from line 187 at E18. After 3 days in culture, triplicate assays of the control (DMSO only) compared with isoproterenol (10 µm) at T = 0 and 4 h produced a highly significant (p < 0.001) difference in the luciferase signal and with an 11-fold induction over baseline ( Fig. 2A ). In whole animals from line 187, baseline bioimaging profiles were taken before compound dosing ( Fig. 3 ), and then isoproterenol was administered IP at 10 mg/kg and the bioimaging was repeated at 4 hours after administration. Restricting the bioimaging analysis software to the brain and spinal cord produced a 15-fold induction in both measurements that was statistically significant (p < 0.001). The small intragroup variation was due to a combination of using litter mates from line 187, which has a large CNS response window to forskolin induction; the ability to assay the same animal at different time points; and the IVIS software restricting the quantitative analysis to the target tissues. The magnitude of the response of the ADRβ1/2 receptor was similar both in vivo (15×) and in vitro (11×), displaying the fidelity of the CRE luc reporter system that was also observed with other GPCR compounds. The data set from the ADRβ1/2 activation by isoproterenol with line 187 illustrates the main application goal for the CRE luc mouse to serve as a bridging tool in compound advancement from in vitro to in vivo assays using the same reporter system in its native environment.
Gs and Gi agonist responses from CRE luc primary neurons. (
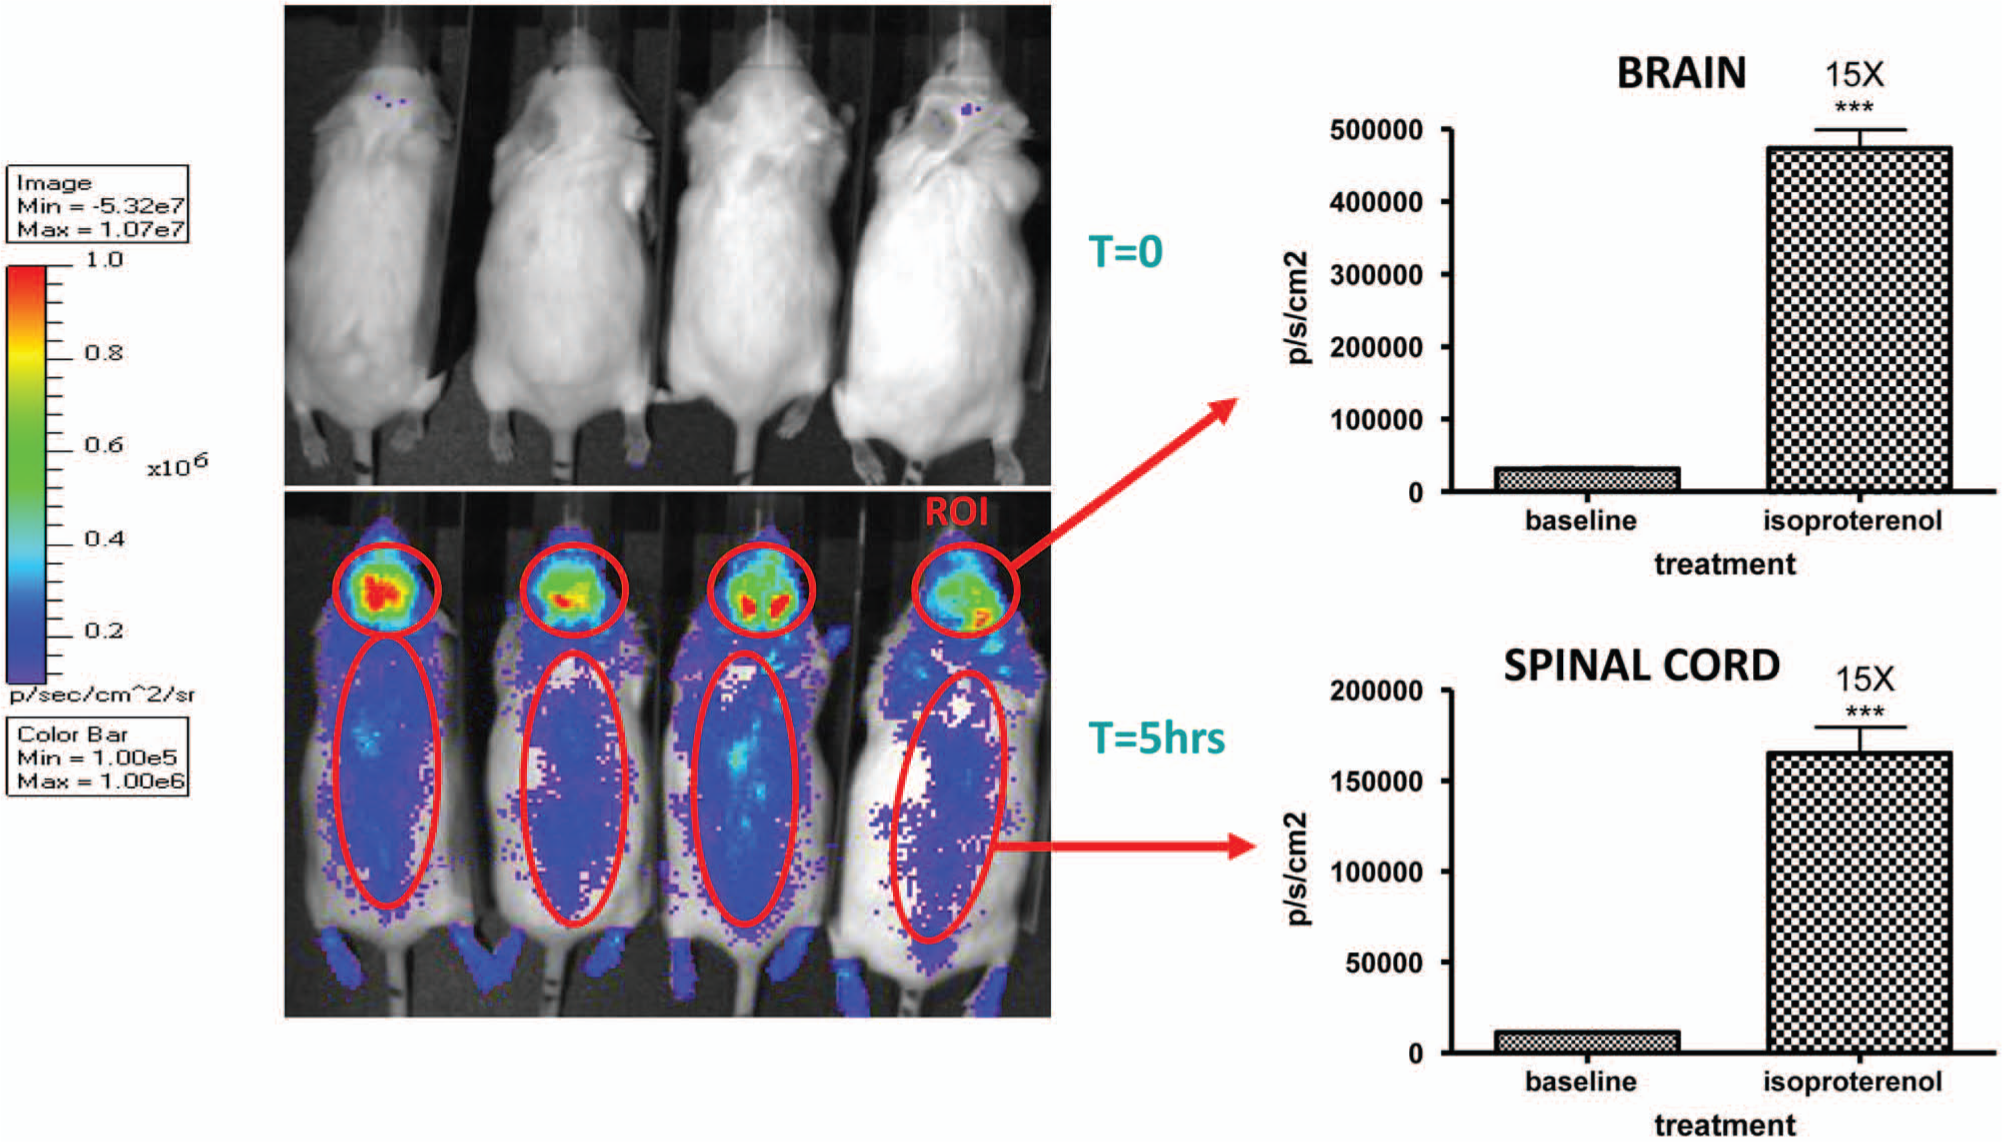
Response of line 187 (CNS luciferase expression) to isoproteronal in whole-animal bioimaging with isoproteronal administered at 10 mg/kg intraperitoneally and bioimaging performed at T = 0 and 5 h. The brain and spinal cord region-of-interest values increased 15-fold over baseline value, which was highly significant (***p > 0.001, n = 4, t test).
The CRE luc lines can serve as a source of primary cells with the GPCR reporter in its native environment and with no engineering change made in its protein structure or to its membrane environment. Initial analysis of ligand activation can first be confirmed in a less complex system, as a cellular isolate, before proceeding to more complex tissue or whole-animal analysis. Primary CRE luc cell culture can also support GPCR receptor specificity assays through the use of RNA interference (RNAi) or ligand competition assays, which are an important validation step in the CRE luc model since potentially any receptor (or combination of receptors) can be activated by a single ligand.
After profiling ligand activation in primary cells, more complex tissue profiles were assayed either ex vivo or through isolated tissue homogenates that assay luciferase enzyme levels (
After activation profiles are established from primary cells and tissues, ligand profiles are assayed in whole animals by bioimaging and incorporating dose responses and time course assays. Whole-animal bioimaging mechanistic assays compared with traditional disease animal model experimental designs are performed much more quickly since there are a reduced number of animals to be analyzed, with typical study groups of 4 to 10 animals each. Data analysis occurs the same day as the imaging session, which allows unknown end points or results in the assay to be defined as the study progresses. This feature imparts flexibility to the animal study and can save significant time in avoiding repetitive studies to capture overlooked data. The whole-animal bioimaging assay format can quantitatively define the site and magnitude of ligand activation plus support a quantitative comparison of similar compounds for selection of optimal lead structures and structure-activity relationships (SARs).
Gs Modulation of the D1 Dopamine Receptor (DRD1)
We profiled additional Gs ligands with primary cortical neurons from line 187 with dopamine as the ligand for D1 dopamine receptor (DRD1). We measured a 3-fold induction at 10 µM (p < 0.01) of the CRE luc reporter when compared with the media-only control ( Fig. 2B ).
Gi Modulation of the CB1 and mGluR7 Receptor
The Gi receptor subgroup of GPCRs contains a large number of pharmaceutical drugs and presents a challenge in profiling a Gi agonist or allosteric agonist for the CRE luc reporter system. We first assayed ligand activity for the CB1 receptor in d18 primary cortical neurons from line 187 using CP55940 (Sigma-Aldrich) in a dose-dependent manner ( Fig. 2C ) after 3 days in culture. Forskolin and rolipram at 10 µM increased the cAMP response of the CRE luc reporter and the CB1 agonist at 10 µM, 1 µM, and 100 nM decreased the luciferase signal (20%–45%) in a dose-dependent manner that was statistically significant (p < 0.05) at all 3 concentrations.
The mGluR7 receptor allowed us to profile an allosteric agonist in primary cortical neurons using the reference compound AMN082 (Tocris Bioscience). With primary cortical neurons from lines 187, 175, and 219, we first confirmed that the binding curves were similar for the reference Gi allosteric agonist AMN082 for mGluR7. The assay used E18 embryos cultured for 7 days and was run for 7 h with AMN082 at four concentrations, and the dose curves were run in combination with 50 µM forskolin and 10 µM rolipram. For line 187 ( Fig. 2D ), the 100-nM and 1-µM concentrations of AMN082 produced a 38% to 40% decrease in luciferase signal compared with forskolin plus rolipram–only controls, which was statistically significant (p < 0.005) from triplicate assays at each concentration. We then screened a pool of leads against 10 µM forskolin only (30), with some examples presented in Figure 4 . Comparing the dose responses of the project leads with the reference AMN082 compound, the Sanofi compound (A) ranked the highest in series. Several compounds from the mGluR7 lead series had binding curves similar to compound B, which were nonselective, or similar to compound C, which were inactive. The EC50s for the mGluR7 leads from the primary neuronal cells assays ( Fig. 4 ) were very similar to the mGluR7 transfected cell line EC50s, which was an additional indication of the fidelity and sensitivity of the CRE luc reporter in a native cell type (data not shown).
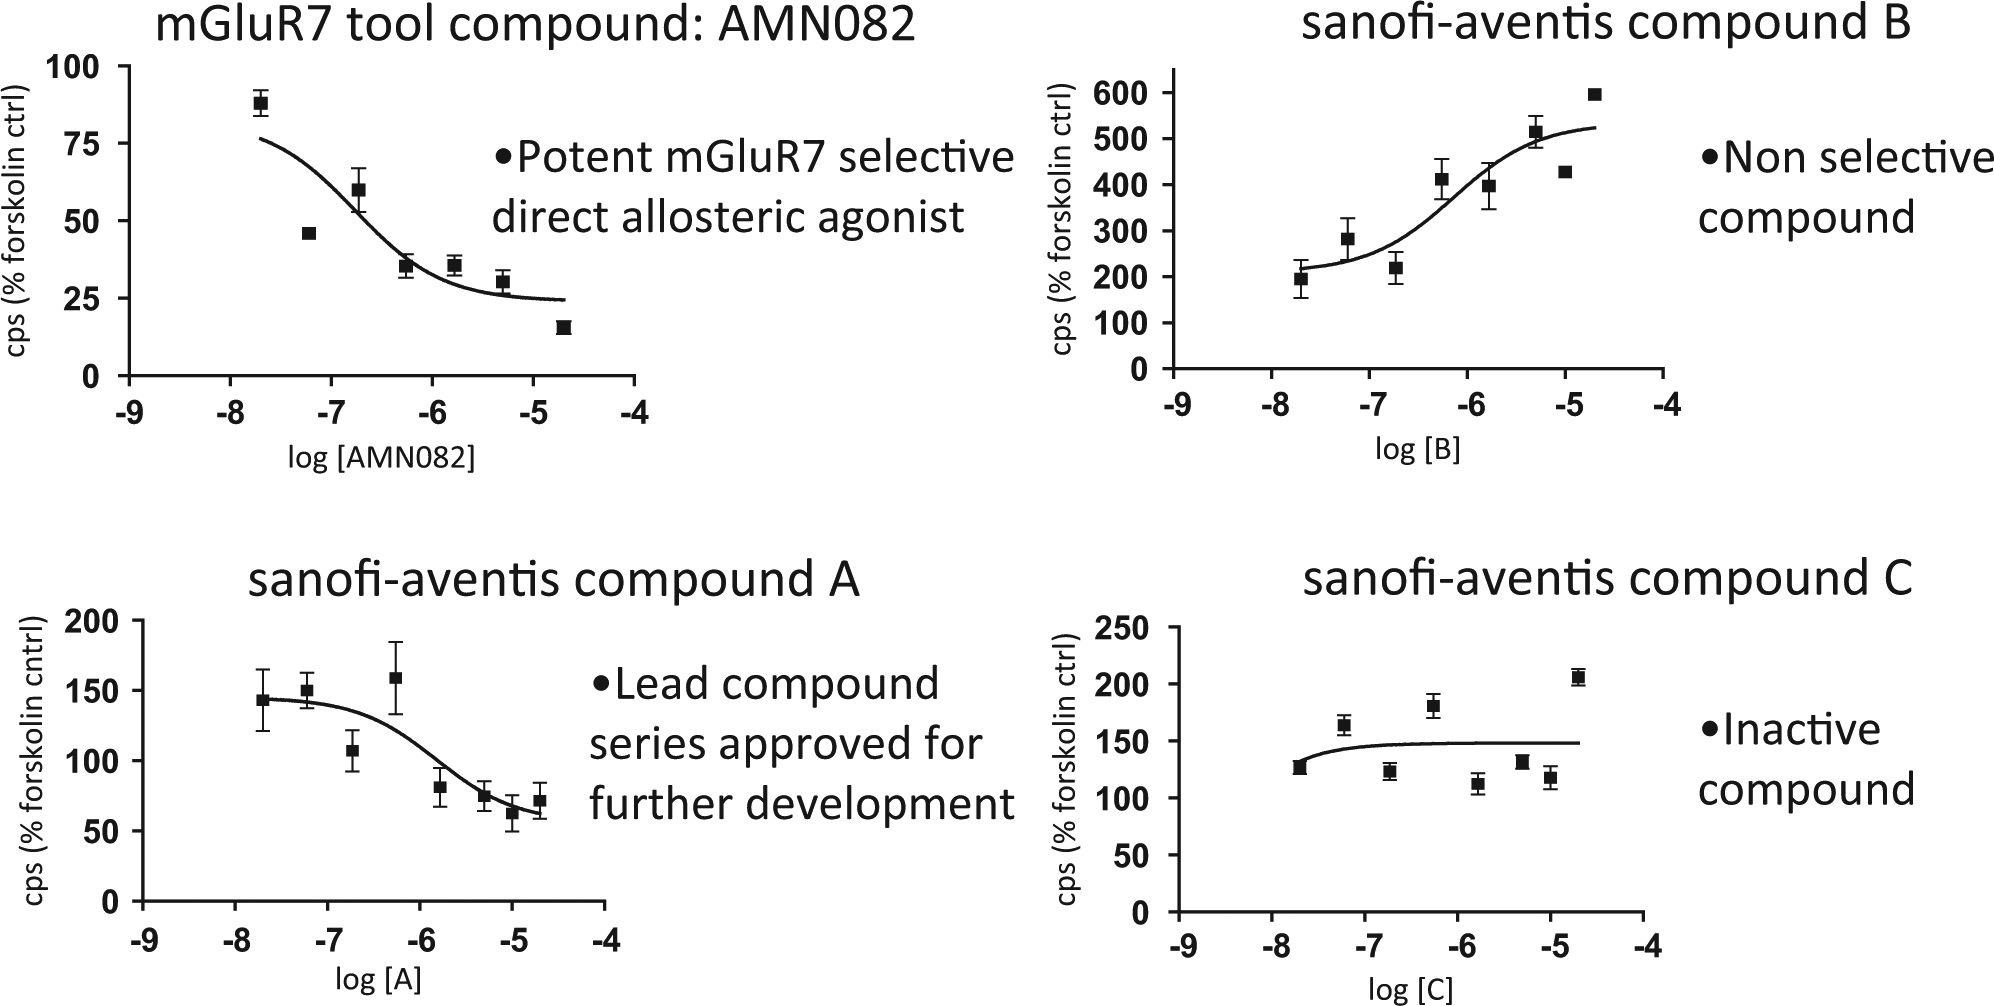
Gi allosteric agonist profiling of the mGluR7 reference compound, AMN082, and Sanofi-aventis project leads for mGluR7 in primary neuronal cells isolated from the CRE luc mouse line 187.
Response Profile of Multiple Lines with the CB1 Receptor
A concern with transgenic mice produced by random integration is that the phenotype from the transgene could be governed by the genomic local control elements. To address this question, more than one transgenic line should display a similar phenotype to conclude that the phenotype is due to the transgene’s independent action and not predominately governed by its genomic position.
The CB1 receptor’s activation was assayed with the Gi agonist CP55940 (10 µM) in four different CNS-expressing CRE luc lines (69, 175, 187, and 219). In primary cortical neurons treated with forskolin (5 µM) and rolipram (10 µM), the Gi agonist at 4 h produced a 37% to 50% decrease in the luciferase signal compared with the DMSO-only control ( Fig. 5 ). At 24 h after drug treatment, a larger magnitude of decrease from the Gi agonist activation of CB1 was assayed at a 50% to 80% decrease.
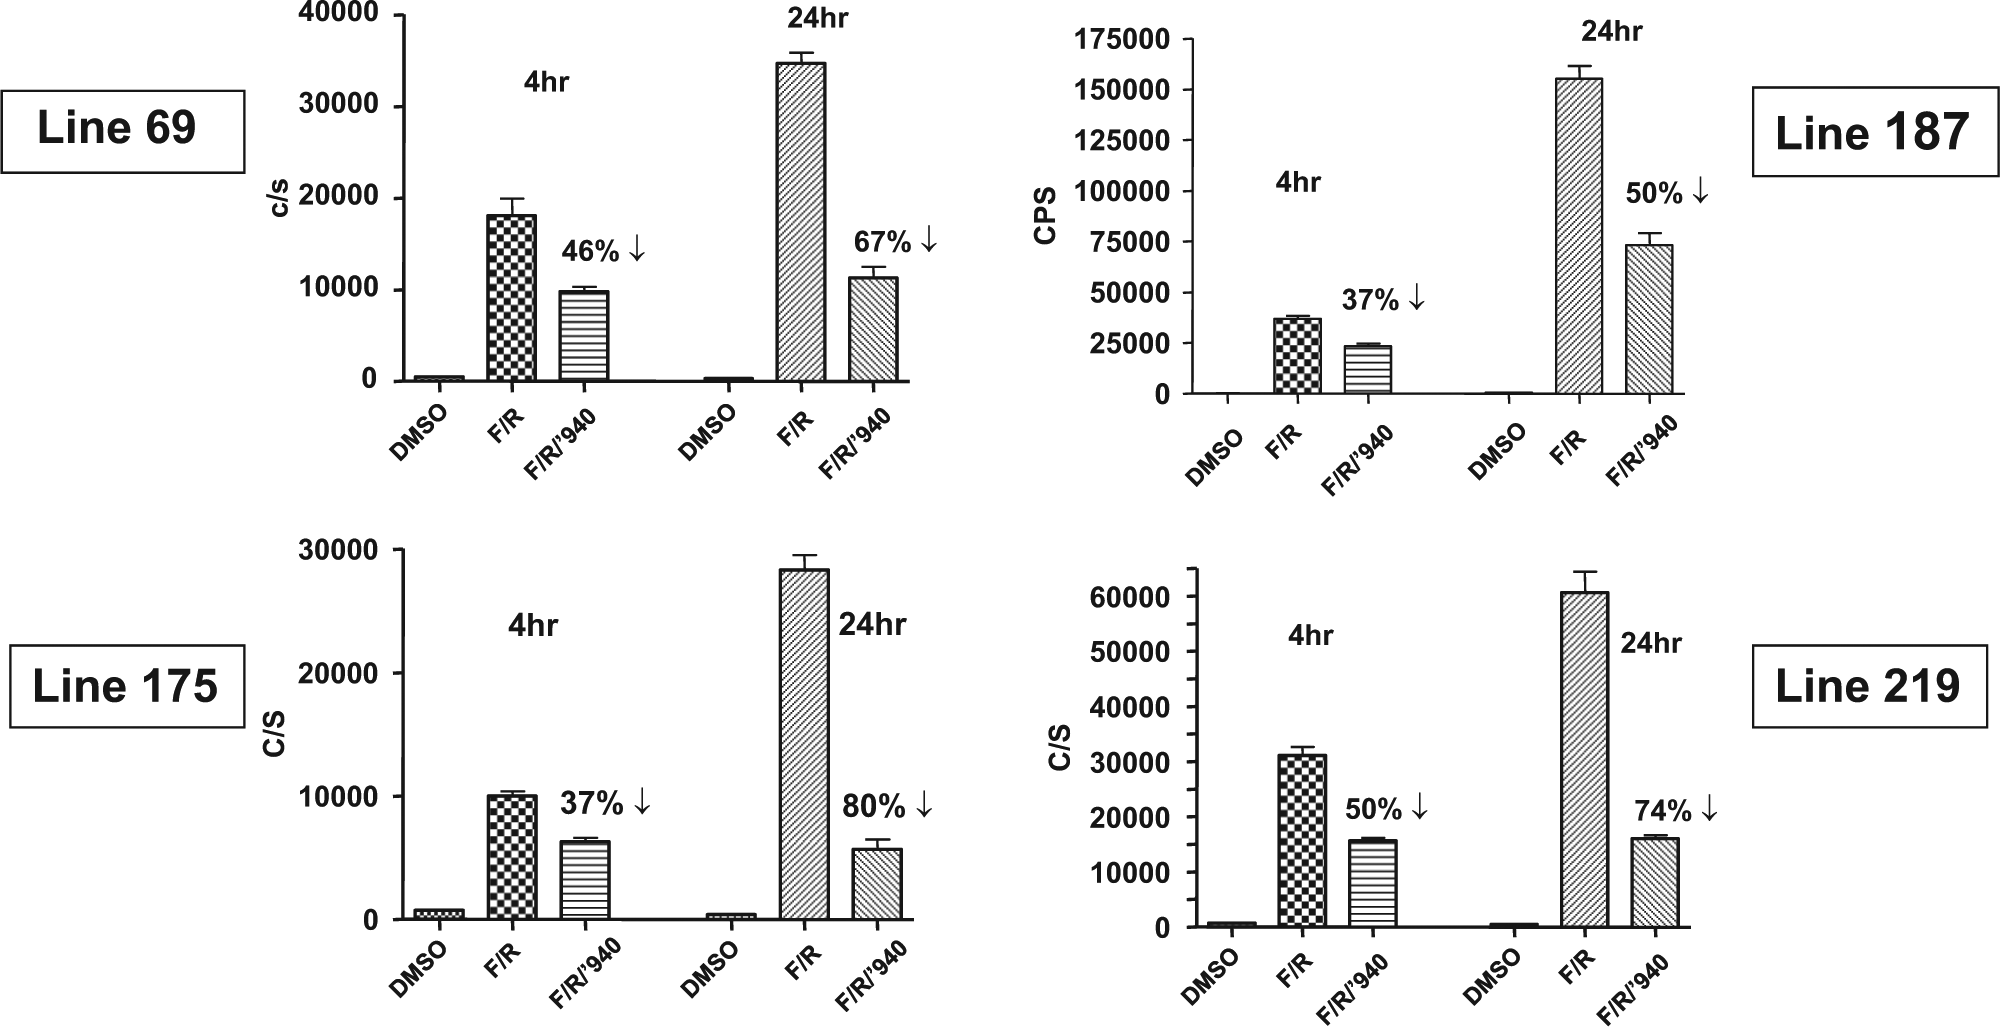
Gi modulation by the CB1 agonist CP55940 (10 µM) of luciferase expression in primary neurons from four different CRE luc transgenic lines. F/R, forskolin (5 µM) and rolipram (10 µM) treatment of E18 cortical neurons. Assayed at T = 4 and 24 h, all four lines displayed equivalent decreases in luciferase signal with the Gi agonist when compared with the DMSO-only control.
All four CRE luc lines displayed a similar order of magnitude decrease in the activation of CB1 by Gi agonist CP55940, which supported the conclusion that the fidelity of the CRE luc reporter was predominant at different genomic loci due to the multiple transgene elements that isolated it from the surrounding genomic control elements.
Additional CRE luc Model Applications
This report is an introduction of the CRE luc model, and the supplemental material lists the tissue-specific responses to forskolin induction and receptor ligand profiles that we have explored in the initial applications for the five lines available through Taconic (
Spinal cord bioimaging: Intrathecal injection of the EP2 ligand, EX00000173A (Sanofi), produced significant activation of the receptor in the spinal cord of line 187.
Hematopoietic cells: Line 64 has the CRE luc reporter predominately in hematopoietic cells and supported several immune cell assays. Transfer of bone marrow cells to NSG mice demonstrated a pattern of engraftment that was identical in each transfer and to the lineage’s pattern. This procedure also placed the CRE luc reporter in an isolated cell type to achieve a larger response window for subsequent compound studies. Microglia, T, and B cells were isolated, sorted, and cultured to support compound profiling assays that included BW245C, DP1, PGD2, and isoproterenol (Sigma).
Adipose: The adipose profile in several lines was assayed with the Adrb3 ligand CL316,243 (Sigma), and as with CB1 agonist, the similarity of the response profile across multiple lines indicates the fidelity of the CRE luc reporter in separate lineages.
Pancreas: The peptide agonist AVE0010 (lixisenatide; Sanofi) that binds the GLP1 receptor was profiled in several CRE luc lines and shown to have pancreatic-only expression, which was an important clinically relevant result.
Cardiomyocytes: Cardiomyocytes isolated from P3 pups had induction responses that supported profiles of PDE4 leads plus forskolin (10 µM), rolipram (5 µM), and isoproteronal (10 µM).
Combining CRE luc Mice with Other Mutant Strains or Disease Model Protocols
The CRE luc model can also be crossbred with natural mutant or genetically modified mice to enhance the data that can be generated from GPCR ligand interactions. As a validation effort, crossing the CRE luc mice with specific GPCR knockout (KO) mice could support receptor specificity studies to confirm ligand receptor interactions.
As an example, the CRE luc mouse line 11 (pancreatic and adipose peak expression) was crossed with the Ins2Akita model (Jackson Labs), which has an autosomal dominant mutation that causes early onset hyperglycemia in the absence of obesity. In this cross, CRE luc induction in the pancreas was decreased in highly diabetic male mice after induction with the GLP1 agonist lixisenatide (0.1 mpk, SC, 4 h). In another diabetes application, line 11 was treated with streptozotocin (200 mpk, IP; Sigma), and 4 days after treatment, the induction of the pancreatic luciferase signal was reduced.
The CRE luc mouse platform is a new tool to investigate the large family of GPCR receptors. It has been demonstrated to support analysis in several complementary formats that can be further enhanced by crossbreeding with other mutant mice or by conducting induced disease protocols.
Footnotes
Acknowledgements
The animal care, breeding, and husbandry of this transgenic model were made possible by the excellent and dedicated work of the Sanofi transgenic colony staff, which included Kay Long, John DeRea, James Holloway, and Patricia Marko.
All mice were housed under conditions listed in the National Institutes of Health Guide for Care and Use of Laboratory Animals in compliance with the USDA Laboratory Animal Welfare Act, in a fully accredited Association for Assessment and Accreditation of Laboratory Animal Care facility. All experimental work involving animals was performed in accordance with federal guidelines and protocols plus reviewed and approved by the Sanofi Institutional Animal Care and Use Committee.
Declaration of Conflicting Interests
The authors declared no potential conflicts of interest with respect to the research, authorship, and/or publication of this article.
Funding
The authors received no financial support for the research, authorship, and/or publication of this article.
References
Supplementary Material
Please find the following supplemental material available below.
For Open Access articles published under a Creative Commons License, all supplemental material carries the same license as the article it is associated with.
For non-Open Access articles published, all supplemental material carries a non-exclusive license, and permission requests for re-use of supplemental material or any part of supplemental material shall be sent directly to the copyright owner as specified in the copyright notice associated with the article.