
Abstract
The firefly luciferase gene is commonly used in cell-based reporter assays. Convenient luciferase assay reagents for use in high-throughput screening (HTS) are commercially available. However, the high cost of these reagents is not within the means of some academic laboratories. Therefore, we set out to develop an affordable luciferase assay reagent applicable in an HTS format using simple liquid-handling steps. The reagent was homemade from individual chemical components and optimized for luminescence intensity and stability. We determined the minimal concentrations of the most expensive components, dithiothreitol (DTT) and D-luciferin, resulting in a total assay reagent cost of less than 1 cent per sample. Signal stability was maximized by omission of coenzyme A and reduction of DTT concentration. The assay was validated in a high-throughput setting using two cancer cell lines carrying a p53-dependent luciferase reporter construct and siRNAs modulating p53 transcriptional activity. Induction of p53 activity by silencing PPM1D or SYVN1 and reduction of p53 activity by silencing p53 remained constant over a 2-h measurement period, with good assay quality (Z′ factors mostly above 0.5). Hence, the luciferase assay described herein can be used for affordable reporter readout in cell-based HTS.
Introduction
The firefly (Photinus pyralis) luciferase gene is among the most widely used reporter genes in biomedical research. It encodes the short-lived bioluminescent enzyme luciferase that catalyzes adenosine triphosphate (ATP)–dependent oxidative decarboxylation of its substrate D-luciferin to oxyluciferin with concomitant light emission. 1 Measurement of the emitted photons allows rapid and sensitive quantification of reporter gene expression over a large dynamic range. These characteristics have made firefly luciferase a very popular reporter gene in cell-based high-throughput screening (HTS). Improvements in reagent composition and rate of the catalyzed reaction, resulting in homogeneous reaction conditions in cell culture medium and prolonged light emission after assay reagent addition, have contributed to its routine use. Reagent kits for sensitive detection of luciferase activity in a homogeneous assay format with long-lasting luminescence are available from several vendors (e.g., Steady-Glo from Promega [Madison, WI], steadylight HTS from PerkinElmer [Waltham, MA], and Luc-Screen from Applied Biosystems [Foster City, CA]). However, commercially available luciferase assay reagents are expensive, which renders their use in HTS less attractive for academic laboratories. Our laboratory performs 21K whole-human genome siRNA library screens, mostly in 96-well microplate format. We calculated that at current prices, a single screen with luciferase activity as readout would cost approximately €12 000 on assay reagent only. We envisioned that a strong cost reduction could be achieved by developing an assay using a homemade assay reagent.
Several protocols for firefly luciferase assay reagents have been reported.2–6 Luciferase is released from the cells by mechanical or chemical methods, such as sonication, freeze-thaw cycling, or addition of a nonionic detergent. The essential components in the reaction mixture are the substrate D-luciferin and the co-substrates ATP and a divalent cation such as Mg2+, usually in a buffer containing a chelating agent and a reducing agent. Most reagents were designed for an effective flash luminescence reaction, with high photon emission lasting only a few seconds after reagent addition. Such assay kinetics is less desired in automated HTS applications, where samples are batchwise or continuously processed. The kinetics of the reaction can be manipulated to last for several minutes by altering the ATP concentration and by addition of salts. 7 In addition, coenzyme A (CoA) or inorganic pyrophosphate is sometimes added to boost luminescence by diminishing the inhibitory effect of dehydroluciferin, a reaction product occurring at high luciferase, D-luciferin, and ATP concentrations.3,6,8,9 Here, we determined appropriate luciferase assay conditions with luminescence kinetics suitable for HTS. The costs of the reagent were minimized by lowering the concentrations of its most expensive components. The performance of the assay was studied in an RNA interference (RNAi) HTS setting using simplified procedures.
Materials and Methods
Cells and culture
U2OS osteosarcoma cells and A549 lung adenocarcinoma cells carrying wild-type p53 were obtained from Dr. Lens (NKI, Amsterdam, The Netherlands) and the ATCC (American Type Culture Collection, Manassas, VA), respectively. Cells were cultured in Dulbecco’s modified Eagle’s medium (Lonza, Verviers, Belgium), supplemented with 10% fetal bovine serum (FBS; Greiner Bio-One, Alphen a/d Rijn, Netherlands) and antibiotics (100 U/mL penicillin and 100 µg/mL streptomycin; Lonza), at 37 °C, 5% CO2 in a humidified atmosphere. U2OS and A549 cells expressing the p53-dependent reporter plasmid PG13-Luc, 10 which carries the firefly luciferase gene driven by a promoter containing 13 p53-binding elements, were obtained after transfecting the cells with PG13-Luc and pTK-hyg (Clontech Laboratories, Mountain View, CA) using Lipofectamine PLUS (Life Technologies Invitrogen, Carlsbad, CA), according to the manufacturer’s protocol. After 48 h, 200 or 800 µg/mL hygromycin B (Roche Applied Science, Indianapolis, IN) was added to select for stably transfected U2OS and A549 cells, respectively. Single-cell clones were established after serial dilution of the transfected population.
Firefly luciferase assay reagent (FLAR)
In most experiments, except were indicated otherwise, FLAR composition was as follows: 20 mM tricine, 100 µM EDTA, 1.07 mM MgCO3, 2.67 mM MgSO4, 17 mM dithiothreitol (DTT), 250 µM ATP, and 250 µM D-luciferin, pH 7.8. The reagent was freshly prepared prior to each experiment from stock solutions of individual components made in MilliQ water, that is, 25 mM D-luciferin (Caliper Life Sciences, Teralfene, Belgium), 200 mM Tricine (Sigma, St. Louis, MO), 25 mM ATP (Sigma), 50 mM MgSO4 (Sigma), 10 mM MgCO3 (Sigma), 500 mM DTT (Sigma), 10 mM EDTA (Sigma), and 2.7 mM coenzyme A (Sigma). Tricine and MgCO3 stock solutions were adjusted to the desired pH. Stock solutions of D-luciferin, ATP, and DTT were kept at −20 °C; all other solutions were kept at room temperature (RT). Where applicable, cells were first washed and/or lysed in FLAR buffer (i.e., FLAR lacking D-luciferin and ATP), following which the reaction was initiated by adding FLAR with concentrated D-luciferin and ATP, to arrive at the desired final concentrations. For homogeneous assays, the reagent was supplemented with 0.4% v/v Tergitol NP40 (Sigma), 1% v/v Triton X-100 (BioRad), 1% v/v Tween-20 (Sigma), 0.1% v/v AntiFoam 204 (Sigma), and/or 0.6% v/v Prionex (Sigma) as indicated.
Firefly luciferase assay
U2OS/PG13-Luc cells were seeded 5000 cells per well in 85 µL culture medium in white 96-well plates with clear bottom (Greiner Bio-One) in triplicate per experimental condition. Luciferase activity was measured 1 day after cell seeding. To this end, cells were lysed as indicated for each experiment, either by freezing at −80 °C in dry plates or in wells containing FLAR buffer and/or culture medium with or without detergent or by adding FLAR buffer with detergent to the culture medium at RT. Prior to lysis in dry plates, medium was removed either by aspiration or by shaking off most of the medium followed by spinning the plates upside down for 1 min at 50 g in a Hettich Rotanta 460R centrifuge (Hettich, Tuttlingen, Germany). Frozen plates were allowed to warm up to RT before starting the reaction. Reactions were started by adding FLAR and mixing reagents by shaking plates for 2 s. Luminescence was measured in a Tecan Infinite F200 microplate reader (Tecan Benelux, Giessen, Netherlands) at 1-min interval for 130 min. For homogeneous assays, plates were shaken for 60 s in the microplate reader, using the orbital shake function with an amplitude of 1 mm, prior to starting measurements.
siRNA transfection
For RNAi experiments, 2000 U2OS/PG13-Luc cells or 750 A549/PG13-Luc cells per well were seeded in triplicate in 85 µL culture medium in white 96-well plates with clear bottom (Greiner Bio-One). Cells were transfected the next day with SMARTpool siRNA duplexes from Thermo Fisher Scientific Dharmacon (Lafayette, CO) according to the manufacturer’s protocol, using 35 nM or 25 nM siRNA for U2OS/PG13-Luc and A549/PG13-Luc cells, respectively, and 2500 times diluted Dharmafect 1 (Dharmacon) in a final volume of 105 µL. The SMARTpool siRNA reagents used were nontargeting siCONTROL-1 (NT#1; cat. no. D-001210-01) and siRNAs directed against TP53 (cat. no. M-003329-01), PPM1D (cat. no. M-004554-00), SYVN1 (cat. no. M-007090-01), and PLK1 (cat. no. M-003290-01). Details of genome-wide screening on A549/PG13-Luc cells can be found in the supplementary materials. Plates were prepared for luciferase assay 3 days after transfection.
Results and Discussion
Luciferase Assay Reagent Composition
We first set out to determine useful luciferase reagent compositions. The effect of pH and concentrations of individual components on luminescence intensity and stability was studied. All experiments were done using U2OS/PG13-Luc cells, which were derived from p53 wild-type U2OS osteosarcoma cells by stable transfection of a p53-dependent firefly luciferase reporter construct. The firefly luciferase assay reagents tested were based on a 20-mM tricine buffer containing 100 µM EDTA, with Mg2+ provided by adding 1.07 mM MgCO3 and 2.67 mM MgSO4. Pilot experiments had revealed that EDTA concentrations in the range of 50 to 200 µM, MgCO3 concentrations between 0.5 and 2.1 mM, and MgSO4 concentrations between 1.3 and 5.3 mM did not notably affect luminescence kinetics (not shown). The pH of tricine and MgCO3 was set in the range of 6.8 to 8.8, and D-luciferin, ATP, and DTT were added in various concentrations to determine the minimal amounts required for high and, in view of HTS application, stable luminescence in particular. Cells were seeded in white 96-well microplates and cultured overnight. The next day, the culture medium was removed and cells were lysed by a single freeze-thaw cycle. Subsequently, test assay reagent was added and luminescence was read repeatedly at 1-min intervals over a period of more than 2 h. As can be seen in Figure 1A , the signal intensity was pH dependent, with higher pH yielding higher luminescence shortly after reagent addition. At pH above 8.0, however, increased light intensity decay was observed. Optimal luminescence intensity and stability were achieved at a pH around 7.8. At this pH, light emission changed less than 1% per minute. Figure 1B shows that luminescence was also DTT dose dependent, with higher concentrations yielding higher luminescence. However, at high DTT concentrations, light emission declined more rapidly, exceeding 1% per minute at 67 mM. Since this is unwanted in an HTS setting, the recommended DTT concentration was limited to 20 mM, yielding very stable luminescence over the entire reading period. Figure 1C shows that within a concentration range of 31 to 500 µM, the D-luciferin substrate was saturating. At these concentrations, light emission decayed less than 0.5% per minute. The concentration of this expensive component of the reaction mixture could be reduced substantially without any loss of luminescence. In subsequent experiments, we decided to use D-luciferin at 100 µM concentration. Luminescence was also clearly ATP dose dependent, with very similar stable kinetics at ATP concentrations between 16 and 125 µM ( Fig. 1D ). At lower and higher concentrations, a slight increase in light intensity decline was observed. A reporter assay using 125 µM ATP therefore balances maximal overall signal intensity to minimal signal intensity decline.
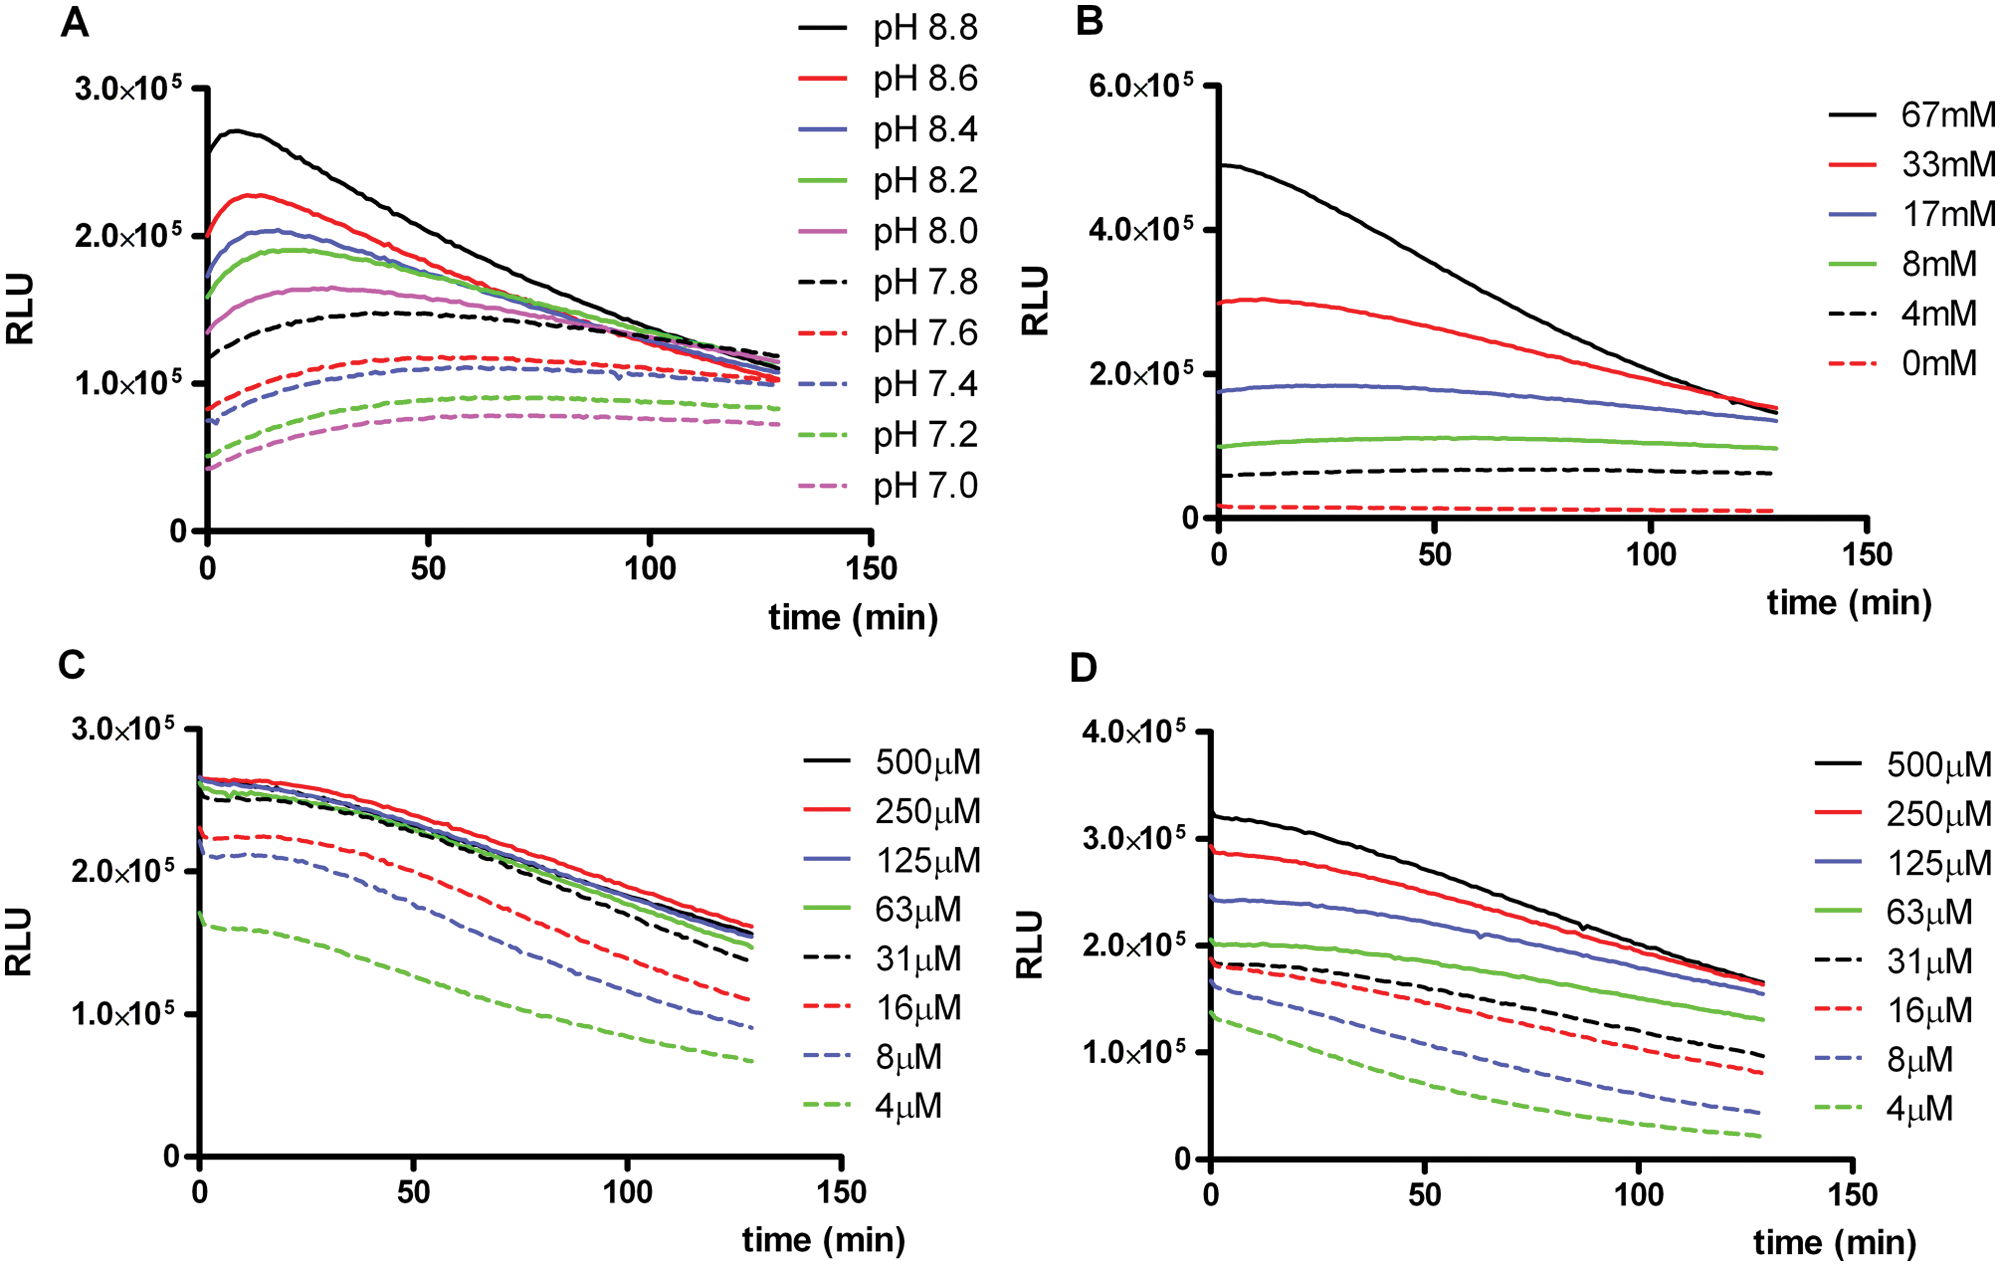
Firefly luciferase assay reagent composition. Influence of (
Next, we investigated the effect of adding coenzyme A to the assay reagent. Figure 2A shows that CoA boosted flash luminescence. Immediately after addition of the assay reagent, 4- to 5-fold higher photon emission was recorded. However, CoA strongly reduced the stability of light emission. Although the decline in luminescence was less than 1% per minute over the entire observation period in the absence of CoA, CoA addition increased the light decay rate to more than 5% per minute immediately after starting the reaction and remaining at 2% to 3% per minute from 15 min onwards ( Fig. 2B ). Consequently, after approximately 1 h, the absolute luminescence was considerably lower in the presence of CoA. We thus concluded that for HTS purposes, CoA was best omitted from the assay reagent.
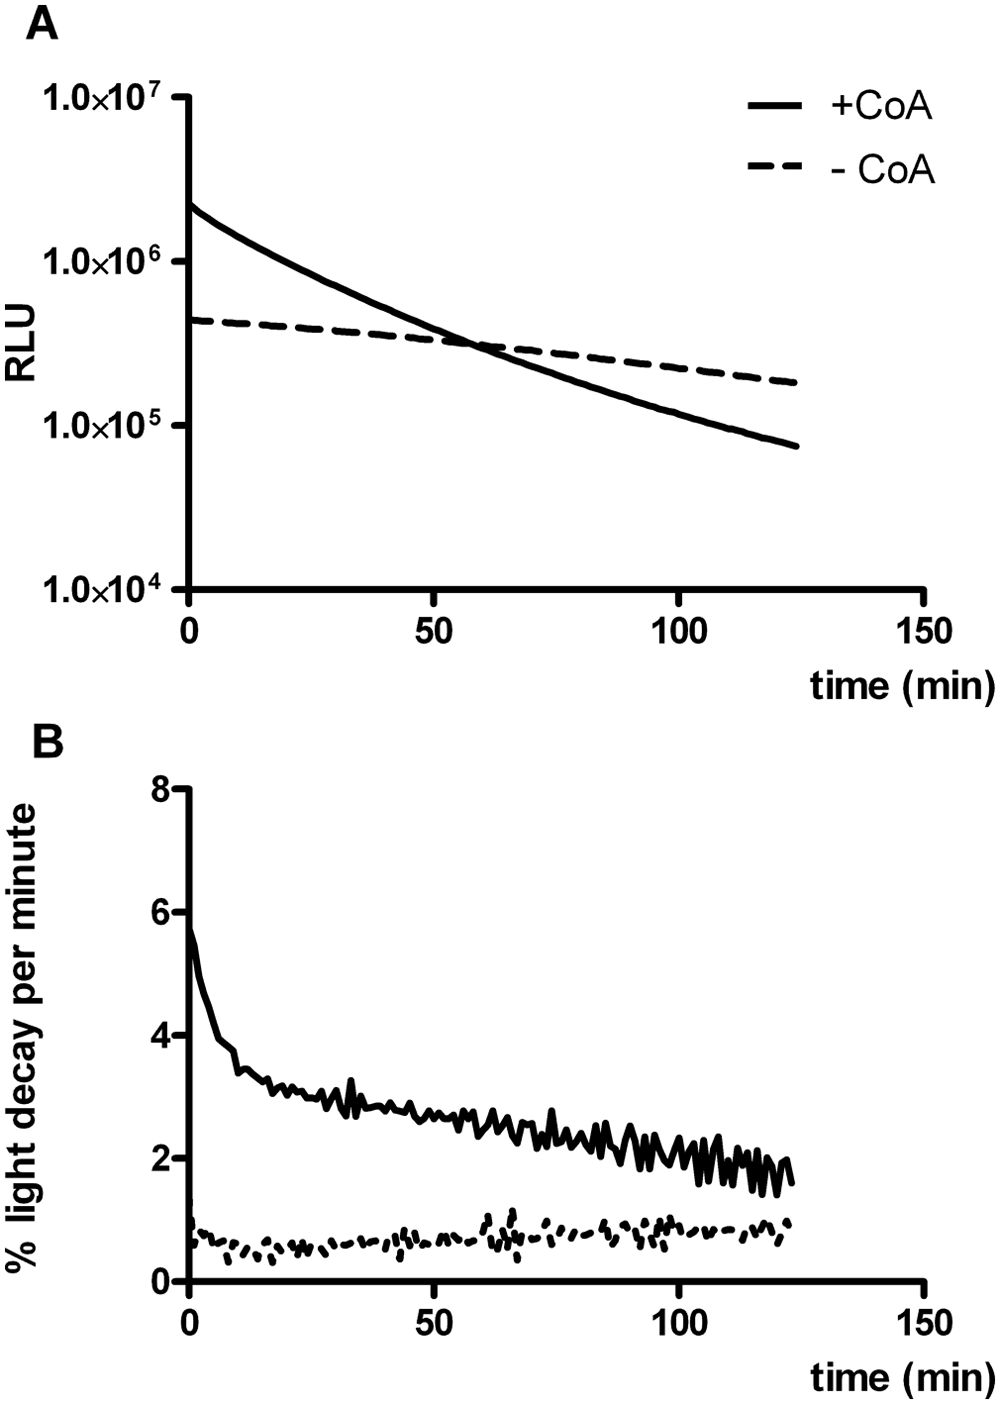
Influence of coenzyme A on light emission (
To conclude reagent optimization, the final formulation was tested on a series of samples containing different numbers of cells seeded per well. Figure 3A shows that luminescence was very stable and increased with cell number and thus luciferase activity, up to at least 8000 U2OS/PG13-Luc cells. In samples with the highest luciferase activity (i.e., 32 000 cells per well), light emission decreased after approximately 1 hr. This suggested that at least one of the components in the assay reagent was limiting. Indeed, when we quadrupled the concentrations of DTT, ATP, and D-luciferin, light emission was stable also at the highest luciferase activity tested ( Fig. 3B ). The U2OS/PG13-Luc cell line expresses high levels of luciferase, resulting in high photon yields. Still, the standard FLAR was suitable for reliable analysis of cell numbers usually grown in a 96-well microplate format. Hence, the reagent is expected to be useful for most firefly luciferase reporter cell lines. In exceptional cases where cell lines with very high luciferase activity or very high cell numbers are analyzed, however, the linear range of the assay can be extended by increasing reagent concentrations. In this case, it is recommended to increase the concentration of ATP and/or D-luciferin rather than DTT, since high DTT concentrations were found to reduce the luminescence half-life (see above). Furthermore, increasing DTT concentration has considerable impact on the reagent cost, as DTT at the recommended concentration already accounts for 80% of the price of FLAR.
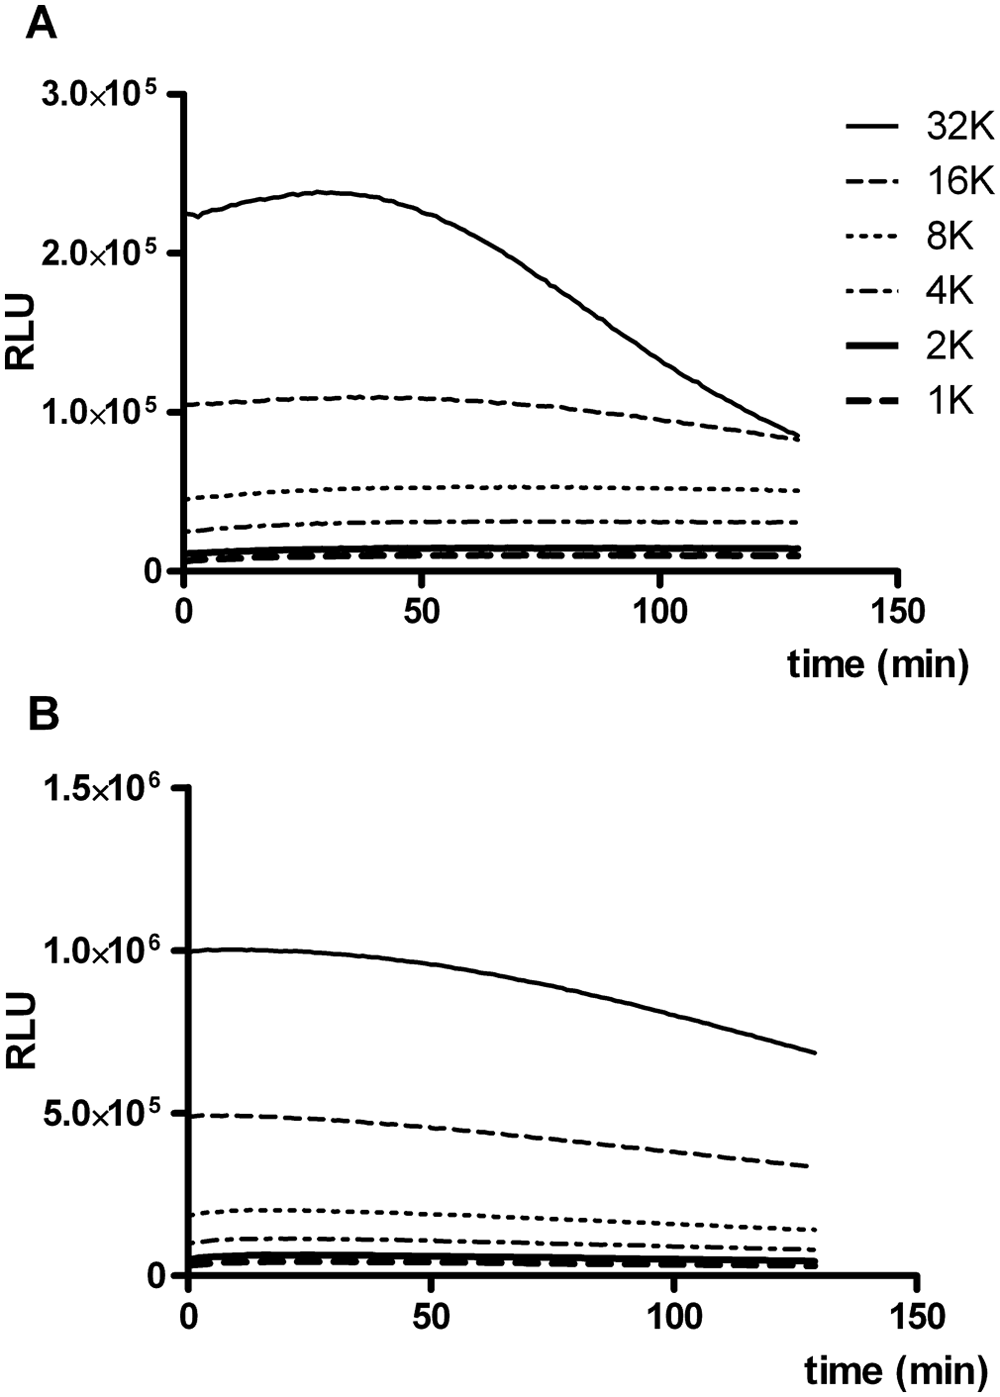
Effect of luciferase activity on luminescence. Luminescence was measured in samples containing different numbers of U2OS/PG13-Luc cells (range, 1000–32 000) after adding firefly luciferase assay reagent (FLAR) with dithiothreitol (DTT), D-luciferin, and adenosine triphosphate (ATP) concentrations of (
Homogeneous Assay Conditions
A most practical HTS luciferase assay includes minimal manipulations, to limit introduction of technical variation. Therefore, it is preferred to lyse cells and measure luciferase activity without removal of the culture medium. We investigated if such a homogeneous assay could be performed with our homemade reagent by adding 2 times concentrated FLAR to U2OS/PG13-Luc cell cultures. To induce cell lysis, we supplemented the reagent with one of three different detergents (i.e., Triton X-100, Tergitol NP40, or Tween-20). As can be seen in Figure 4 , in the absence of detergent, luminescence could be measured shortly after initiation of the reaction, but the signal rapidly declined. Apparently, passive lysis occurred and medium contains a component that destabilizes the reaction. Adding Tergitol NP40 had no appreciable effect on the luminescence kinetics. In contrast, Tween-20 caused a very slow cell lysis, resulting in much delayed light emission. Excellent results were obtained with Triton X-100, which yielded the highest and long-term stable light emission. This suggested that the presumed destabilizing component in culture medium was inhibited by this detergent. Maximal light emission was, however, only reached after approximately 30 min. This was due to delayed lysis, as enforcing lysis through a single freeze-thaw step resulted in immediate maximal light emission. An almost identical light emission profile was observed when cells were subjected to freeze-thaw lysis in the absence of a detergent. This suggested that lysis by mechanical cell disruption was near complete. In two independent experiments, maximal luminescence was 19% and 29% higher upon lysis with Triton X-100 than upon freeze-thaw lysis. Thus, apparently the activity of firefly luciferase was better preserved by lysis using Triton X-100. In conclusion, the homogeneous assay should include either an at least 30-min incubation step with Triton X-100 at RT or a mechanical cell disruption step before luminescence measurement commences.
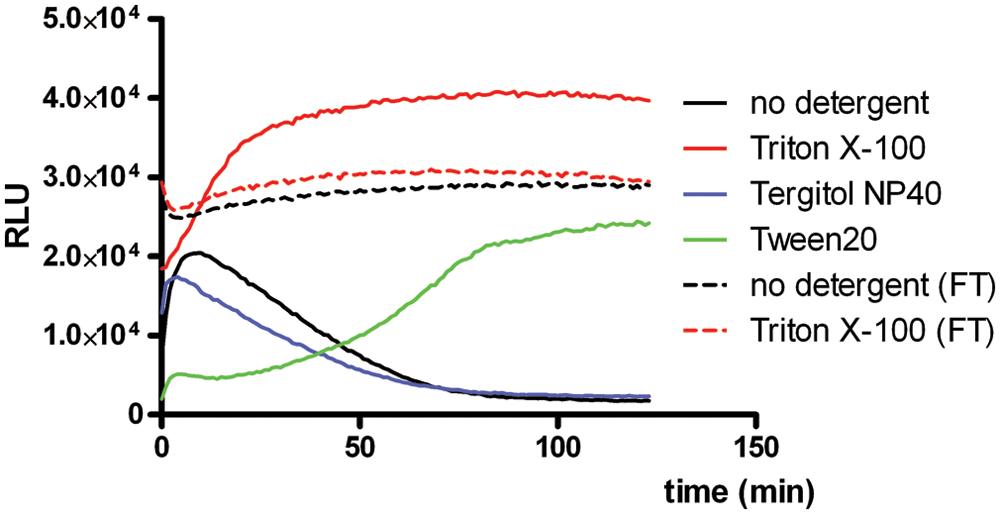
Application of firefly luciferase assay reagent (FLAR) in a homogeneous firefly luciferase assay. Luminescence was measured at a 1-min interval until 130 min after initiation of the reaction by adding 2 times concentrated FLAR containing Prionex and AntiFoam 204 with or without the indicated detergents to U2OS/PG13-Luc cell cultures. Where indicated, cell lysis was promoted by a single freeze-thaw (FT) step at −80 °C. The graph shows a typical example of two independent experiments done in triplicate. RLU, relative light units.
Upon mixing FLAR into the culture medium by shaking the microplate, the detergent in the solution could perhaps cause foam formation, which might affect the luminescence readings. Therefore, we added the foam-preventing reagent AntiFoam 204 and the protein stabilizer Prionex to the reagent. In four independent experiments (not shown), however, we found that the effects of omission of these reagents on luminescence were minimal (less than 10% signal decrease). Hence, FLAR can be used in a convenient homogeneous luciferase assay with Triton X-100, optionally supplemented with Prionex and AntiFoam 204. However, although luminescence in the homogeneous assay was extremely stable, it was 3- to 5-fold lower than could be obtained when the culture medium was removed (not shown). Thus, for assays with a low signal-to-background ratio, this method might be less suitable.
Assays with Removal of Culture Medium
Since we observed that culture medium reduced luminescence, we attempted to maximize luminescence readings by reducing the concentration of culture medium in the assay. In an HTS setting, this could be done by using a microplate washer, for example. To prevent dislodging of cells from the plate surface, washing procedures usually consist of multiple 50% medium-for-buffer exchange steps. To determine how many wash steps would be required for high luminescence, we replaced the culture medium of U2OS/PG13-Luc cells with 1:1, 1:3, and 1:7 medium/FLAR buffer mixtures, representing one, two, or three 50% wash steps with FLAR buffer, respectively. Cells in complete medium or FLAR buffer were included as controls. Luminescence was measured after a single freeze-thaw cycle by adding FLAR with concentrated D-luciferin and ATP. As can be seen in Figure 5A , three wash cycles were sufficient to completely restore luminescence to control readings obtained in the absence of culture medium.
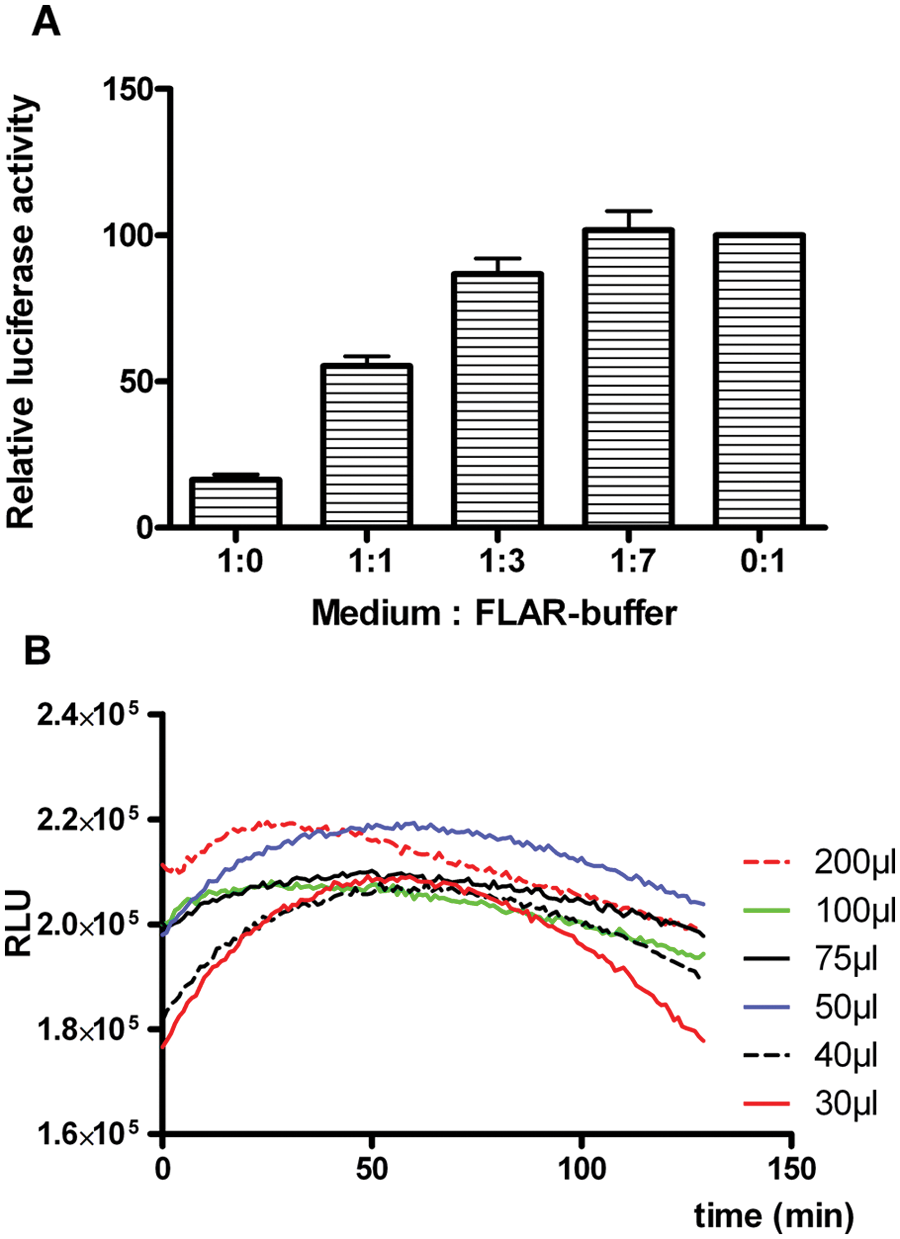
Effect of cell culture medium and reagent volume on luminescence. (
Next, we compared different ways of performing the freeze-thaw lysis step. Cells were frozen at −80 °C either in FLAR buffer or after complete removal of the buffer. After thawing the plates to room temperature, FLAR with D-luciferin and ATP was added and luminescence measured.
Cell washers generally cannot reproducibly remove all fluid from microplates without affecting the cell layer, and aspirating the medium from individual wells manually is not suitable in an HTS setting. Therefore, we tested if complete medium removal could be performed by spinning down plates upside down at low speed in a standard laboratory centrifuge. We compared this procedure with cautiously aspirating the medium manually. The two procedures yielded almost identical results (
Finally, we determined the optimal FLAR volume in 96-well culture plates for HTS. Figure 5B shows that luminescence was more stable at higher volume. Two independent experiments at 30 µL volume showed a 16% and 22% difference between the highest and lowest values measured over time, respectively; at higher reaction volumes, this difference was considerably lower (below 10% for 200-µL reactions). Furthermore, in the range of 50 to 200 µL, firefly luciferase activity measurements differed by 10% or less in both experiments. Thus, at reagent volumes of at least 50 µL, some inaccuracy in reagent aspiration or dispensing in the HTS procedure has little effect on the assay result.
In the aggregate, our findings show that a convenient HTS firefly luciferase assay yielding high and stable luminescence readings could consist of (1) either complete medium removal by spinning the culture plates upside down in a centrifuge or performing at least three 50% washes with FLAR buffer; (2) a single freeze-thaw lysis step, allowing optional long-term storage until luciferase activity measurement is done; (3) addition of FLAR to preferably at least 50 µL final volume; and (4) reading luminescence within the first 2 h after FLAR addition.
Comparison of FLAR to Commonly Used Commercially Available Reagents
We compared the performance of the assay described here with that of two commercially available products, designed for extremely sensitive and rapid analysis, and sensitive high-throughput analysis, respectively (
Assay Validation in an HTS Setting
To validate the assay in an RNAi screening setting, we modulated p53 activity in U2OS/PG13-Luc cells by transfecting siRNA against p53 itself or against the serine/threonine phosphatase PPM1D and measuring luminescence 3 days later. Silencing p53 is expected to lower luminescence, whereas silencing PPM1D, known to inhibit p53 activity by dephosphorylating p53 and by promoting its degradation through MDM2 dephosphorylation,11,12 is expected to increase luminescence. Recently, we performed a mini-screen with siRNAs against several putative p53 inhibitors and found that among these, siRNA against PPM1D increased p53 activity in U2OS cells most prominently. 13 U2OS/PG13-Luc cells were seeded in three 96-well plates and transfected with control, p53, and PPM1D siRNAs distributed over different plate columns (total 88 wells per condition). Three days later, cells were lysed by freeze-thaw in dry plates, and plates were processed and cycled for luminescence reading for over 2 h. Figure 6A shows that upregulation as well as downregulation of p53 activity could be clearly detected at all time points. On average, p53 silencing decreased luminescence by more than 90%, whereas PPM1D silencing increased luminescence by more than 2-fold. Decrease in light emission over time was considerable (more than 2%) immediately after initiation of the reaction but rapidly declined within a few minutes to remain below 0.8% per minute for the duration of the experiment ( Fig. 6B ). This resulted in a luminescence half-life well over 100 min. We then determined quality metrics of the assay by calculating the Z′ factor, a measure for the magnitude of difference between two experimental groups capturing the variability in both populations. 14 As can be seen in Figure 6C , the Z′ factor for siTP53 compared with nontargeting control siNT#1 (inhibited p53 activity vs. background conditions) was stable at 0.56 over the entire analysis period. For siPPM1D compared with siNT#1 (enhanced p53 activity vs. background), the Z′ slightly increased over time, starting above 0 and nearing 0.2 after 2 h. An increasing Z′ factor, due to decreasing variability in the luminescence signals, was observed in several but not all experiments performed on two different reporter cell lines (not shown). A decrease in assay performance over time was never observed. Hence, although signal intensities declined over time, this was regularly accompanied with improved assay performance at longer incubation times. We could thus conclude that the effects of p53 silencing and PPM1D silencing on luciferase reporter expression in U2OS/PG13-Luc cells could be measured over a 2-h period with excellent and acceptable assay metrics, respectively, thus validating the assay for RNAi HTS.
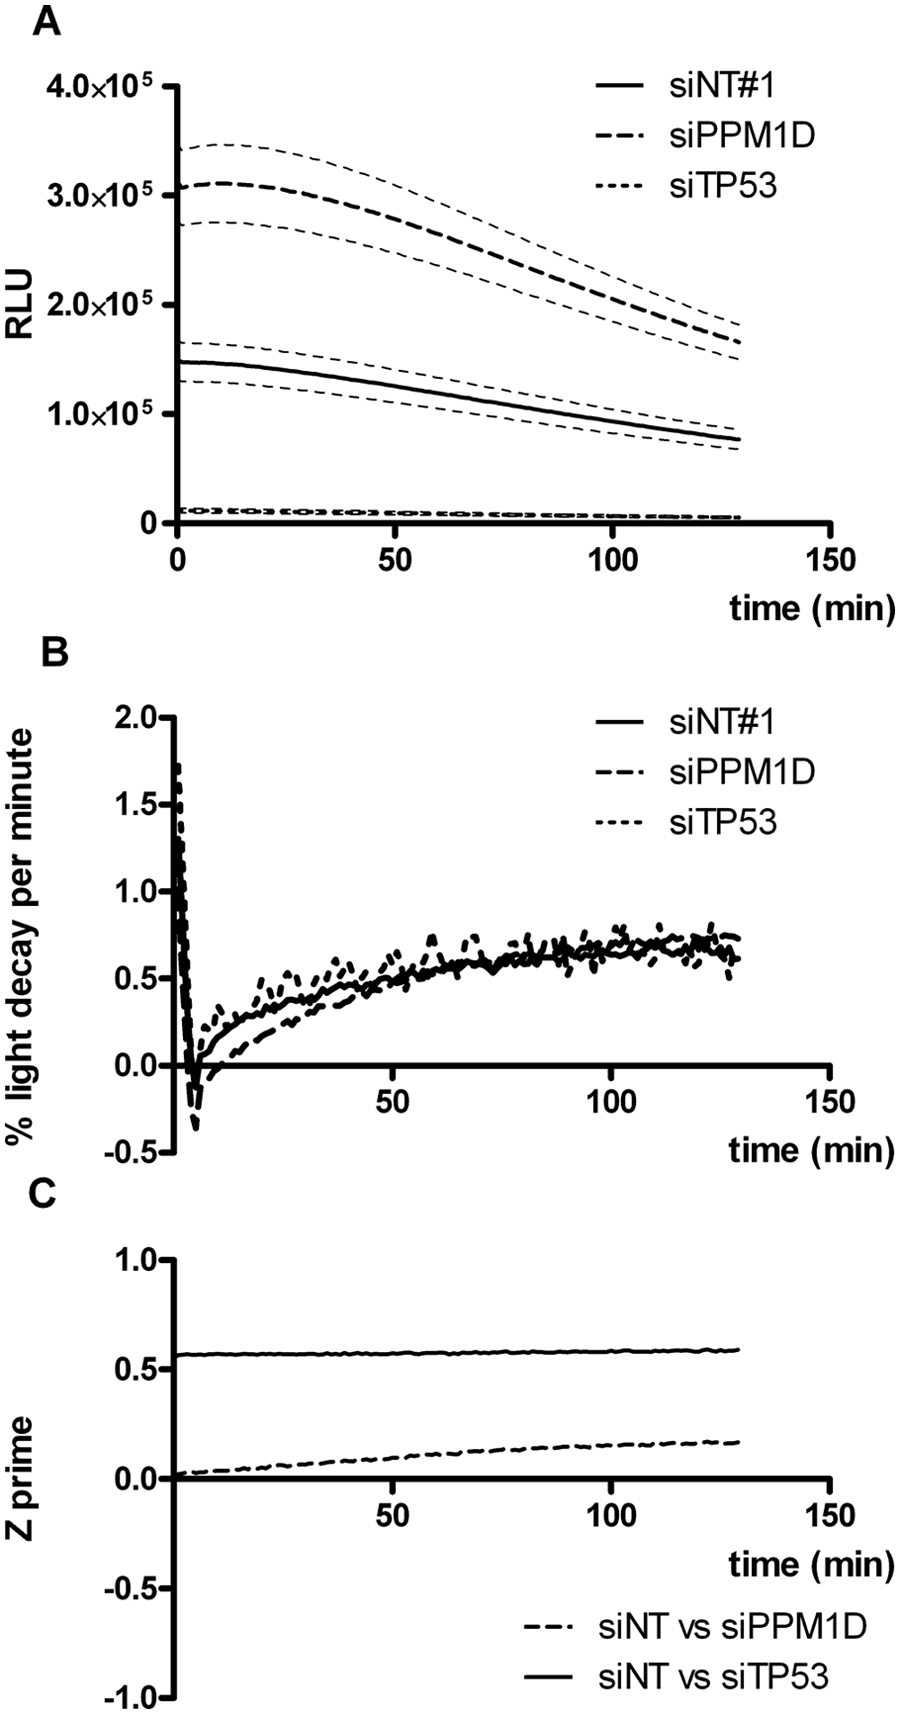
Assay metrics of the firefly luciferase assay in an RNAi high-throughout screening setting. U2OS/PG13-Luc cells seeded in three 96-well cell culture plates were transfected with control (siNT#1), p53, and PPM1D siRNAs (total 88 wells per condition). Three days later, plates were processed and cycled for luminescence reading every minute for over 2 h after firefly luciferase assay reagent (FLAR) addition. (
Finally, we implemented the assay in our screening facility. To date, we performed three arrayed whole human genome siRNA library (21 121 unique gene targets) screening campaigns to identify modulators of p53 activity in A549 lung adenocarcinoma cells carrying the PG13-Luc reporter construct, using the method described herein. To allow assay quality assessment, nontargeting control siRNAs and siRNAs silencing p53 and synoviolin (SYVN1), an endoplasmic reticulum-resident ubiquitin ligase that we recently identified as a functional inhibitor of p53 activity in A549 cells,
13
were taken along in duplicate on each of 270 assay plates. A549/PG13-Luc cells have considerably lower (~50-fold) luciferase activity than U2OS/PG13-Luc cells. Nevertheless, modulation of p53 activity could be detected (
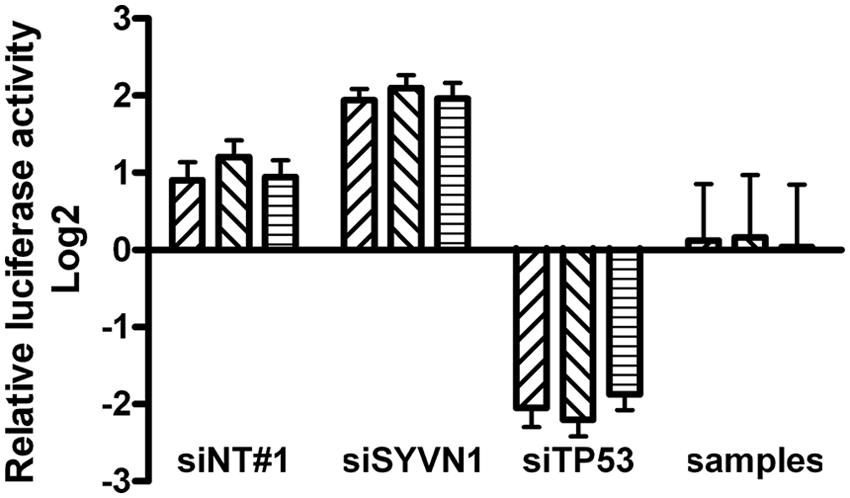
Validation of the firefly luciferase assay in whole human genome RNAi high-throughput screening on A549/PG13-Luc cells. Mean normalized 2Log-transformed values with standard deviation of cells transfected with siNT#1, siTP53, or siSYVN1 control siRNAs (540 controls of each type distributed over 270 assay plates per screen) and all 21 121 siGENOME library siRNAs were calculated for each of three screens. Individual values for the controls are shown in
In conclusion, we developed an inexpensive firefly luciferase reagent and demonstrated its use in reporter cell-based HTS using simple procedures. This could aid in bringing such screens within the means of most research laboratories.
Footnotes
Acknowledgements
We thank Ida H. van der Meulen for technical assistance while conducting the genome wide siRNA screens.
Declaration of Conflicting Interests
The authors declared no potential conflicts of interest with respect to the research, authorship, and/or publication of this article.
Funding
The authors disclosed receipt of the following financial support for the research, authorship, and/or publication of this article: This research was supported by the Walter Bruckerhoff Stiftung. High-throughput screens were conducted at the RNA Interference Functional Oncogenomics Laboratory (RIFOL) core facility at the VUmc Cancer Center Amsterdam, which was established with support from the Stichting VUmc CCA.
References
Supplementary Material
Please find the following supplemental material available below.
For Open Access articles published under a Creative Commons License, all supplemental material carries the same license as the article it is associated with.
For non-Open Access articles published, all supplemental material carries a non-exclusive license, and permission requests for re-use of supplemental material or any part of supplemental material shall be sent directly to the copyright owner as specified in the copyright notice associated with the article.