
Abstract
Bioluminescent and fluorescent reporters are finding increased use in optical molecular imaging in small animals. In the work presented here, issues related to the sensitivity of in vivo detection are examined for standard reporters. A high-sensitivity imaging system that can detect steady-state emission from both bioluminescent and fluorescent reporters is described. The instrument is absolutely calibrated so that animal images can be analyzed in physical units of radiance allowing more quantitative comparisons to be performed. Background emission from mouse tissue, called autoluminescence and autofluorescence, is measured and found to be an important limitation to detection sensitivity of reporters. Measurements of dual-labeled (bioluminescent/fluorescent) reporter systems, including PC-3M-luc/DsRed2-1 and HeLa-luc/PKH26, are shown. The results indicate that although fluorescent signals are generally brighter than bioluminescent signals, the very low autoluminescent levels usually results in superior signal to background ratios for bioluminescent imaging, particularly compared with fluorescent imaging in the green to red part of the spectrum. Fluorescence detection sensitivity improves in the far-red to near-infrared, provided the animals are fed a low-chlorophyll diet to reduce autofluorescence in the intestinal region. The use of blue-shifted excitation filters is explored as a method to subtract out tissue autofluorescence and improve the sensitivity of fluorescent imaging.
Introduction
The use of optical probes for tracking and reporting functional information on molecules, proteins, and cells in vivo is a new and rapidly expanding technology known as optical molecular imaging. This technology has a large range of applications, including study of infectious disease, oncology, pharmacokinetics and pharmacodynamics, toxicology, and gene expression in light-producing transgenic animals [1–12]. The useful wavelength range for optical probes is generally considered to be between 400 and 950 nm. For in vivo measurements, it is well known that the absorption of light through tissue is higher from 400 to 600 nm and lower from 600 to 950 nm [13]. Wavelengths greater than 600 nm are thus preferred for deep tissue (> 1 cm) investigations, although shorter wavelength probes are still useful for smaller depths. Optical imaging is particularly well suited for small animal models since the tissue depths are relatively small; however, human applications are also being explored [14].
We consider two classes of optical reporters, bioluminescent and fluorescent. Bioluminescent reporters include genetically expressed luciferase proteins such as bacteria, firefly, red and green click beetle (Promega, Madison, WI), and Renilla. Light emission is the result of a chemical reaction involving luciferase, luciferin, oxygen, and ATP. No excitation light is required. With the exception of bacterial luciferase, the other luciferases require the injection of luciferin in order to initiate the light-producing reaction (bacteria produce their own substrate). Firefly and red click beetle luciferases are generally preferred due to their longer wavelength emission.
Fluorescent reporters do not require luciferin, but instead require excitation light to excite the fluorophore to a higher energy state, followed by emission at a longer wavelength. Fluorescent reporters include genetically encoded proteins such as green fluorescent protein (GFP) (Amersham Biosciences, Piscataway, NJ), DsRed, and other color variants (BD Biosciences Clontech Laboratories, Palo Alto, CA). These proteins are limited to the visible part of the spectrum from 400 to 650 nm. A large number of fluorescent dyes have been developed for flow cytometry and microscopy applications and several have found use in vivo for tracking the distribution of drugs, molecules, or antibodies. Some common dyes include fluorescein (Molecular Probes, Eugene, OR), Cell Tracker™ (Molecular Probes), Alexa Fluor® (Molecular Probes), PKH26 (Sigma-Aldrich, St. Louis, MO), and the cyanine family (Molecular Probes) with emission wavelengths ranging from 500 to 850 nm. New nanoparticle probes such as quantum dots are also beginning to find biological applications [15–17].
Aside from signal level, which will be discussed later, there are several tradeoffs between genetically encoded bioluminescent and fluorescent proteins. Bioluminescent reporters require the injection of luciferin substrates (except bacterial) while fluorescent proteins do not. Luciferase is a more responsive probe to rapidly changing environmental conditions such as infectious disease because these proteins mature rapidly following expression and are relatively short lived, whereas fluorescent proteins can take up to several hours to become functional after which they may reside in the cell for many hours [18,19]. Both bioluminescent and fluorescent proteins are, at this time, limited to wavelengths in the blue to red portion of the spectrum (400–700 nm).
Fluorescent dyes are far more numerous and have a much broader range of wavelengths, including the near-infrared (NIR) range of 700–900 nm where tissue autofluorescence is lower [20]. However, obtaining target specificity and contrast is more challenging. Staining a cell, molecule, or antibody with fluorescence and then injecting into the animal is the most straightforward application of fluorescent dyes for short-term studies. For applications such as tumor visualization, target-activated probes have been used [9,10]. Fluorescent dyes are arguably more suitable for moving into human imaging applications, although many issues remain before the feasibility of human molecular imaging can be assessed.
Given the ubiquitous use of a wide variety of optical probes in molecular imaging, there is a need for more quantitative comparisons of signal levels and sensitivity between probes, particularly with respect to their use in small animal imaging. While many reports of in vivo imaging using bioluminescent and/or fluorescent probes have been published recently, there is often a lack of quantitative information on issues such as sensitivity, signal-to-noise ratio, and background emission from tissues. The main purpose of this paper is to establish a quantitative framework that can be used to compare various optical reporters systematically. This effort involves the development of instrumentation that can simultaneously detect both bioluminescent and fluorescent reporters and the evaluation of instrumental limitations such as noise and background light. An absolute calibration of the imaging system in physical units of radiance is discussed, and for the first time absolute measurements of bioluminescent background is presented. The concept of “efficiency” is introduced as a method of normalizing fluorescent images to indicate the relative level of autofluorescence.
Finally, these concepts are demonstrated with in vivo measurements of bioluminescent and fluorescent reporters in mice. The aim is not to test all fluorescent and bioluminescent probes, of which there are many, but rather to explore the use of a few standard optical reporters at different wavelengths to elucidate some of the fundamental in vivo imaging issues. Only continuous-wave (CW) fluorescent imaging in reflection mode is considered in this study; time-resolved fluorescent imaging has been discussed by others [21–24]. The measurements have been restricted to relatively superficial sites (subcutaneous) at this time to minimize the effect of tissue absorption and scattering allowing us to more quantitatively focus on signal-to-background issues. All in vivo animal experiments were conducted in accordance with the rules and regulations of the Institutional Animal Care and Use Committee (IACUC).
Materials and Methods
Tissue Optics
Mammalian tissue is a turbid medium that can be characterized by an isotropic scattering coefficient, μ′s, and an absorption coefficient, μa [13]. Scattering in tissue occurs due to the index of refraction mismatch between fluid and cellular organelles. Absorption is primarily affected by the presence of chromophores such as hemoglobin, which absorbs strongly at wavelengths less than 600 nm. Typical values for the isotropic scattering and absorption coefficient are 10 < μ′s < 30 cm−1 and 0.5 < μ′a < 5 cm−1 for wavelengths between 400 and 600 nm, and 10 < μ′s < 20 cm−1 and 0.05 < μ′a < 0.5 cm−1 for wavelengths between 600 and 1000 nm [25].
In vivo imaging systems detect the diffuse emission on the surface of the animal and therefore the optical properties of the tissue affect the detected signal and the minimum level of detection. A diffusion model can be used to describe the propagation of light in tissue for wavelengths between 600 and 1000 nm where scattering predominates over absorption. The solution to the diffusion equation for a point source in an infinite medium is given by [26]:
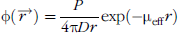
where φ is the photon fluence (photons/sec/cm2), r is the distance away from the source, P is the photon flux,
Figure 1 shows a plot of the photon fluence in an infinite medium as a function of source-detector separation for typical optical properties corresponding roughly to the blue, green, red, and NIR wavelength regions calculated using Equation 1. All curves are normalized to unity at a 1-mm depth. At a source depth of 1 cm the photon fluence is attenuated by a factor of 10−2 in the NIR spectral region to a factor of 10−10 in the blue spectral region. Due to the strong attenuation of photons at shorter wavelengths, the sensitivity of detection in deep tissue is clearly improved at longer wavelengths. This improved sensitivity is particularly true for fluorescence where there is a two-pass effect due to migration of excitation photons toward the source and migration of emission photons back out to the tissue surface.
Bioluminescence Detection
When imaging bioluminescence in vivo, the photon emission from the tissue surface, called surface radiance, is dependent on the photon flux per cell, the number of cells, and the migration of photons through tissue (depth of source). The radiance, Lb (units of photons/sec/cm2/sr, sr = units of solid angle or steradian), on the tissue surface is a function of wavelength, Λ, can be written as:

where Pb is the bioluminescent photon flux (photons/sec) per cell, Nc is the number of labeled cells, and Kem is an attenuation factor through tissue, which is dependent on the tissue optical properties, depth, d, and tissue-air boundary conditions, and must be calculated using a photon diffusion model. There may also be some low level of background photon emission from the tissue known as autoluminescence, which is denoted by Ab and has units of radiance. The wavelength dependence (Λ) is explicitly noted in all of these parameters. Note that for sources at a fixed depth the surface radiance is proportional to cell count, Nc, assuming the other terms remain constant.
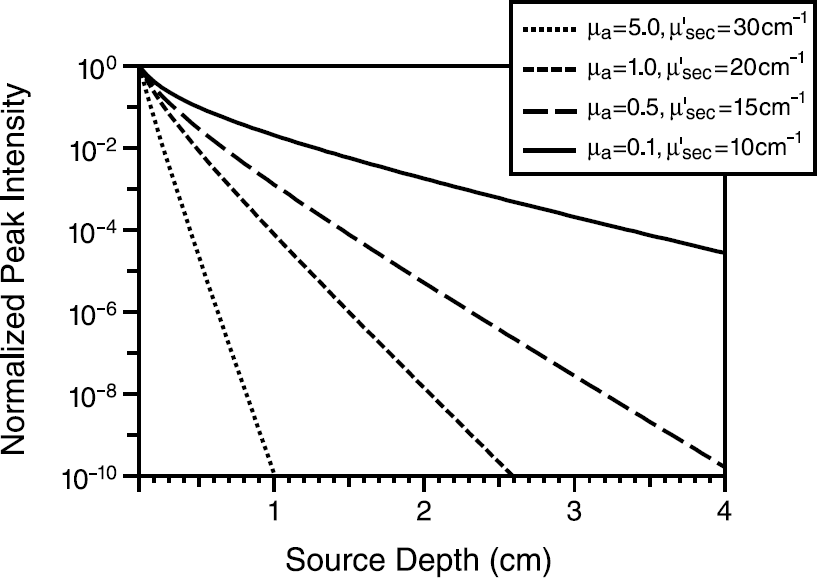
Plot of the peak intensity as a function of source depth corresponding roughly to the blue (short dash), green, red, and NIR (solid) wavelength regions. The graph illustrates the attenuation of light as a function of source location inside tissue. The data were calculated from Equation 1 and the curves are normalized to a source depth of 1 mm.
Fluorescence Detection
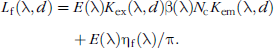
Analogous to bioluminescent detection (Equation 2), the surface radiance for fluorescence is similarly expressed as:

where Pf is fluorescent emission photon flux per cell, Kem is the attenuation of emission photons through tissue, Nc is either the number of fluorescent cells or equivalently the number or concentration of fluorescent molecules, and Af is the autofluorescent background. The quantity Pf is dependent on a number of factors and can be rewritten as Pf = EKexβ, where E is defined as the excitation light incidence (photons/sec/cm2 incident on surface of animal), Kex describes the attenuation of excitation photons through tissue, and β accounts for both the absorption of photons by the fluorophore and the quantum efficiency of the fluorophore [28]. For in vivo imaging, the autofluorescence Af consists of contributions from tissue autofluorescence and instrumental background autofluorescence. The term ηf is introduced as the autofluorescent efficiency, which is the efficiency at which the excitation incidence E is converted to emission excitance πLf. Putting all these terms together, Equation 3 can be rewritten as:
As with bioluminescence, the fluorescent surface radiance is proportional to Nc for a source at a fixed depth. It is important to note that increasing the incidence, E, will increase the fluorophore emission, and will similarly increase the autofluorescent term causing the signal-to-background ratio to remain constant. Assuming that the signal detection is not limited by camera noise, the ratio of the signal (first term) to background (second term) in Equation 2 and Equation 4 can serve as a useful figure-of-merit for the detection of bioluminescence or fluorescence.
Instrumentation
An IVIS® Imaging System 100 Series with an XFO-6 fluorescent kit (Xenogen, Alameda, CA) was utilized for all measurements [29]. This instrument allows for the detection of bioluminescence and CW fluorescence imaging in the wavelength range of 400−950 nm. A 1300 by 1300 pixel high-sensitivity back-thinned 1-in. charged coupled device (CCD) cooled to −105°C is used to minimize dark current and the associated noise. The CCD has high quantum efficiency over the wavelength range of 400–950 nm and thus covers the entire visible and NIR range of interest for optical imaging. The high-sensitivity cooled CCD camera is required for imaging the relatively low light signals emitted from bioluminescent sources, but it also serves as an excellent CCD for fluorescence imaging. The minimum detectability for the instrument is specified at less than 100 photons/sec/cm2/sr for a 5-min exposure and binning of 10 (binning refers to the grouping together of pixels to increase signal relative to read noise for low-light images; a bin = 10 image means 10 by 10 pixels have been grouped together to form one larger super pixel). Because of the high sensitivity and low noise offered by this type of imaging system, the sensitivity of detection of bioluminescent and fluorescent reporters in vivo is rarely limited by CCD noise, but instead is limited by tissue optics considerations and sources of background light.
One of the key features of the IVIS Imaging System for this particular study is that it is absolutely calibrated against a National Institute of Standards and Technology (NIST) traceable spectral radiance source. This calibration provides the conversion of CCD camera counts (often called relative light units) to radiance on the subject surface by taking into account loses through the optics and apertures (f/stop) and accounting for image time and binning. The resulting image is thus displayed in real physical units of surface radiance (photons/sec/cm2/sr), enabling absolute comparisons between bioluminescent and fluorescent images.
A schematic of the instrument is shown in Figure 2. The CCD camera is located on top of a light-tight imaging chamber, and light is collected using a fast f/1 lens. A heated sample stage can move up and down to vary the field of view (FOV) from 10 to 25 cm. The imaging system is controlled though data acquisition and analysis software that allows for convenient switching between bioluminescent and fluorescent imaging modes.
The XFO-6 fluorescence option includes a 150-W quartz tungsten halogen lamp with broadband emission from 400 to 1000 nm. The lamp output is delivered to a six-position excitation filter wheel assembly (Figure 2B) located on the back of the imaging chamber using a 1/4-in. diameter fiber-optic bundle. Light from the fiber-optic bundle passes thought a collimating lens and then a 25-mm diameter excitation filter. Following the excitation filter, a second fused silica lens focuses light onto a 1/4-in. fused silica fiber-optic bundle inside the imaging chamber. Fused silica fibers are used here instead of ordinary glass to avoid the generation of an autofluorescence from impurities in the glass. The fused silica fiber bundle splits into four separate legs that deliver filtered light to four reflectors located on the ceiling of the imaging chamber. The reflectors provide a diffuse signal with fairly uniform illumination that varies less than 30% across the sample stage. Six excitation filter wheel locations allow up to five fluorescent filters. A light block provided in one filter slot is used during bioluminescent imaging to prevent external light from entering the imaging chamber. Fluorescent emission from the target fluorophore is then collected though a 75-mm diameter emission filter wheel (also six positions) located in front of the f/1 lens.
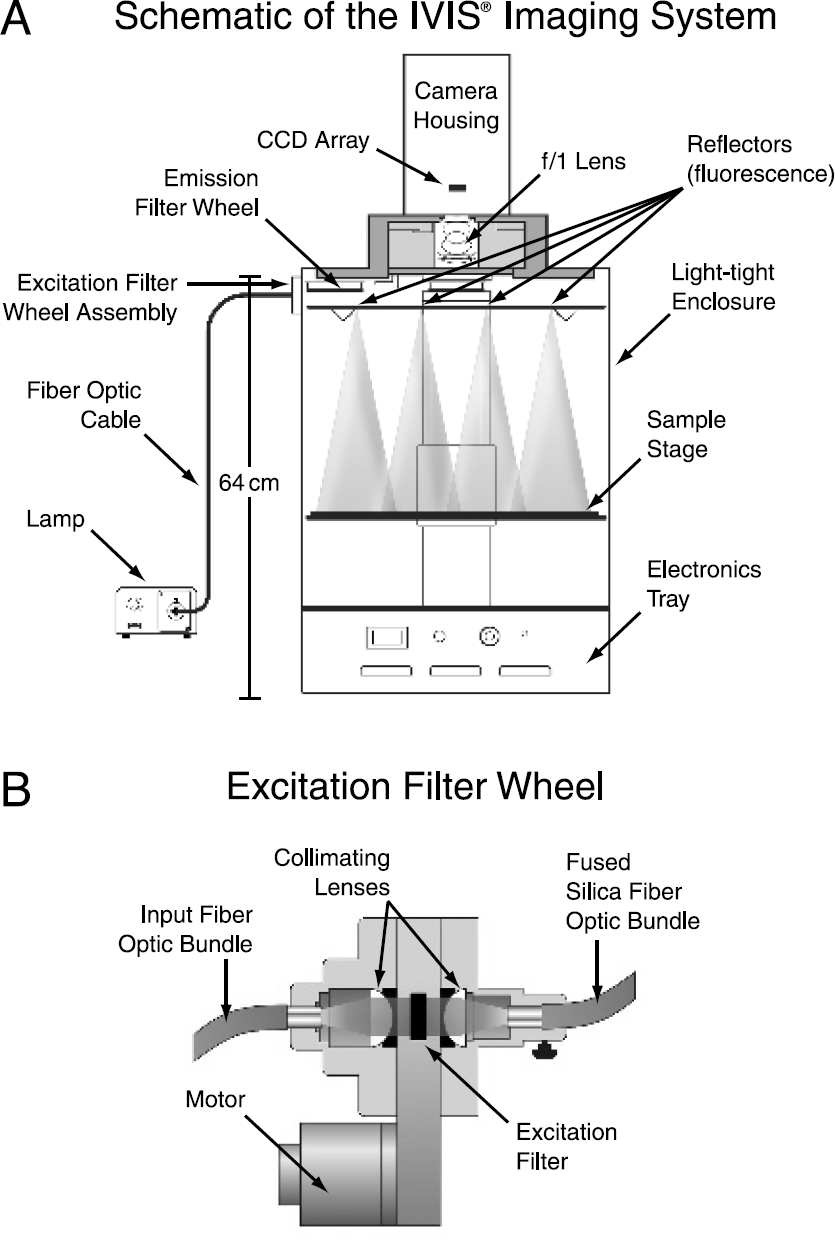
(A) Schematic diagram of the IVIS® Imaging System 100 Series including the XFO-6 fluorescent kit hardware components. (B) Cross-section of the excitation filter wheel assembly, which is located on the hack of the instrument.
Summary of the Current Filter Sets as well as Some Commonly Used Fluorescent Dyes and Proteins
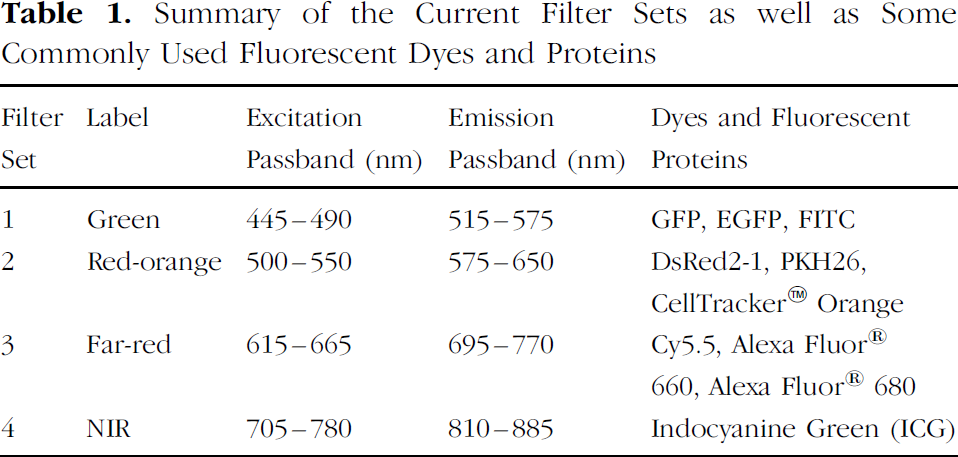
The excitation and emission filters used in this study are bandpass interference filters (Alpha Technology, Omega Optical, Brattleboro, VT) with high out-of-band blocking to minimize light leakage (light leakage is the amount of excitation light that leaks through the emission filter bandpass region). The filters are designed to have at least a 25-nm gap between excitation and emission bands with a theoretical leakage level below an optical density OD9 [OD = –log(T) where T is transmission] for collimated light. When incorporated into an imaging system, the filters have higher leakage due to non-normal rays. There is also some low level of autofluorescence generated by the materials (glasses, epoxies, coating, etc.) used in filter construction. Including these effects, the actual leakage for the entire imaging system is higher, on the order of OD7.
Four sets of filters were used for these experiments, as shown in Table 1 and Figure 3- The labels for these sets were defined by the wavelength of the emission filter: Green, red-orange, far-red, and NIR. Also included in Table 1 are some popular fluorescent dyes and proteins that can be used with each filter set.
Instrument Calibration
Images acquired with the IVIS Imaging System are calibrated in units of total radiance, L (photons/sec/cm2/sr). This is accomplished using electronic low-light diffuse calibration sources (XLS-4, Xenogen) that are cross-referenced to a NIST-traceable integrating sphere (OL Series 425, Optronic Laboratories, Orlando, FL). The XLS-4 source is calibrated at 600 nm giving a known radiance (typically 2 × 10⁸ photons/sec/cm2/sr). This source is imaged in the IVIS system at all magnifications and f/stops to generate a set of conversion coefficients to convert CCD counts to radiance on the subject, thus accounting for all transmission factors through the optical system. The calibration is only performed at 600 nm at this time and is assumed to be constant to within ±10% over the wavelength range of interest from 500 to 800 nm.
Region-of-interest (ROI) measurements on an image can be used to convert surface radiance to source flux. In the case of in vitro measurements of luminescent cells in a well plate, for example, it is assumed that the cells are radiating isotropically so that the total flux (in photons/sec) from a well is P = 4π ∫ROILdA, where the integral is over the ROI area.
An additional calibration step called “flat-field” calibration is also performed on all images. All lenses tend to exhibit a drop-off in light collection efficiency from the center to corner of the FOV. We have measured the drop-off in collection efficiency for all imaging conditions and use this information to correct the images to produce a “flat” light collection profile.

Spectral curves for the (A) green, (B) red-orange, (C) far-red, and (D) NIR filter sets described in Table 1.
For fluorescence measurements, the fluorescent excitation incidence, E (photons/sec/cm2), is determined for each filter by imaging a Lambertian reflector placed on the sample stage and illuminating it with the fluorescence light source. In this case, the illumination light passes through the excitation filter and an OD4 neutral density filter, and the emission filter is left open. The measured radiance from the reflector is then used to calculate E for each filter using the following method [30]. First, the measured radiance, L, on the Lambertian reflector is converted to excitance, M (photons/sec/cm2), integrated over the solid angle:

where the differential solid angle is defined as dΩ = sinθcosθdθdφ. Making the appropriate substitutions and integrating over a hemisphere gives:

For a 100% Lambertian reflector, the incidence equals the excitance or

Although no reflector is 100% Lambertian, this approximation is good to within a few percent and was used to determine E from measurements of L (corrections for the OD4 neutral density filter are also made to Equation 7). Table 2 gives values of the incidence for all the excitation filters at the center of a 20-cm FOV and a lamp intensity of 100%.
The autofluorescent efficiency parameter, ηf, defined previously in Equation 4, can be used to characterize autofluorescence from tissue and other instrumental sources. Instrumental sources can include optics, plastic materials such as well plates, paint on the chamber walls, etc. These efficiency parameters are defined as the autofluorescent excitance measured on an object divided by the incidence, or

(πL, is measured with both excitation and emission filters in place). If all the incident photons create fluorescent emission photons, then ηf will be unity. Typically, the values of autofluorescent efficiency for optics and tissues are wavelength dependent and in the range of 10−4 to 10−8 (discussed later in Table 2).
Results
Sources of Background
As discussed previously in Equations 2, 3, and 4, sources of autoluminescence and autofluorescence affect the ability to detect bioluminescent and fluorescent probes of interest. For in vivo imaging, background emission from tissue is the primary concern. The high sensitivity and low noise associated with cooled CCD cameras generally results in the situation where external sources of background light set the lower limit for detection, as opposed to camera noise. Therefore, it is important to characterize the level of background emission, particularly from live animal tissue, as described below.
Autofluorescent Efficiency, ηf, of Mouse Tissue Calculated Using Equation 8 for Animals Fed (a) Regular Rodent Food and (b) Alfalfa-Free Rodent Food

Data for both the dorsal and ventral views are shown along with E of the light source and Lf measured at an FOV of 20 cm. Also included is the autofluorescent efficiency from the instrumentation. The values shown here are average values taken from two male and two female Nu/nu mice.
Autoluminescence
All mice imaged to date as part of this study exhibited a very low level of autoluminescence. Images of control mice show autoluminescence over the entire body with somewhat higher levels originating from the abdominal and thoracic regions. The sources of this emission are not currently well understood, but some general observations have been made. First, this type of emission is slightly greater in mice with white fur compared with nude mice as shown in Figure 4 where the average autoluminescent radiance levels are 1600 photons/sec/cm2/sr and 1000 photons/sec/cm2/sr, respectively. These values are considerably above the lower limit of detectability of the IVIS Imaging System, which is about 100 photons/sec/cm2/sr (for a 5-min image with binning of 10). These images show that the background bioluminescent signal is slightly nonuniform over the animal body. Other observations are that the autoluminescent level in luciferin-injected animals is approximately 20% higher than nonluciferin-injected animals. Also, female mice are approximately 30% brighter than male mice, especially when imaging the ventral views.
The spectrum of the autoluminescence from a control mouse was measured using seventeen 20-nm bandpass filters, spaced every 20 nm from 420 to 740 nm as shown in Figure 5- Both the dorsal and ventral views of a 24-week-old female CD-1 mouse were examined. Imaging started 5 min after the injection of 150 mL of 30 mg/μL firefly luciferin in saline solution. The spectral data show that the autoluminescence from the ventral side is larger than the dorsal side, but both follow the same trend with the peak emission centered at 660 nm. The emission spectrum has roughly the same shape as the tissue/hemoglobin transmission curve (rapid increase near 600 nm), indicating that the source is most likely internal to the body, as opposed to being a surface effect.
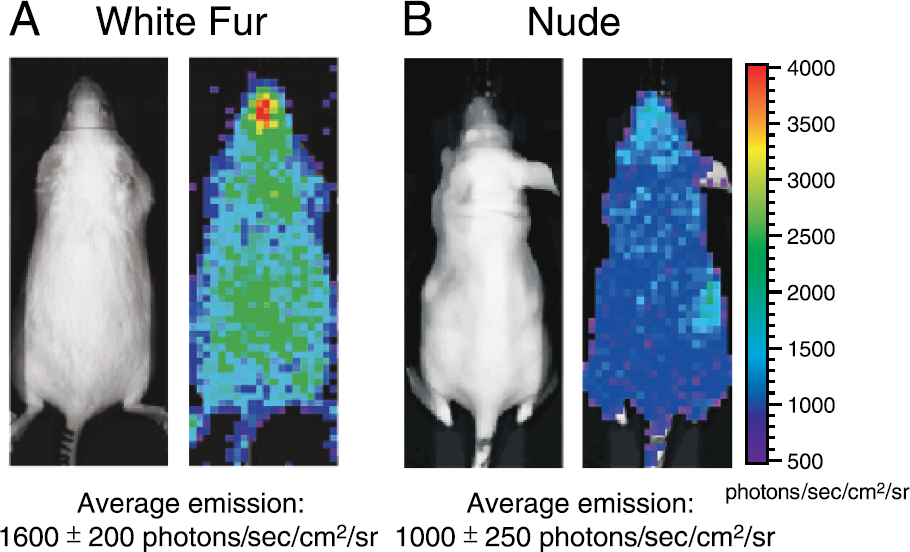
Sample images of the background emission light from (A) a female white furred (Swiss Webster) and (B) a female nude (Nu/nu) mouse. The left image is a gray-scale photograph and the right image is a pseudocolor overlay.

Spectrum of the average autoluminescence from the tissue of a 24-week-old female CD-1 mouse. The measurements were made using 17 emission filters that were 20-nm wide. The data are displayed at the center wavelength of each filter and the error bars represent the standard deviation from seven equal-sized ROIs measured over the animal surface.
Several tests have been conducted to try to minimize the source of autoluminescence in mice. One hypothesis was that some type of phosphorescent component exists in the fur or tissue that is being charged by room lights and subsequently re-emitting over a period of minutes to hours. To test this, animals were housed in the dark for 12 hr prior to imaging allowing any phosphorescent component to decay away. The autoluminescent level was not significantly reduced after housing the animals in the dark, so it can be concluded that emission is due to an internal chemiluminescent process, not a phosphorescent process. A shaving study was conducted to see how fur affected the autoluminescence. Shaving white furred animals showed no significant increase or decrease in autoluminescence. The effect of shaving black furred mice such as C57bl/6 was also investigated. Under normal conditions, the autoluminescent signal in black furred animals is lower than the instrument noise because of absorption by the fur. However, when these animals are shaved their autoluminescent levels approach that of the other strains.
The alfalfa (chlorophyll) in mouse food is known to be phosphorescent so it was eliminated from the mouse diet to try to reduce the background. Alfalfa-free food (Harlan Teklad, TD97185 non-irradiated and TD97184 irradiated, Madison, WI) did reduce autoluminescence by approximately 20%, a relatively small effect. Because no external sources were a major contributor to the background emission, the source of the animal background is believed to be due to an internal chemiluminescent process associated with some type of normal metabolic activity. This postulation is also corroborated by the fact that the autoluminescent levels drop to the level of the instrument noise in euthanized animals. Finally, it is worth noting that aside from the low level of autoluminescence emitted from live animal tissue, there are no other sources of background luminescence in the IVIS instrument.
Autofluorescence
Sources of autofluorescence include both an instrument component due to optics and filters of the imaging system and a biological component from the animal tissue itself. Typically, tissue autofluorescence is much higher than instrumental autofluorescence, particularly in the visible wavelength range. Generally, autofluorescence from most materials, including tissue, is higher at short wavelengths (350–550 nm) and decreases in the red to NIR (600–950 nm). Although the level of autofluorescence is dependent on the intensity and wavelength of the excitation source, autofluorescence is generally many orders of magnitude brighter than autoluminescence.
In vivo autofluorescence can appear throughout the animal (everywhere there is excitation light), but will be brightest on the surface where the excitation light is the strongest. Tissue autofluorescence is caused by the endogenous chromophores in animal tissues including elastin, collagen, tryptophan, NADH, porphyrins, and flavins. These chromophores have absorption bands centered from the ultraviolet to blue regions of the spectrum and emission bands throughout the visible spectrum [31,32]. The autofluorescent excitation and emission spectra from the surface tissue on a living nude mouse were measured using a spectrofluorometer with a fiber-optic probe attachment (Fluorolog®-3, Joybin Yvon, Edison, NJ) as shown in Figure 6. These data, taken from the lower dorsal region, demonstrate a general decrease in autofluorescence toward the NIR region of the spectrum. The bump in the emission spectrum at 660 nm is believed to be due to chlorophyll in the intestines that was ingested with the mouse food.

Autofluorescent tissue spectra from a 12-week-old female Nu/nu mouse.
Figure 7A shows autofluorescent images of mouse tissue using the four filter sets for mice fed regular (containing alfalfa) rodent food. Autofluorescence in the green and red-orange spectral regions is fairly uniform over the entire animal. For the far-red and NIR spectral regions, tissue autofluorescence is more concentrated in the intestinal area due to the chlorophyll. To minimize the signal coming from the intestines, the animal diet was substituted with an alfalfa-free version (same food used to minimize autoluminescence in the animal; see above) because an in-house study showed that the normal rodent food has a significant fluorescent signature over the entire visible wavelength region and the alfalfa-free version does not. Figure 7B shows fluorescent images of the same control mouse after its diet was replaced with the alfalfa-free version for a week (images are displayed using the same color scales of Figure 7A). A comparison of the two sets of images shows that the proper choice of food can minimize autofluorescence in the intestinal area to the levels of the rest of the body for the far-red and NIR filters. The tissue autofluorescence for the green and red-orange filter sets also appears slightly reduced with the alfalfa-free diet.
In order to eliminate variations in excitation incidence, and more quantitatively compare the autofluorescence of mouse tissue measured with the different filter sets, values of the autofluorescent efficiency, %, were calculated using Equation 8 by measuring the incidence and the average autofluorescent radiance, Lf, over the entire animal from four Nu/nu mice (two males and two females). The results are listed in Table 2 for mice fed both an alfalfa and alfalfa-free diet, confirming that an alfalfa-free diet not only lowers the autofluorescence for the far-red and NIR filter sets by reducing the intestinal signal, but also slightly lowers the overall autofluorescence for the green and red-orange filter sets. These data also show the same general decrease in autofluorescence with increasing wavelength as indicated in Figure 6. Also included in Table 2 is the auto fluorescent efficiency of the instrumentation. In this case, the mice were removed and an image of an empty box was taken for each filter set. The efficiency was calculated in the center of the FOV and is listed in the right-hand column in Table 2. Measured in this way, the instrumental autofluorescent efficiency includes all instrumental background including autofluorescence of optics, filters, chamber, and filter light leakage. The results show that the autofluorescence of the tissue ranges from 3 to 50 times higher than the instrumental background for the NIR to green, respectively. Therefore, tissue auto fluorescence is the dominant source of background light for the green, red-orange, and far-red filter sets. For the NIR, tissue auto fluorescence is still higher than the instrumental background, but the two terms are becoming comparable.

Fluorescent images for the ventral side of a control mouse (Nu/nu male), illustrating animal tissue autofluorescence for the green, red-orange, far-red, and NIR filter sets. The images were taken after the animal was fed for a week with (A) regular rodent food and (B) alfalfa-free rodent food.
Comparison of Bioluminescent and Fluorescent Markers
In all the following experiments, dual-tagged reporter systems were investigated in order to compare bioluminescence and fluorescence in the same cell line. The two cell lines investigated here were both stably transfected bioluminescent human cancer cell lines. The first cell line used in the study was PC-3M-luc-C6 (human adenocarcinoma, prostate) co-transfected with two plasmids: pGL3 control (SV40-luc from Promega) and pSV40/Zeo2 (Invitrogen, Carlsbad, CA). The second cell line was HeLa-luc (human adenocarcinoma, cervix) transfected with two plasmids: pGL3 control (SV40-luc from Promega) and p2eoSV2 (Invitrogen). The PC-3M-luc-C6 cells were then stably transfected with the fluorescent protein DsRed2-1 (PC-3M-luc/DsRed) and the HeLa-Luc cells were labeled with 30 μM of the fluorescent dye PKH26 (HeLa-luc/PKH26). In all of the following experiments, regular mouse food containing alfalfa was given to the animals. Imaging times for all the following experiments were typically 30 sec for bioluminescent imaging and 1–10 sec for fluorescent imaging.
In Vitro Imaging
In order to characterize these cell lines, in vitro imaging was performed in black-bottom 96-well plates that were tissue culture treated. For these studies, each cell line was serially diluted by a factor of 2 per well. Either cell-specific media or a 1-M solution of phosphate buffer saline (PBS) was used to achieve a final volume of 100 μL in each well. PBS was used with the fluorescent data in order to prevent detecting autofluorescence from Phenol Red present in the media. The red-orange fluorescent filter set was used for both cell lines because it had been designed for the spectral properties of DsRed2-1 and PKH26. All measurements were conducted at an FOV of 15 cm with an excitation incidence of 1.2 × 10¹³ photons/sec/cm2.
The first sets of experiments were conducted on the PC-3M-luc/DsRed cells. The spectral properties for this dual-tagged cell line are shown in Figure 8. The fluorescent and bioluminescent emission for a serial dilution of cells is shown in Figure 9. The fluorescent IVIS image illustrates that approximately 1.25 × 10⁴ cells can be visually detected above the background autofluorescence of the instrumentation. The graph of fluorescent flux versus cell count shows a linear trend yielding an average output from a single cell of approximately 2.2 × 10³ photons/sec. For bioluminescent imaging, the same cell line with a starting concentration of 1.0 × 10⁵ cells was serially diluted to a minimum of 50 cells/well in PBS. These cells were imaged approximately 2–3 min after the addition of luciferin. The luminescent data show that as few as 100 cells are detectable above the instrument noise, and the mean bioluminescent flux from each cell is 170 photons/sec. The fluorescent emission from the PC-3M-luc/DsRed cells is approximately 10 times brighter than the bioluminescence, yet the minimum number of cells that can be detected above background is approximately 150 times lower than that detected through bioluminescence. The reason for this is that there is essentially no autoluminescent background for in vitro measurements, while there is residual instrumental autofluorescent background.

Fluorescent and bioluminescent spectral data from PC-3M-luc cells that were stably transfected with the fluorescent protein DsRed2-1. All spectral data were measured at room temperature.

PC-3M-luc/DsRed cells serially diluted in separate 96-well plates by a factor of 2. The images show that approximately 1.25 × 10 cells can be detected by fluorescent imaging and approximately 100 cells can be detected by bioluminescent imaging. The graph of fluorescent/bioluminescent intensity versus cell number shows the mean fluorescent and bioluminescent signal from a single cell is 2.2 × 10³ and 170 photons/sec, respectively.
It should be emphasized that the minimum number of cells that can be detected in vitro for both bioluminescence and fluorescence is not a fundamental limit, but depends on optical parameters such as magnification (FOV), pixel size (binning), etc. For macroscopic images such as shown in Figure 9 with FOV of 15 cm and binning of 4, the minimum detection levels are 100 and 1.25 × 10⁴ for bioluminescence and fluorescence, respectively. However, with increased magnification (smaller FOV) and smaller bin size (higher resolution), it is possible to detect single cells with either bioluminescence or fluorescence.
These same sets of measurements were conducted for the HeLa-luc/PKH26 cell line. The fluorescent and bioluminescent spectra for this cell line are shown in Figure 10 and the fluorescent and bioluminescent images are shown in Figure 11. For the fluorescent measurement, the cells were serially diluted by a factor of 2 from 2.5 × 10⁶ to 2.5 × 10³ cells. The minimum detection limit is 5 × 10³ cells and the linear correlation between florescent flux and cell concentration gives a fluorescent flux of 7.3 × 10³ photons/sec/cell. For the bioluminescent measurement, the cells were serially diluted in two rows from 1.25 × 10⁶ to 40 cells. A minimum of 40 cells can be detected and the linear correlation between bioluminescent flux and cell number gives a bioluminescent flux of 170 photons/s/cell, similar to the PC-3M-luc/DsRed cell line.

Fluorescent and bioluminescent spectral data from HeLa-luc cells labeled with PKH26 dye. All spectral data were measured at room temperature.

HeLa-luc cells labeled with a 30-μM concentration of PKH26 serially diluted by a factor of 2 in two separate 96-well plates. For bioluminescent imaging, two rows were used in order to dilute the concentration down to 40 cells The images show approximately 5.0 × 10³ cells are detectable by fluorescent imaging and approximately 40 cells can be detected by bioluminescent imaging. The graph of fluorescent/bioluminescent intensity versus cell number shows the mean fluorescent and bioluminescent signal from a single cell is 7.3 × 10³ and 170 photon/sec, respectively.
In Vivo Imaging
In the first study, 3 × 10⁶ PC-3M-luc/DsRed cells were subcutaneously implanted into the lower back region of a male Nu/nu mouse and imaged for fluorescence (Figure 12A) and bioluminescence (Figure 12B). The two images are taken of the same mouse within 40 min of one another. The two top ROIs were used to determine the respective average emission for the background, and the two lower ROIs were used to determine the maximum emission from the implanted cells. Although the DsRed2-1 fluorescent signal level detected on the surface of the animal is 110 times brighter than the bioluminescent signal level, the large background au to fluorescence significantly reduces the signal-to-background ratio. Fluorescent imaging therefore, requires at least 3–8 × 10⁵ cells to obtain signal above tissue autofluorescence while bioluminescent imaging requires only 400 cells to get signal above the autoluminescence.

Fluorescent (left) and bioluminescent (right) images for a subcutaneous injection of 3 × 10⁶ PC-3M-luc/DsRed cells in an 11-week-old male Nu/nu mouse.
A somewhat deeper tissue model was investigated by intramuscularly injecting 1 × 10 HeLa-luc/PKH26 cells in the left flank of a female Nu/nu mouse. The mouse was also intramuscularly injected with 1 × 10⁶ HeLa-luc control cells (only bioluminescent signal) in the right flank. Figure 13 shows the images of the both the fluorescent and bioluminescent measurements. The images nicely illustrate the detection of the appropriate cell lines: Fluorescent signal only in the left side and bioluminescent signal on both sides. The bioluminescent image indicates that dual tagging the cell line does not impede the bioluminescent emission because both regions have approximately the same signal levels. This example again shows that even though the fluorescent emission levels are several orders of magnitude brighter, tissue autofluorescence impedes detection. At least 1.5 × 10⁵ cells are necessary for fluorescent detection while only 900 cells are necessary for bioluminescent detection.
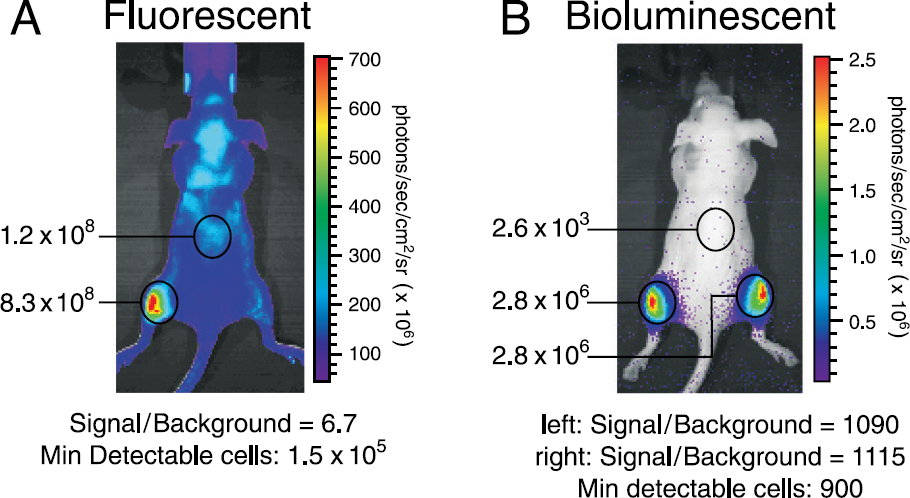
Fluorescent (left) and bioluminescent (right) images for an intramuscular injection of 1 × 10⁶ HeLa-luc/PKH26 cells in the left flank and 1 × 10⁶ control HeLa-luc cells in the right flank of a 6- to 8-week-old female Nu/nu mouse.
Even though the HeLa-luc/PKH26 cells are injected deeper into the tissue, fewer of these cells are necessary for fluorescent detection because this cell line is 3.3 times brighter than the PC-3M-luc/DsRed cells (see in vitro data). Nonetheless, this experiment does show the effects of tissue absorption since the ratio of fluorescent cells necessary for detection reduced to 2.5 and more bioluminescent cells are necessary for detection (both cell lines have the same bioluminescent signal levels). Although both of the animal models shown in this section are relatively superficial sites, they illustrate the limitation of autofluorescence and autoluminescence on detection sensitivity.
For sources originating from deeper tissue, detection becomes more difficult because the surface radiance decreases due to tissue absorption while the background emission remains constant. A deep tissue study was conducted by investigating the sources originating from the lungs due to a tail vein injection of 1 × 10⁶ HeLa-luc/PKH26 cells (data not shown). For the bioluminescent image, the lung signal was about 35 times higher than the autoluminescent background, while the fluorescent signal was not detectable above the tissue autofluorescence.
Techniques to Improve Fluorescent Detection Sensitivity
High levels of autofluorescence clearly limit detection sensitivity, particularly in the visible wavelength range of 400–600 nm, therefore different methods are being explored to minimize this effect. The first technique is to use fluorescent probes that are shifted towards far-red to NIR wavelength region. As discussed above, autofluorescence from mouse tissue decreases with increasing wavelength and tissue penetration improves. Although no fluorescent proteins are currently available in the far-red to NIR, there are dyes, fluorescent microspheres, and quantum dots available. Another technique is to use blue-shifted background filters to subtract out the auto fluorescent contribution from an image. Both of these methods are investigated below.
Three-Color Microspheres
An in vivo fluorescent microsphere study was conducted to demonstrate that red shifting the excitation and emission wavelengths will help increase the signal-to-background ratio for fluorescent imaging. Three different types of fluorescent microspheres, F-8836, A-7303, and F-8843 (Molecular Probes), were selected because their excitation and emission spectra are optimal for use with the green, red-orange, and far-red filter sets, respectively. Although these microspheres come in an extensive selection of colors, one in the NIR region of the spectrum was not available. The fluorescent microspheres were chosen for this experiment because they are stable, uniform in size, and have reproducible fluorescent emission characteristics.
Figure 14 shows a schematic illustration of the injection sites as well as fluorescent images from an experimental (left) and a control (right) mouse using the three different filter sets. The control animal was used to measure the background autofluorescence at the injection sites since the emission levels can be nonuniform over the animal. The images of the experimental mouse illustrate the detection of the appropriate microsphere due to the proper choice of filter sets. Some fluorescent emission from the green fluorescent microspheres (F-8836) is seen with the red-orange filters because these beads have a wide excitation and emission spectrum.
In order to quantitatively compare the in vivo fluorescent data, differences in the extinction coefficients and quantum yields for the microspheres need to be accounted for. Normalization factors for each bead were determined from in vitro images of the microspheres. Once these factors were determined, the in vivo measurements were normalized accordingly. The normalized data show that the green, red-orange, and far-red microspheres have signal-to-background ratios of 11, 20, and 54, respectively, demonstrating the expected improvement at longer wavelengths as autofluorescence decreases. These mice were imaged with a normal (alfalfa based) diet. An alfalfa-free diet would lead to further improvements in the far-red.

Comparison of the fluorescent emission from three types of fluorescent microspheres that were suhcutaneously injected at a volume of 100 μL into the scruff (green beads, F-8836), left flank (red-orange beads, A-7303), and right flank far-red beads, F-8843) of a mouse. (A) Schematic of the injection sites, (B) fluorescent image using the green, (C) red-orange and (D) far-red filter sets. The subject (left) and control (right) are 11-week-old female Nu/nu mice.

Spectral data describing the autofluorescent background subtraction technique using filters. The graph shows the excitation and emission spectrum of PKH26 and the autofluorescent excitation spectrum of mouse tissue. Also included are the ideal spectral passbands for the background, excitation, and emission filters that are used with this dye.
Background Filters
Moving towards the NIR region of the spectrum to reduce autofluorescence is not always experimentally feasible. In fact, even in the NIR, there is still a low level of autofluorescence that would be desirable to eliminate. Thus, regardless of the wavelength being used, there is a need for techniques to subtract out the tissue autofluorescence from the measurement. The simplest subtraction method is to use a second excitation filter that is slightly blue-shifted from the primary excitation filter. The objective of these blue-shifted excitation or “background” filters is to excite the tissue autofluorescence without exciting the fluorophore. The background filter image can then be subtracted from the primary filter image using an appropriate scale factor, thus reducing autofluorescence. The assumption here is that the tissue excitation spectrum is much broader than the fluorophore of interest and that the spatial distribution of autofluorescence does not vary much with small shifts in the excitation wavelength.
Figure 15 shows the spectrum for HeLa-luc/PKH26 cells, the autofluorescent excitation spectrum of mouse tissue and pass bands for the background filter, the primary excitation filter, and the emission filter. The background filter excites mostly tissue autofluorescence, while the primary excitation filter excites PKH26 and tissue autofluorescence. Because the magnitude of autofluorescent excitation curve varies from the background filter to the excitation filter, a scale factor needs to be determined prior to subtraction.
The procedure is as follows. First, two images are acquired, one with the background filter and one with the primary excitation filter. For both of these images, the same emission filter is used. The scale factor is a ratio of the autofluorescent signal measured using the background filter to the autofluorescent signal measured using the excitation filter. It accounts for different levels of tissue autofluorescence due to different excitation wavelengths and filter transmission characteristics. The scaled background image is subtracted from the primary excitation filter image resulting in a significant reduction in autofluorescence while leaving most of the fluorophore signal.
This procedure is illustrated in Figure 16. In this example, 1 × 10⁶ HeLa-luc/PKH26 cells were subcutaneously implanted into the left flank of a 6- to 8-week-old female Nu/nu mouse. The primary excitation filter image (top left), the background excitation filter image (top right), the autofluorescent corrected image (bottom left), and the bioluminescent image (bottom right) are all shown. The corrected image was obtained using a background scale factor of 1.4, determined by taking the ratio of the excitation-to-background autofluorescent signal on the scruff of the animal (see top ROI in Figure 16A and B). Numbers shown in the figures are the peak radiance for the signal and the average radiance of the animal background within the ROI. In the corrected image, the root mean square (RMS) error is used to quantify the background. The signal-to-background ratio of the original fluorescence image (red-orange filters) is 6.5. This ratio increases to 150 in the corrected image, an improvement factor of 23. This improvement reduces the minimum number of cells necessary for detection from 1.5 × 10⁵ to 6.7 × 10³. Although this is a step in the right direction, sensitivity is still not improved to the levels of bioluminescent imaging where a minimum of 200 cells can be detected. An extension of this approach is to use an array of fluorescent filters along with a spectral unmixing algorithm [33]. Spectral unmixing is currently being explored at Xenogen and may lead to further improvements in fluorescent detection sensitivity.

Autofluorescent background correction data using the filter subtraction technique. The images show the (A) red-orange, primary excitation filter data, (B) blue-shifted background excitation filter data, (C) corrected data, image B multiplied by the scale factor and subtracted from A (scale factor = 1.4), and (D) bioluminescent data. The 6-week-old female Nu/nu mouse was injected subcutaneously with 1 × 10⁶ HeLa-luc/PKH26 cells in the left flank.
Discussion
In vivo imaging of bioluminescent and fluorescent reporters is a powerful technology that has great research potential for the study of biological activity and the development of therapeutic agents. The choice of a bioluminescent or fluorescent reporter depends on several factors such as biological suitability, detection sensitivity, and tissue optics considerations such as reporter depth and absorption due to the presence of hemoglobin in the vascular volume. In this work, measurement instrumentation and analysis techniques have been presented that provide a more quantitative comparison of the detection sensitivity of various reporters. Absolute measurements of the autoluminescent radiance and spectrum have been made for the first time. The concept of fluorescence “efficiency” has been introduced as a method for comparing the relative autofluorescent levels from tissue at different wavelengths.
Two dual-reporter cell lines have been imaged in vivo to compare relative sensitivity. Although fluorescent signals are generally brighter than bioluminescent signals, depending on the intensity of the excitation source, the signal-to-background ratio is usually worse for fluorescence due to high levels of tissue autofluorescence, which is particularly true in the green to red part of the spectrum. Typically, ˜500 bioluminescent cells can be detected subcutaneously in mice, versus ˜105 cells labeled with a red fluorescent reporter. In the far-red to NIR part of the spectrum, tissue autofluorescence is reduced, however, care must be taken to avoid autofluorescence from food containing chlorophyll in the intestinal region. Despite difficulties with tissue autofluorescence, fluorescent imaging does benefit from a wider variety of reporters including fluorescent proteins, dyes, and microspheres, as well as recently developed nanoparticles such as quantum dots. Fluorescent probes are also available in a wider variety of emission wavelengths. Therefore, techniques to reduce the effects of autofluorescence would be helpful, particularly for visible wavelengths. The use of blue-shifted background filters was tested as one method to reduce autofluorescence. This technique produced roughly a 23-fold improvement in the in vivo detection sensitivity of PKH26 labeled fluorescent cells.
Footnotes
Acknowledgments
We thank Paul Kwon and Lin Esposito for their assistance with the experiments discussed in this report and Timothy Doyle for insightful discussions.