
Abstract
In vivo bioluminescent imaging using cells expressing
Introduction
In vivo bioluminescence imaging is a widely used method for measuring light output of cells induced to express bioluminescent reporter enzymes upon substrate addition. Serial bioluminescence imaging of animal models of disease can provide information not easily obtained by other methods and is an efficient, high-throughput method with perhaps the highest sensitivity of detection of any animal imaging modality [1]. The increasing application of bioluminescent imaging to in vivo studies has resulted in a growing interest in using two or more reporter proteins in the same animals. The two most commonly used bioluminescent reporters are firefly and
The use of
These two coelenterazine analogs, ViviRen™ and EnduRen™, developed by Promega Corporation (Madison, WI), were engineered to reduce the autoluminescence found with coelenterazine, as well as to have higher inherent light output in the presence of the enzyme
Materials and Methods
Cell Culture and Brain Tumor Injection
The human brain tumor cell line U87MG (glioblastoma) expressing
Seven mice were injected with human glioblastoma for this study. Female (6–8 weeks) nu/nu mice were purchased from Harlan Sprague–Dawley (Indianapolis, IN). Details of the orthotopic xenotransplant model in nu/nu have been described previously [13]. In summary, 1.5 × 10⁵ or 6 × 10⁴ tumor cells were suspended in 2 or 1 μL, respectively, of DMEM. Originally, we injected four mice with 1.5 × 10⁵ tumor cells, but for later experiments where we wished to assess the substrates on small tumors (< 1.0 mm in diameter), we injected three new mice with 6 × 10⁴ tumor cells. Tumor cells were injected using a stereotaxic apparatus over 5 min into the forebrain at 2.0 mm lateral and 0.5 mm anterior to the bregma, at a depth of 3.3 mm. Mice were kept under general anesthesia (100 mg/kg ketamine and 10 mg/kg xylazine) during these procedures. All animal studies were done according to NIH guidelines and approved by the local animal care committee.
Substrates and Preparation
All three substrates were kindly provided by Promega (Figure 1). We used equimolar amounts (0.295 mM working concentration) of each substrate for the imaging studies performed here. This is equivalent to 1 mg coelenterazine/kg body weight, the reported amount used for in vivo imaging of Rluc expression [11]. All substrates were diluted in dimethyl sulfoxide or ethanol and aliquots were made using phosphate-buffered saline (PBS) and 0.1% bovine serum albumin, and these aliquots were used for both in vitro and in vivo studies. All dissolved compounds were stored in either −80°C or 20°C freezers prior to thawing for experiments.
Bioluminescent Imaging
Bioluminescent imaging was performed using a prototype imaging system (IVIS) manufactured by Xenogen Corporation (Alameda, CA). The system is linked to a PC and runs Living Image software (version 2.50, Xenogen) and Igor (Wavemetrics, Lake Oswego, OR) using Microsoft Windows 2000 (Microsoft Corp., Redmond, WA). This prototype system uses the same Roper Scientific (Roper Industries, Inc., Duluth, GA) cooled, back-thinned CCD camera as do most of the IVIS systems (Xenogen has recently switched to another manufacturer of cameras).
In Vitro Studies
In order to determine whether the substrates produced signal in our U87MG cells, we first performed in vitro tests. For these studies, U87MG Rluc cells were plated overnight (50,000 cells/well) in black 24-well plates (Greiner Bio-One, Longwood, FL). Black plates were used to avoid luminescent signal “bleed” from nearby wells of the plate containing luminescent cells that can occur with bright cell lines and transparent plates.

Molecular structures of native coelenterazine and the substrate analogs EnduRen and ViviRen. Coelenterazine analogs EnduRen and ViviRen have small groups added, as outlined by boxes. These groups are cleaved by lipases and esterases within cells.
Two plates were used for duplication. For each plate, three wells contained U87MG Rluc cells (50,000 cells each). Wells containing nontransfected U87MG cells and others containing medium only served as controls. To the three U87MG Rluc-containing wells on each plate, one substrate per well was added (20 μL per well). The individual substrates were added in the same fashion to control wells to test for background autoluminescence. One additional cell plate was originally used, with wells containing the same groups of cells as above; however, due to an error in calculation, 50 μL per well of substrate was added. This well plate is not included in this analysis for this reason, but the results were the same as with the other two plates, save for an exception discussed in the Results section.
Bioluminescent imaging was performed on each plate immediately following substrate delivery to all of the wells containing cells or medium. Each plate was imaged by placing it in the IVIS imaging system and acquiring images for 10 sec each at 5-min intervals for 30 min. Images were analyzed by region-of-interest (ROI) analysis using the Living Image and Igor software packages. Quantification of light output was obtained and expressed in photons per second per square centimeter per steradian (photons/sec/cm2/sr).
In Vivo Studies
Mice bearing tumors (
ROIs were drawn around the heads of all animals for the in vivo experiments or around the relevant wells of the 24-well plates for the in vitro studies. Quantification of light output was obtained using the Living Image and Igor software, and expressed in photons per second per square centimeter per steradian. Region size was the same in all animals.
Magnetic Resonance Imaging
Magnetic resonance imaging (MRI) was performed using a Bruker 7T Pharmascan (Bruker BioSpin, Ettlingen, Germany). Mice were sedated with and maintained under 2% isoflurane for the duration of the scans. Scanning was done ∼15–20 min post iv injection of 100 μL gadopentate dimeglumine to allow for peak concentration in the brain tumor, as we have determined through past experience [14]. Scans were performed according to the following protocol: TR = 3076.5 msec, TE = 36.2 msec, and NEX = 4. The field of view was 2.6 cm, and the final voxel sizes were 0.100 × 0.200 × 0.670 mm slice thickness, with contiguous slices.
MRI of the mouse brains with tumors were visualized using the Bruker Pharmascan software, and largest tumor axial dimensions were measured using this software for comparison to bioluminescent signal intensity.
Euthanization and Histology
For euthanization and histologic preparation of mouse brains, animals were anesthetized with ketamine/xylazine (100 and 10 mg/kg, respectively), the thoracic cavity and chest exposed surgically, the right atrium cut open, and 10 mL of saline flushed immediately into the left ventricle followed by 10 mL of 10% buffered formalin. Brains were then removed, fixed in buffered formalin, and embedded in paraffin for hematoxylin and eosin staining.
Statistical Analysis
One-way analysis of variance (ANOVA) and Student's
Results
In Vitro Studies
Bioluminescent signal measured from plates with U87MG Rluc-expressing cells was highly reproducible. Signal from wells with the substrate ViviRen added was highest, with an average peak approximately 1 and 2 log units above that of coelenterazine and EnduRen, respectively (
Peak signal from coelenterazine wells was only 8% of the ViviRen peak, whereas peak signal from EnduRen-containing wells was 2% of ViviRen signal. Peak signal from the control wells with nontransduced U87MG cells and medium alone containing substrates was always less than 1% of peak ViviRen signal and below that of EnduRen and coelenterazine signal peaks.
As mentioned previously, one additional plate had 50 μL per well added rather than 20 μL per well. The relative results were identical to those above, except that in the two control wells with the substrate (ViviRen) added (with nontransduced U87MG and medium alone) the peak signal was 1.5–2 times greater than signal from the wells containing the substrate EnduRen and Rluc-expressing U87MG cells, demonstrating that ViviRen has relatively high autoluminescence in vitro to go along with its high true signal.
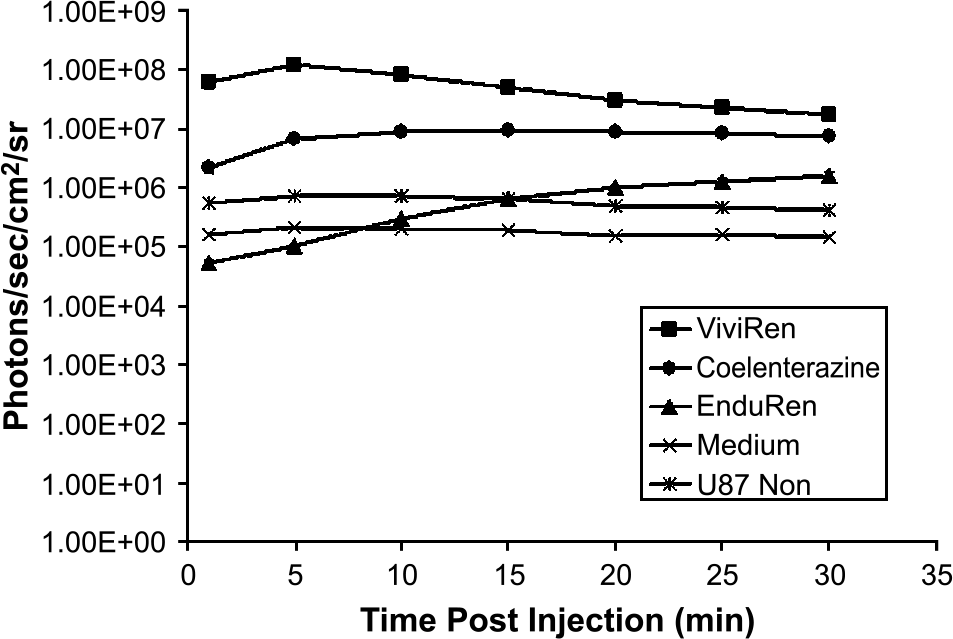
In vitro testing of native substrate and analogs on human glioblastoma cell line. Plated cells had the three different substrates added as listed. Wells with U87MG Rluc cells and ViviRen added demonstrated the highest signal after substrate addition. Control wells with medium alone and nontransduced U87MG cells had significantly lower signal than wells with transduced cells following administration of substrates, save for when the substrate ViviRen was added. In this case, the autoluminescence from ViviRen was brighter than the signal from EnduRen in Rluc-expressing cells. True ViviRen signal in Rluc-expressing cells was, however, much greater than this autoluminescent signal in control wells. All points represent means ± SD.
In Vivo Studies
To test for reproducibility of ip injections, one mouse was injected ip with ViviRen on successive days. Correlation of bioluminescent signal output was high at
As with ip injections, the highest peak signal in all mice was achieved following injection of the substrate ViviRen (
We tested for reproducibility of iv injections by injecting the same mouse with ViviRen iv on successive days as above for the ip injections. Reproducibility was also high, with a correlation of
To test if we could visualize small tumors (< 1 mm) with the substrates, we performed bioluminescent imaging on animals with small brain tumors as determined by MRI. Mice had tumors ranging in size from 0.6 to 0.9 mm (maximum diameter). Three mice were imaged following iv injections of the substrates. Intraperitoneal injections were not performed, as preliminary testing by ip injection of ViviRen demonstrated no signal from these small tumors. Intravenous injection with EnduRen did not enable detection of these small tumors, whereas with coelenterazine signal was approximately double that of background and that of EnduRen (
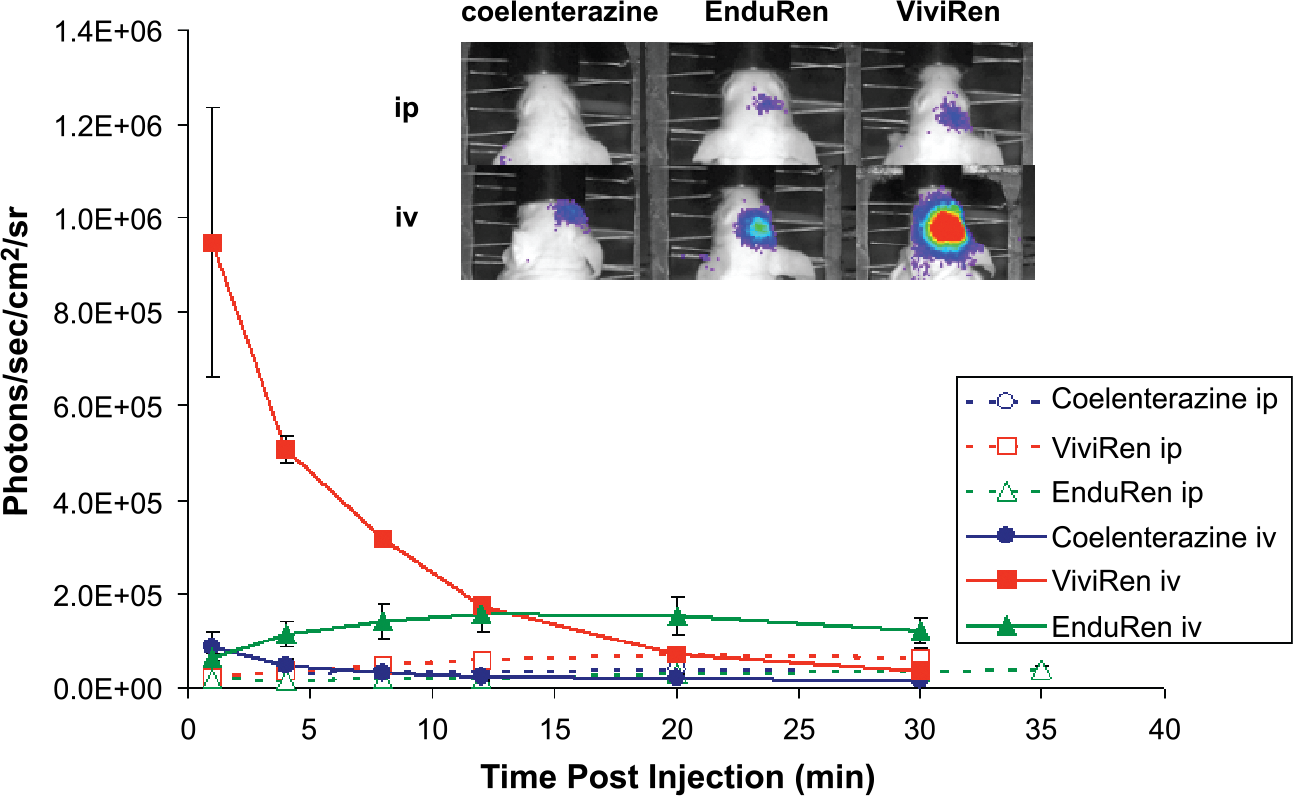
Comparison of ip and iv injections of coelenterazine and its analogs in mice bearing brain tumors. Signal from iv injections showed greater peak signal compared to ip injections. Bioluminescent images are of representative mouse following administration of each substrate by iv and ip method. Note that peak signals post iv injections were greater than peak signals from ip injections in all cases. Intravenous ViviRen-induced signal was much greater than signal with any other substrate regardless of injection method (iv or ip). Coelenterazine and EnduRen signals were not significantly different from each other for either iv or ip injections in mice with these larger (>1.0 mm) tumors. Images of representative mouse show peak signals obtained with each substrate by each injection method and demonstrate that signal from iv ViviRen was greatest. All points represent means ± SD.
We also tested whether bioluminescent signal increased over time as tumors grew. One additional mouse was imaged at Week 9 post tumor injection and then again at Week 10. MRI showed tumor size had increased from 2.0 to 2.4 mm in this time. Bioluminescent signal following iv administration of substrate increased as well (Figure 5). This was true for all three substrates.
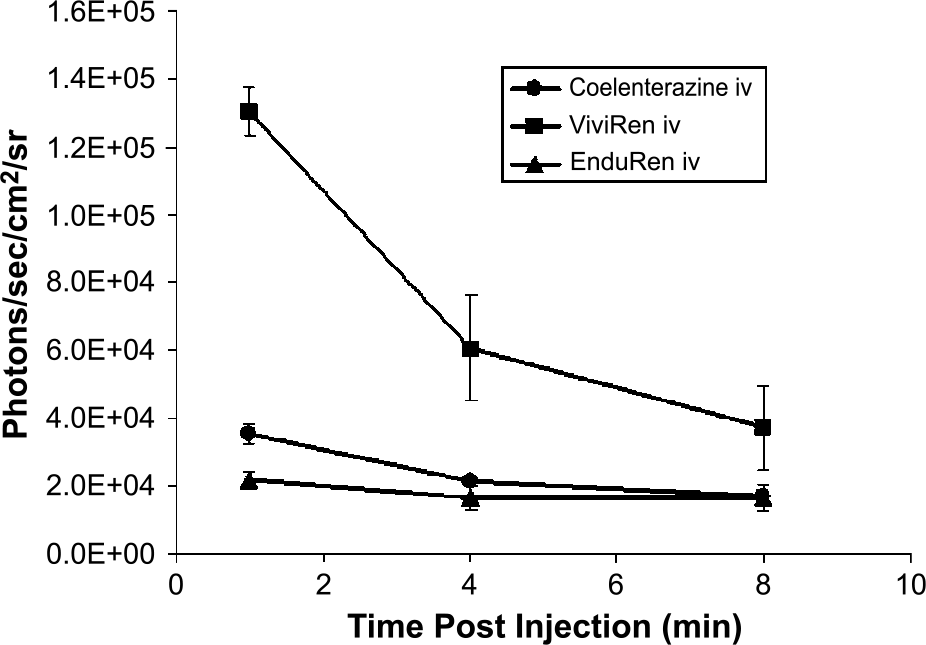
Comparison of bioluminescent signal in mice with small brain tumors. Graph shows mean (± SD) signal achieved in brains of three mice with tumors less than 1.0 mm in maximum diameter following iv administration of substrates. Peak signal post ViviRen injection was significantly (p< .05) highest in these small (<1.0 mm) tumors, as it was in larger tumors.
Tumor size versus bioluminescent signal resulting from administration of each substrate in all seven animals was also plotted. Tumor size as determined by MRI approached a significant correlation with bioluminescent signal from ViviRen (
Upon histologic examination, all tumors were found to be largely composed of healthy tumor cells, have well-delineated borders, and have limited areas of necrosis.
Discussion
In this study we found that bioluminescent signal emitted from tumor-bearing mice was greatest in all cases with the substrate ViviRen. This was true for both ip and iv injections. Signal from EnduRen was consistently equal to or lower than signal following coelenterazine administration. EnduRen signal took longer to peak than either other substrate-induced signal, both with ip and iv injections. The reasons for this latter point are unclear but may be due to less efficient cleavage of one of the additional subgroups added.
The shorter time to peak following iv administration is not surprising because administration in this manner means that a bolus of agent is directly introduced into the blood stream, and the diffusion processes that dominate the early phases of ip injection are avoided. With iv injections we noted high signal in the lungs of the mice in the first images acquired after substrate administration (and in ip injections we noted high signal in the abdominal area), presumably due to substrate autoluminescence. This autoluminescence was not insignificant, and although the two substrate analogs were created in part to have lower autoluminescence than the natural substrate in vivo, in our studies it appeared that each retained relatively high background levels in regions where substrate accumulated. In our brain tumor model this was not a problem, but in models necessitating high sensitivity in thoracic or abdominal regions this could cause difficulty in detecting true signal. It is important to note that the signal we detected in the brains of our mice was indeed true signal and not autoluminescence, as control mice injected with the substrates did not show significant brain signal at all.

Change in bioluminescent signal with tumor size change. Plots of bioluminescent signal following iv substrate administration in one mouse 9 weeks after brain tumor injection and repeated 1 week later (“wk 10”) to test if signal had increased along with size increase as measured by MRI. Bioluminescent and MRI images show brain tumor and signal at weeks 9 (a) and 10 (b). Although we observed signal increase with all substrates in this mouse from week 9 to week 10, only iv ViviRen and EnduRen signals approached a significant correlation with tumor size overall in our study.
It is thought that the luminescence due to autooxidation of coelenterazine is in part increased by the presence of albumin. In our studies, we limited the amount of albumin, used as a carrier to keep the substrate in solution, to 0.1% or lower. In this solution, all three substrates demonstrated similar amounts of autoluminescence. In future studies, the autoluminescence of substrate in various other solutions, such as PBS alone, should be tested.
We found good, although not quite statistically significant, correlation of bioluminescent light output with the substrates ViviRen and EnduRen to tumor size as determined by MRI. The significance of the ViviRen signal correlation to tumor size as measured on MR images became significant (
We did not attempt to optimize sensitivity of detection for any one substrate in this study. Our purpose here was to compare the substrate analogs to the native substrate at the same concentration and using the same imaging parameters. Longer image acquisition times, increased binning (combining) of pixels on the CCD camera, and higher doses of substrate could all lead to increased signal detection for a given number of luciferase-expressing cells. Reductions in dose of substrate could also be employed to save on imaging costs, as each substrate is relatively expensive. From the results here, it is reasonable to conclude that a lower dose of ViviRen relative to coelenterazine or EnduRen could be used in our model, and thus this expense could be reduced. Optimization of imaging parameters and substrate dosing should be taken into account for any individual animal model.
Following the in vitro studies we examined the cells in wells under a light microscope and did not find significant observable differences in cell viability as assessed by attachment and morphology. This lends support to Promega's own analyses on various cell lines that show no toxicity following natural substrate or analog administration. Studies of potential toxicity of these agents should be more thoroughly performed.
In this study we tested the two substrate analogs on one cell line, the human glioblastoma line U87MG. Our cells had been selected using zeocin resistance so that we were using cells that had near-100% expression of
This study did not attempt to specifically address the issue of diffusibility of the agents between cells of the body. Although it is known that the substrate for firefly luciferase, D-luciferin, readily passes through all cell membranes including the BBB, less is known about coelenterazine, although it is thought that it does not cross the BBB easily, if at all [3,7]. The altered size and charge distribution of the two analogs would almost certainly affect their diffusion capabilities, but this remains to be definitively tested. It is possible that the differences in bioluminescent signal observed in mice with small versus large tumors iv injected with the substrate EnduRen are due to differences in BBB permeability or degree of vascularization. We did not test for this.
There is an earlier report of different coelenterazine analogs evaluated in vivo [11]. In that study, it was found that a substrate analog, termed coelenterazine-e, produced three- to fourfold greater signal than the native substrate in vivo but also exhibited higher autoluminescence. They concluded that the native substrate would be better suited for animal studies. Although it is unclear what result this may have on their work, in that report the substrates were all administered using a 1 mg/kg body weight standard (the standard for coelenterazine, as mentioned); however, the molarity of the solutions containing the substrates is a more appropriate measure because the different molecular weights of the substrate analogs will mean that more (or fewer) molecules will be available depending on their molecular weight for a given milligram per kilogram.
In this previous report, the substrate analog coelenterazine-h was also tested in vitro in HeLa cells and in C6 cells and in vivo in livers of mice [11]. Although Rluc signal was relatively high in the cell studies, the in vivo liver results were less encouraging, with signal approximately one-fifth that of native coelenterazine; however, the above-mentioned caveat regarding molarity must be kept in mind. This result is still noteworthy because one of the intermediates formed in cells post intracellular passage of EnduRen and ViviRen is coelenterazine-h.
It is reasonable to suggest that the additional side groups added to form EnduRen and ViviRen have altered their intracellular transport capacities relative to coelenterazine-h. It is possible that the light emitted from the reaction with the substrate analogs is shifted in wavelength from the light emitted by the natural substrate, coelenterazine. We did not test for this. If the wavelength of the light were shifted to longer wavelengths than the peak with coelenterazine (∼480 nm), then the light would be less absorbed and more easily penetrate tissue, and this would confound the results [16]. Future studies should address this issue.
Footnotes
Acknowledgments
The authors acknowledge useful discussions with George McNamara, PhD (Childrens Hospital Los Angeles and the City of Hope, Duarte, CA) and Erika Hawkins, MS (Promega, Madison, WI).
This work was made possible through generous funding provided by the Guenther Foundation, the Wright Foundation (M.R.), and a collaboration award from the University of Southern California (NIH 5P20CA086352-03 award to Peter Conti, MD, PhD).