
Abstract
Hypoxia induces changes to cancer cells that make them more resistant to treatment. We have looked at signaling pathways that facilitate these changes by screening the human kinome for effects on hypoxic responses in SW480 colon cancer cells. Hits identified in the screen were examined for effects on multiple molecular responses to hypoxia, including the endoplasmic reticulum stress and DNA damage responses in colon, melanoma, and renal cancer lines. To validate the hits from the small interfering RNA studies, we developed cell lines expressing stable short hairpin RNAs (shRNAs) in the A498 renal carcinoma cell line. Several lines, including those expressing shRNAs against DYRK1B, GAK, IHPK2, IRAK4, and MATK, showed an inability to form spheroid cultures. In addition, shRNAs targeting IRAK4 and GAK were incapable of 2D growth under anoxia. In the GAK shRNA-expressing line, nuclear factor–κB (NF-κB) was localized to the nucleus, but in the IRAK4 shRNA line, NF-κB levels were increased but the extent of nuclear localization was unchanged. Dominant negative mutants of IRAK4 and GAK also showed strong apoptotic effects in A498 cells under anoxia, supporting a direct link between these kinases and survival of the VHL−/− RCC line, which is typically highly resistant to hypoxic stress as a result of high and constitutive levels of Hif-1α.
Introduction
Although characterized as a disease of unchecked cellular growth, cancer is much more complex. 1 A solid tumor can be divided into regions based on cellular composition, environmental factors (pH, interstitial pressure), and growth rate.2,3 The surface regions of a tumor, and those parts that are well vascularized, are capable of net growth. However, many regions of the tumor are highly acidic and hypoxic, which results in significant stress to the tumor cells. 4 Cancer cells in this region of a tumor can grow slowly, with no net growth for long periods of time. 5 The inner core of a solid tumor is typically a necrotic region with fewer viable cells and is associated with the release of proinflammatory cytokines and related factors, such as HMGB1 and S100P. 6 Targeting tumor growth through antiproliferative therapies, such as mitotic poisons, is effective in reducing growth of dividing cells but less effective on quiescent cells. In many cases, therapies developed against cancer cells cultured for high proliferation rates are effective in vitro and in preclinical in vivo models but achieve only modest clinical results. 7
Understanding the effects of hypoxia on cancer cells is essential to appreciating the discordance between the efficacy of therapeutics that target cancer cell proliferation in vitro and their effects on tumor growth. 8 Hypoxic regions of a tumor are capable of de-differentiating the resident cancer cells, facilitating their adaptation to invasive growth and metastatic colonization.2,9,10 In this regard, the hypoxic region of a tumor bears some similarities to stem cell niches, and cells in the hypoxic region of a tumor bear properties of stem cell–like tumor-initiating cells. 11 Thus, the hypoxic region of a tumor represents a critical link in the generation and maintenance of primary and secondary tumors.
Therapeutics that target the hypoxic regions of a tumor are an important alternative to those that target proliferating cancer cells. We have begun this search by screening for kinase genes that affect hypoxic colon cancer cells and characterized several hits in multiple cell models for effects on cell survival and signaling through pathways. To expand the range of targets considered potential therapeutic targets against growth and survival of hypoxic cells, we have initiated a screening paradigm independent of classical or hallmark signaling pathways of tumor hypoxia, particularly focus on the regulation of Hif-1α, and adopt a strategy independent of any specific molecular end point and that is instead based on the growth and morphology of cancer cells in hypoxia as general measures of hypoxia survival mechanisms.
Materials and Methods
Cell Culture
Cancer cell lines—the colon carcinoma cell line SW480, the renal carcinoma cell line A498, and the melanoma cell line A375—were obtained from the ATCC (Manassas, VA) and grown in Dulbecco’s modified Eagle’s medium (DMEM)/10% fetal bovine serum (FBS)/1× nonessential amino acids. Cell culture reagents, including media, serum, nonessential amino acids, and puromycin, were obtained from Gibco/Invitrogen (Carlsbad, CA).
Transfection Protocol
Cells were transfected using a “reverse transfection” protocol, where small interfering RNAs (siRNAs) and lipid carriers were plated and allowed to form transfection complexes prior to the addition of cells, as described previously. 12
Plate Design/Control siRNAs
The Qiagen Druggable Genome siRNA set V2.0, including regulatory subunits and non–protein kinase genes, was arrayed randomly onto 96-well microplates. Four distinct siRNAs were synthesized for each gene by Qiagen (Valencia, CA). For screening, the siRNAs were plated into a 384-well format. A panel of negative control siRNAs, which do not target any human gene, was used for plate normalization during the screen. siRNAs against PLK1 were used on every plate (in addition to its inclusion in the kinome screening siRNAs) as a positive control for transfection and cell culture; sharply reduced cell (nuclei) numbers in these wells were indicative of successful transfection for that plate. siRNAs were arrayed in the inner wells of the 96-well plates; rearraying into 384-well plates meant that the outer two wells were left empty.
Analysis of Cell Growth and Responses to Anoxia
In the primary screen, cells were plated at 5000 cells per well in clear-bottom 384-well plates (Packard/PerkinElmer, Waltham, MA). Forty-eight hours after transfection, replicate plates were divided into a normoxia set and an anoxia set. The anoxia set was incubated in a sealed tissue culture hood/incubator (Ruskin INVIVO2, Bridgend, UK) maintained at 0.1% to 0.3% O2, 5% relative humidity, and 37 °C for 48 h. The normoxia set was cultured in the initial culture incubator at ambient O2 during this period. Cells were fixed with freshly prepared 2% paraformaldehyde (Alfa Aesar, Ward Hill, MA) in phosphate-buffered saline (PBS) without altering O2 levels until after cells were fixed.
Normalization, Data Reduction, and Hit Selection in the Primary Screen
Assay plates were imaged and analyzed using a Cellomics ArrayScan Vti instrument and software (Thermo Scientific, Billerica, MA). All feature readouts were log (base 2) transformed and then normalized to same-plate scrambled control siRNA readouts by subtracting the median same-plate scrambled-control readout. Data were initially analyzed by z score for the mean of technical triplicates for individual siRNAs when the response to anoxia was compared with normoxia and by t statistics and unadjusted p-values for individual siRNAs when compared by anoxia versus normoxia for plate-normalized and log2-transformed data. These assessments were repeated by gene level, where the technical triplicates and individual siRNAs per gene (4) were pooled. These methods were applied to each of the three candidate phenotypic end points: growth rate as measured by nuclei counts, increased nuclear area, and decreased nuclear area. Following these analyses, the final list of genes to be analyzed was determined from the unadjusted p-values for siRNAs for plate-normalized and log2-transformed siRNA comparisons, where two or more siRNAs were each shown to have unadjusted p-values of less than 0.05.
HCS of Cell Stress and Cell Death Pathways in the Secondary Assays
Cells were plated in 384-well clear-bottom plates and allowed to grow for antibodies against XBP1(s), phospho-S6235-236, phosphorylated histone H2Ax, and cleaved poly (ADP-ribose) polymerase (PARP), obtained from Cell Signaling Technologies (Beverly, MA), and XBP1(s) from Santa Cruz Biotechnology (Santa Cruz, CA). Secondary antibodies were labeled with Alexa dyes (488, 594, and 647 wavelengths) from Invitrogen. Dilutions were optimized for each primary/secondary pair prior to use in assays.
Derivation of Cell Lines Expressing shRNAs in the A498 Background
Short hairpin RNA (shRNA) sequences corresponding to the siRNAs shown to be effective were cloned in the pGIPZ-shRNA vector (Open Biosystems; Thermo Fisher Scientific, Waltham, MA). The constructs were transduced into A498 cells and placed under selection for puromycin resistance at a concentration of 4 µg/mL for 1 week. Following selection, expression of target gene levels was assessed by reverse transcriptase PCR (RT-PCR) using commercially available reagents (Taqman; Applied Biosystems, Foster City, CA). Only cell lines showing a reduction in target gene expression of more than 40% and normal growth kinetics were considered further. These cell lines are described in the Results section.
Derivation, Transduction, and Selection of Dominant Negative Mutants of GAK and IRAK4 in A498 Cells
Complementary DNAs (cDNAs) corresponding to the GAK and IRAK4 genes were synthesized de novo. In addition, mutant forms encoding kinase inactive versions (GAKK69A, D173A and IRAK4K213M, K214M) were synthesized in parallel. These genes were cloned into pTRIPZ, a tetracycline-inducible lentiviral vector (Open Biosystems; Thermo Fisher Scientific). Lentiviral particles prepared as described by the manufacturer were used to transduce the A498 cell line. Transductants were selected at 2 µg/mL and maintained at 0.5 µg/mL of puromycin.
Results
High-Throughput Screen for Genes That Exacerbate Hypoxic Stress in Colon Cancer Cells
All cells respond to hypoxia by reducing growth rates and inducing adaptive structural changes. Responses to hypoxia include increases in the level of the Hif-1α, nuclear factor–κB (NF-κB), and Myc transcription factors; an increase in glycolytic metabolism 13 ; a reduction in growth rate; and the acquisition of chemoresistance. 4 Some of these changes are the result of explicit changes in gene expression or signaling pathways, whereas others are cellular in nature, for example, where changes result from a reduction in growth rate. In developing a screen for genes that affect how cancer cells adapt to hypoxic stress, we were interested in defining an assay that captured a general response to hypoxia, rather than a specific molecular pathway. To identify new pathways that contribute to the adaptation of cancer cells to hypoxia, we sought a general response to hypoxia that was strongly associated with hypoxia.
One common change observed in cells grown under hypoxia is a significantly altered morphology, including enlarged nuclei. Since the cytological changes result from metabolic, signaling, and proliferative changes, it is a general measure of how the cells are responding to hypoxia. Changes in nuclear morphology can be readily observed using fluorescent dyes for chromatin, such as DAPI. As examples, nuclei from SW480 colon carcinoma cells grown under normoxia and hypoxia are shown in Figure 1A , B , respectively. From these images, several changes can be noted. Reduced growth rate under hypoxia can be observed as fewer nuclei. Therefore, growth rate under hypoxia, and as affected by siRNAs, can be quantified. In addition, the morphological changes noted above can also be quantified. As such, by monitoring nuclei counts and morphology, several discrete effects of hypoxia can be analyzed in an RNA interference (RNAi) screen. Accurate measurements of cells by automated fluorescence microscopy and image analysis are readily achieved through high-content screening.14–16
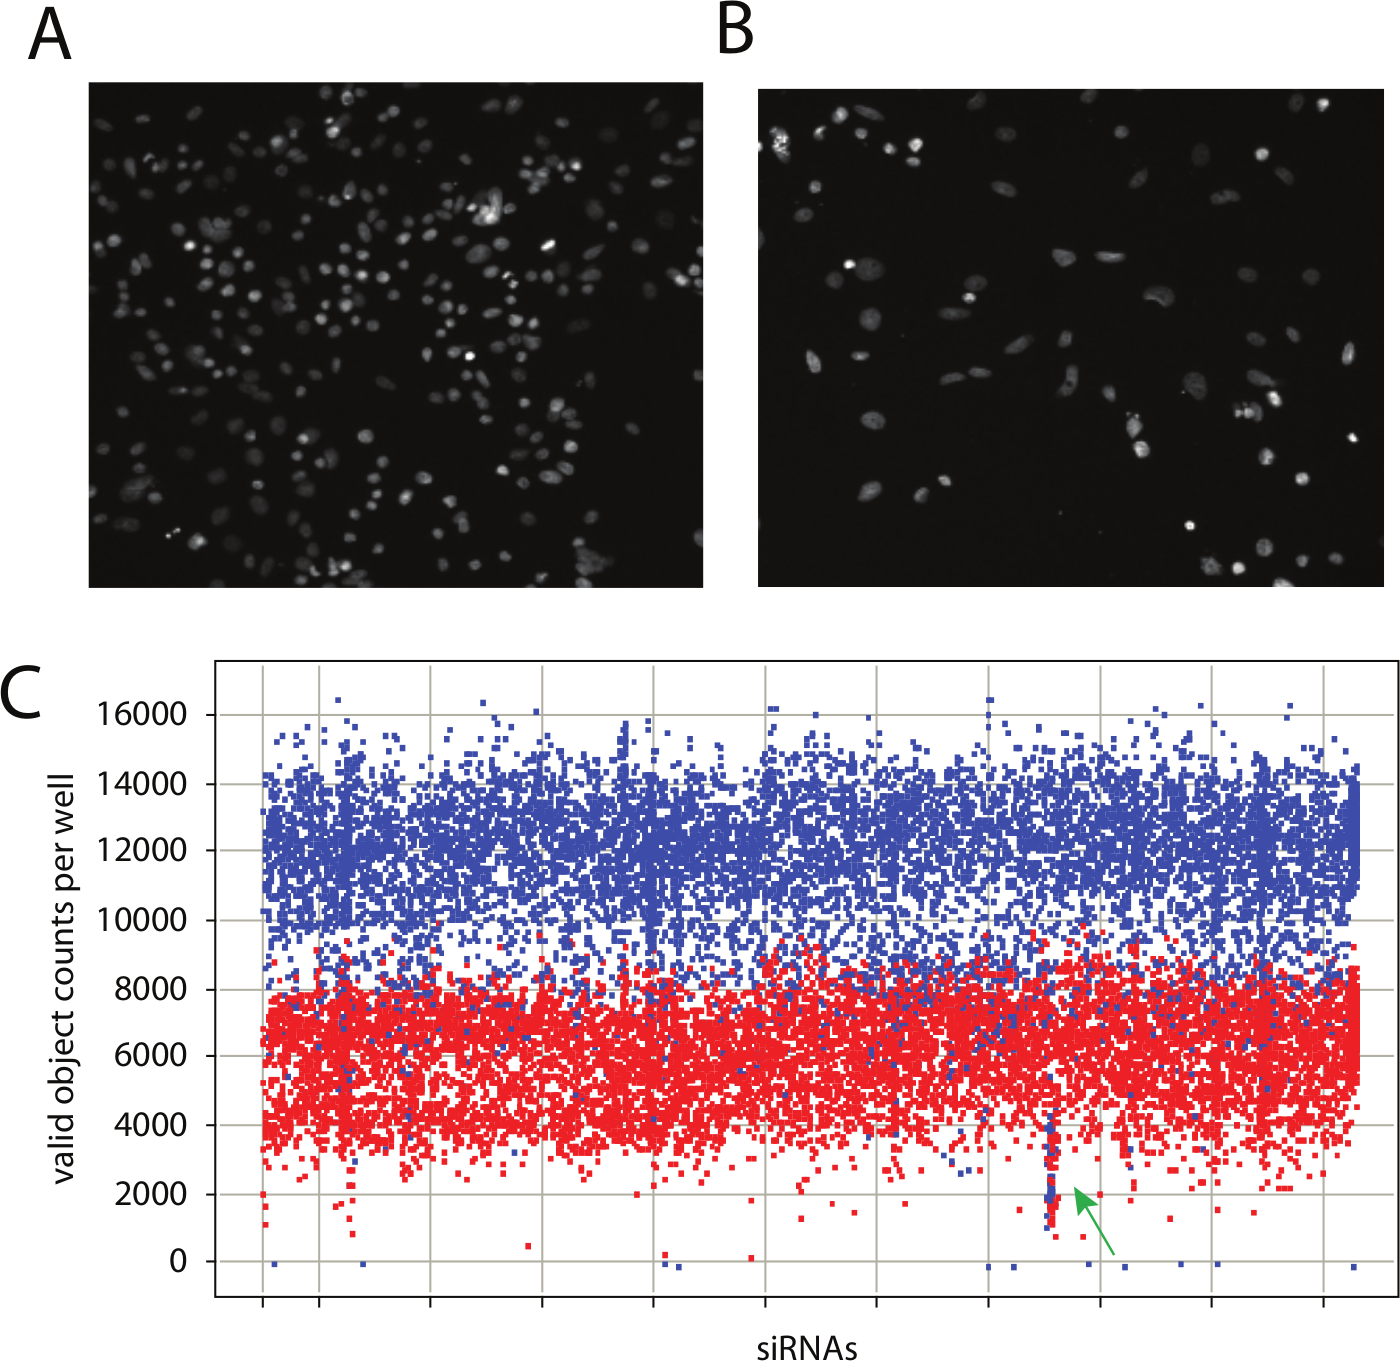
A kinome-wide small interfering RNA (siRNA) screen for genes that affect growth of SW480 colon carcinoma cells under anoxia. (
Our library comprised four individual siRNA duplexes against kinase-related genes. The SW480 cell line was chosen for the screen for both biological and technical reasons. Biologically, colon cancer is one of several types sensitive to hypoxia. Specifically, the progression to advanced and metastatic colon cancer is exacerbated by hypoxia, and hypoxia triggers a robust angiogenic program. On a technical level, SW480 cells are quite robust under the conditions required for an RNAi screen, specifically transfection and automated plating. Cells were transfected with each siRNA in the library 3 times, so each siRNA was screened 3 times and each gene was screened 12 times. Images were collected for ~80% of the area for each well. The total number of cells (nuclei) per area covered for each well and measurements of their size and shape were collected.14,15 Data were plate-normalized and scored for each siRNA as relative to nontargeting control siRNAs. The per-well nuclei totals for each siRNA in each of the three runs are shown in Figure 1C . The initial challenge was to reduce the data set and determine significant hits from the screen.
Hits were selected from each of three hit categories: (1) hypoxia-specific growth reduction following transfection with a specific siRNA, (2) siRNA-dependent increase in nuclear area of the nuclei grown under anoxia relative to transfected cells grown under normoxia, or (3) an siRNA and anoxic-dependent decrease in nuclear area. Hits were selected from the list of genes in which the unadjusted p-values were less than 0.05. Although more permissive than the alternate method, the focus on exploring the benefit of using a phenotypic end point to identify novel signaling pathways was of prime importance, and so the hits were selected to provide a balance of candidates for each of the three end points, with the result of the screen being the relevance of any or all of these end points as being informative for studies on stress adaptation in cancer cells. In general, significance for both valid object counts (VOC) and object area (OA) was considered to increase the priority for that gene in the follow-up analysis. The hits from the screen are listed in Table 1 , along with the criteria that were used to select them. The study of these genes presents an opportunity to evaluate each of the end points we considered, and on the basis of the findings from follow-on studies, we have the option of reviewing the hits from a specific end point in a subsequent study, if it can be demonstrated that the end point is strongly linked to adaptation to the hypoxic condition.
Selection of Hits and Criteria for Inclusion in Follow-up Studies.
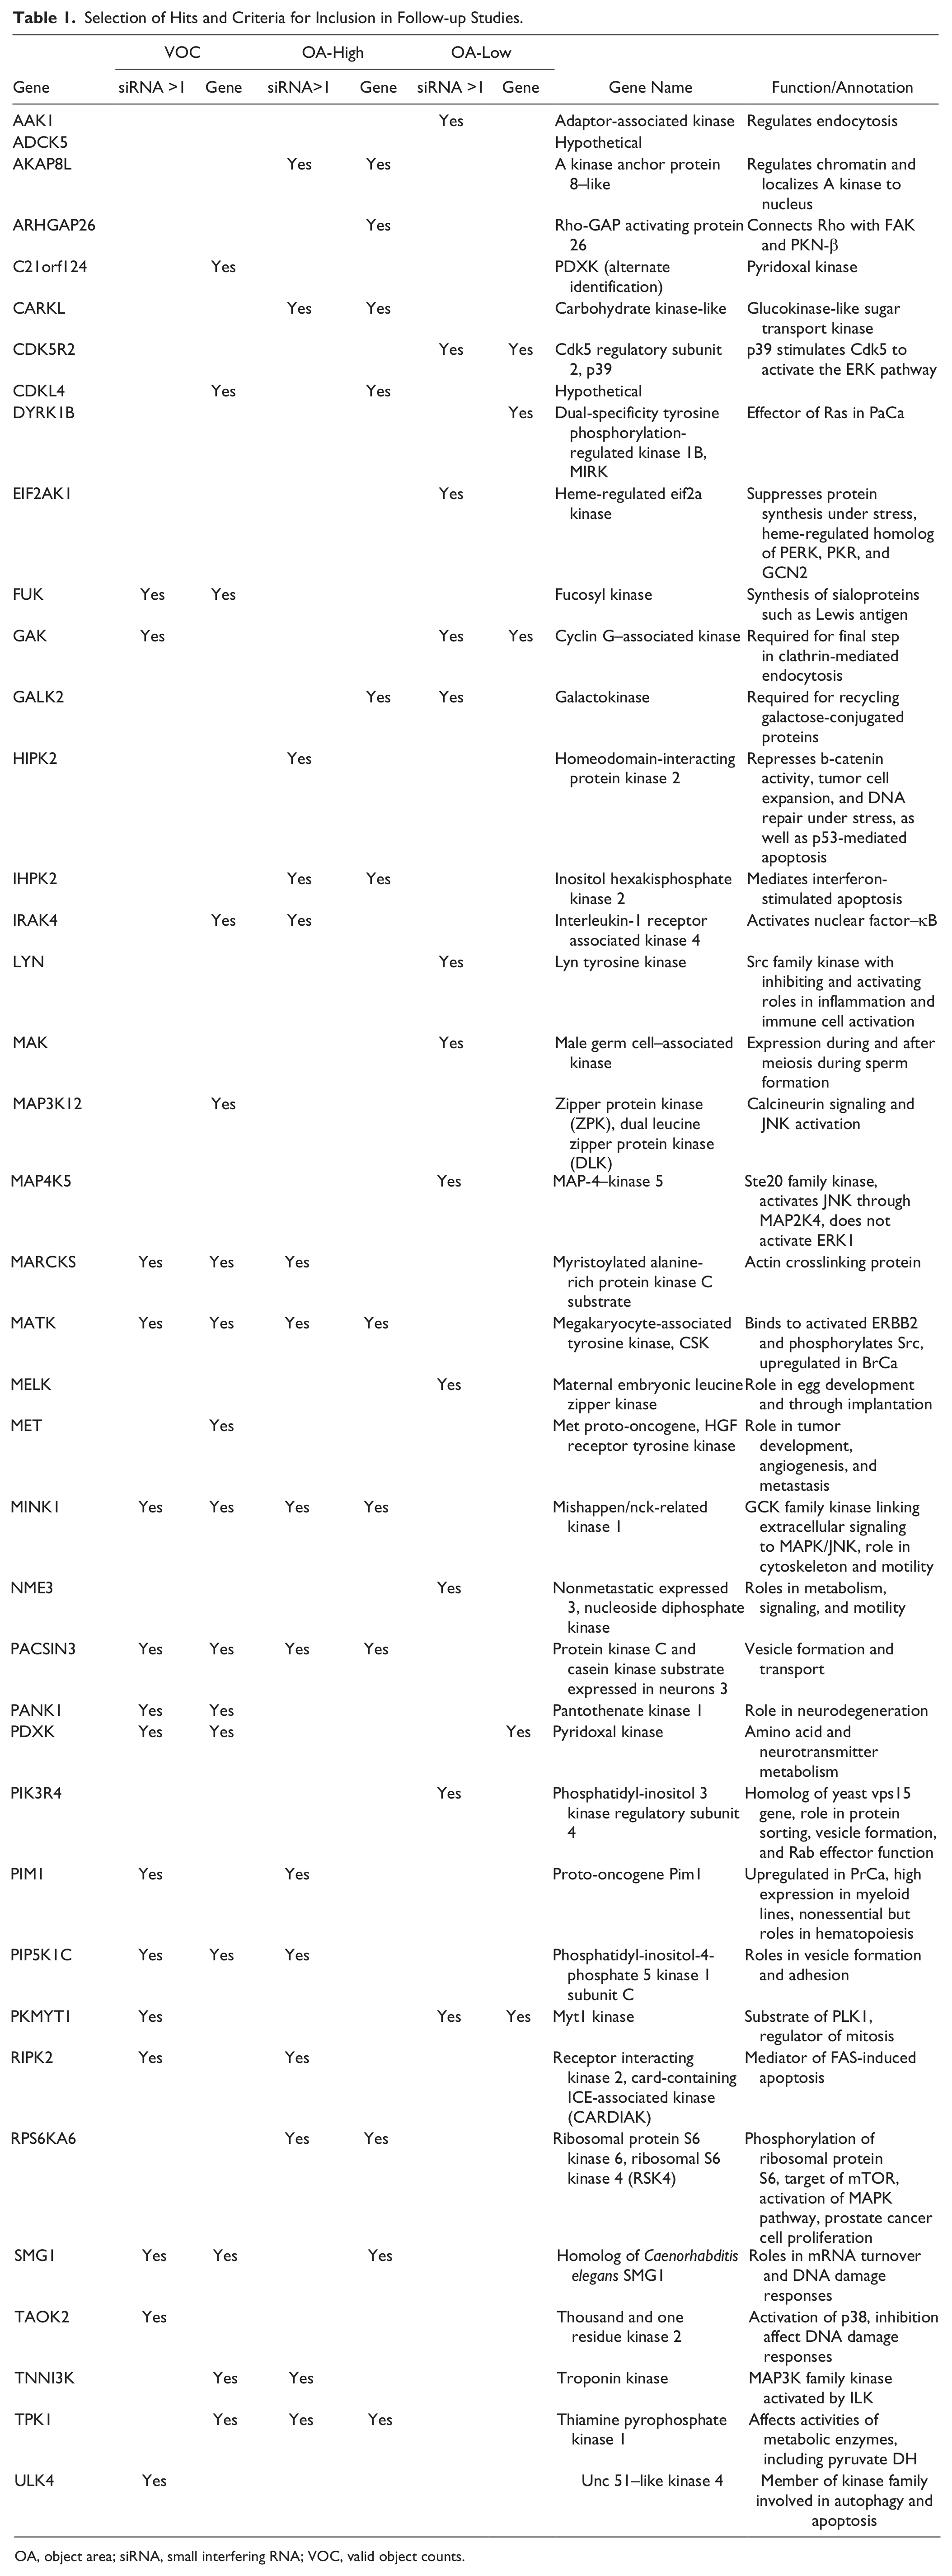
OA, object area; siRNA, small interfering RNA; VOC, valid object counts.
Effect of siRNAs on Critical Cell Survival Pathways
To better understand how the genes identified in the screening affect growth of cancer cells under anoxic stress, we examined the effect of siRNAs targeting the genes listed in Table 1 on several important cell signaling and survival pathways. For these studies, a new plate of siRNAs was created. In an effort to identify common adaptations to hypoxia by solid tumors, we expanded our studies by examining the roles of these genes in two additional cell lines from tumor types that have well-defined responses to hypoxia: the renal carcinoma line A498, which is VHL–/– and constitutively expresses high levels of Hif1α, and A375, a melanoma cell line.
In addition to growth and morphological features, we examined the effect of the hypoxia survival genes on four pathways that have been identified as important to cancer cell survival under stress. These are γ-phospho-H2AX, which is phosphorylated following the activation of the DNA damage response; XBP1(s), an apoptotic transcription factor expressed through the endoplasmic reticulum stress-dependent kinase IRE1, which activates an alternative splicing mechanism; phospho-ribosomal S6 protein, which is phosphorylated at residues S235 and S236 by p70S5K and p90RSK and is linked to a cell survival response; and the cleaved form of PARP, which results from the activation of apoptotic caspases. The mechanism for making these measurements was to develop a profile that assessed these signaling events and changes in a nuclear phenotype based on the quantification and enumeration of altered features for these cells. These features were scored for cells grown under normoxia and anoxia following treatment with each siRNA.
Since dozens of features are captured in high-content screening, it is necessary to reduce the available data into a set of features that meaningfully capture the influences of these siRNAs on cellular functions. Ultimately, the composite features need to be balanced in a meaningful way. For example, changes in nuclear shape can be registered in both the perimeter-to-area ratio (P2A, a measure of how circular the nucleus is) and in the length-to-width ratio (LWR, a measure of how elliptical the nucleus is). A uniformly larger nucleus will register a change in P2A (because length and area do not increase proportionally) but not in LWR. A misshapen nucleus will register changes in both. An aggregate score for nuclear morphology will register a larger change if both of these features are changed.
siRNAs were tested in quadruplicate for both anoxia and normoxia and the results compared. An example of the siRNA/cell line feature analysis is shown in Figure 2A . In this example, four siRNAs against CDK4L were transfected into the melanoma cell line A375. The effect on nuclear area was compared after normalization, and siRNAs showing statistically significant effects were determined from the p-value of the differences between the normoxic and anoxic conditions. Three of the four siRNAs had a statistically significant effect. The fourth, Hs_CDKL4_1, despite showing a similar trend, did not achieve statistical significance. This was repeated for all siRNAs and cell lines. The results are presented graphically in Figure 2B , C . Figure 2B shows how the feature hits segregated among the three cell lines. The renal cell line A498 showed the greatest sensitivity overall, although each line shows some specific sensitivities, particularly the effects of NME3, TPK1, and ULK4 on SW480 and MELK on A375. Such an analysis could form the basis of specific therapeutic strategies. On the other hand, GAK shows effects in all three lines, supporting the idea that it could be a more general anticancer target. Figure 2C shows the effect of the siRNAs for each feature class across all three lines. Nineteen features were compared for each cell line, three for each of the end points except for nuclear morphology, where four independent features were used. An end point was considered a hit if at least three of the siRNAs showed statistically significant effects. Each end point was scaled to weight each feature and cell line equally, so an siRNA that hit each (of at least three) siRNAs in all the features in all three lines would get a score of 1 for that end point.
Effect of small interfering RNAs (siRNAs) selected from the kinome screen on stress responses under anoxia. (
Effect of Long-Term Knockdown of Candidate Hypoxia Survival Genes on Growth of Spheroid Cultures and under Hypoxic Growth
The next step in validating the hits identified in the siRNA screen was to determine whether targeting the genes using shRNAs affects the growth and/or morphology of the cells under hypoxia, such as effects on the formation of spheroids. 17 Spheroids are multicellular aggregates of tumor or tumor and stromal cells that become limited for oxygen once they start to form. 18 The reduction in oxygen is associated with an increase in Hif1α levels in cells that regulate its levels and a shift to a highly glycolytic metabolism. We generated cell lines that expressed stable shRNAs that targeted several of the genes we had characterized by siRNAs above. These were derived in the A498 background, which has been shown to form spheroids efficiently. 19 All of the genes under study were converted to shRNAs, and the shRNA sequences were based on siRNA sequences that had been effective in the experiments up to this point. Cell lines expressing the shRNAs were characterized by RT-PCR. Lines that showed reduced expression of the target gene (40% or less of the expression for the target gene compared with a cell line transduced with a control vector) and normal growth characteristics were selected for functional studies. Of the cell lines initiated, lines with reduced expression of the targeted gene were obtained for DYRK1B, GAK, HIPK2, IHPK2, IRAK4, MAP3K12, MATK, and PDXK. In most of the other cases, transduced lines did not show a knockdown in target gene expression and could not be evaluated. In the case of PANK1, puromycin-resistant cell lines could not be obtained despite repeated attempts. For those lines that could be obtained and for which a reduction of target mRNA could be observed, growth rates and general morphology were measured and shown to be normal during growth in normoxia.
Spheroid growth was observed for the cell lines over a period of 1 week. Cultures were examined by phase contrast microscopy, and spheroid growth was determined for each cell line; examples are shown in Figure 3 . The control line, transduced with the lentiviral vector used for the RNAi constructs, shows both normal growth in 2D (as can be seen for the cells attached to the culture well) and a capacity to form spheroids. Some lines, such as those expressing shRNAs to GAK, MATK, and IHPK2, showed a mixture of normal and abnormal spheroids, whereas others, such as DYRK1B, IRAK4, and HIPK2, showed a poor capacity to form normal spheroids.
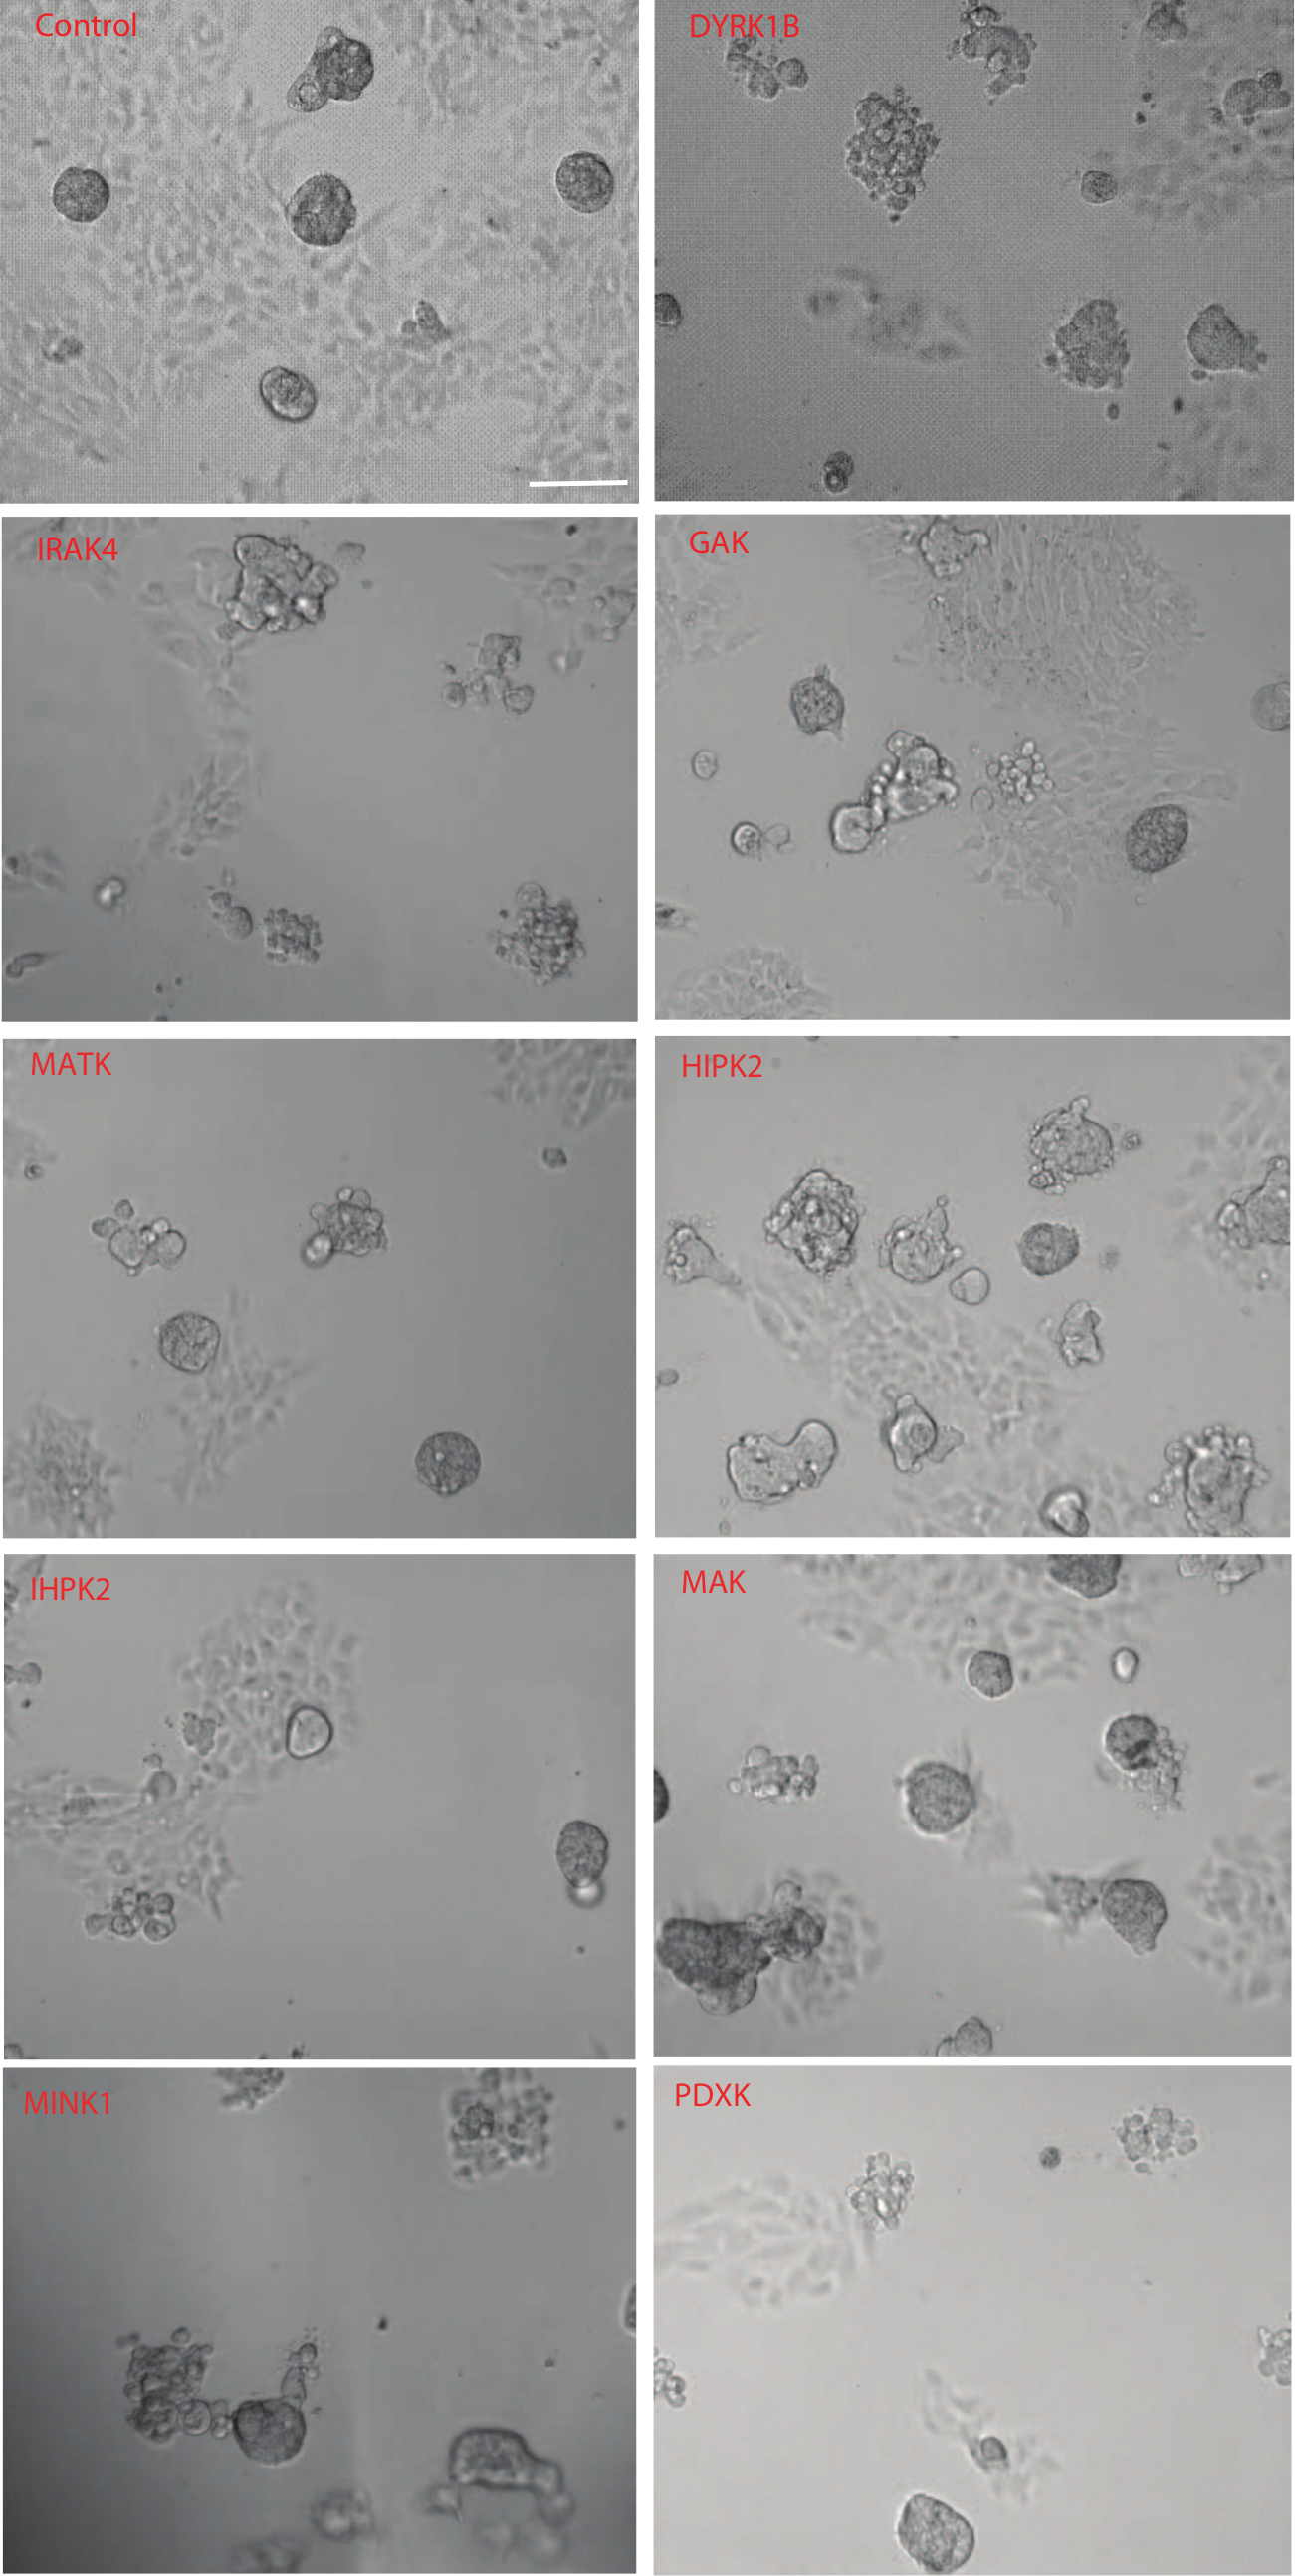
Effect of constitutive expression of short hairpin RNAs (shRNAs) against target genes on the growth of spheroids of A498 renal carcinoma cells. Growth of the cells following 7 days in culture are shown for each shRNA-expressing line by phase contrast microscopy. Cell lines studied are indicated in the figure.
To further characterize these lines, we examined their 2D growth under normoxia and anoxia. Growth was measured as nuclei counts per well following fixation, staining, and scanning of microplates. Apoptosis was measured at the same time by quantifying the amount of cleaved PARP per cell for each well. Finally, nuclei size was scored in the cells as they were identified for the overall growth rates. The data are shown in Figure 4 . In Figure 4A , the growth rates of each cell line for normoxic and hypoxic growth are shown. Most cell lines show robust growth in normoxia (shown in blue bars) and lesser growth in anoxia (shown in red bars), with the exception of GAK and IRAK4 shRNA-expressing lines, which show dramatically lower cell counts under anoxia. In addition, higher levels of cleaved, activated PARP are observed for these lines when grown under anoxia ( Figure 4B ), indicating that the means of cell death is through an apoptotic response to anoxia in the absence of either GAK or IRAK4.
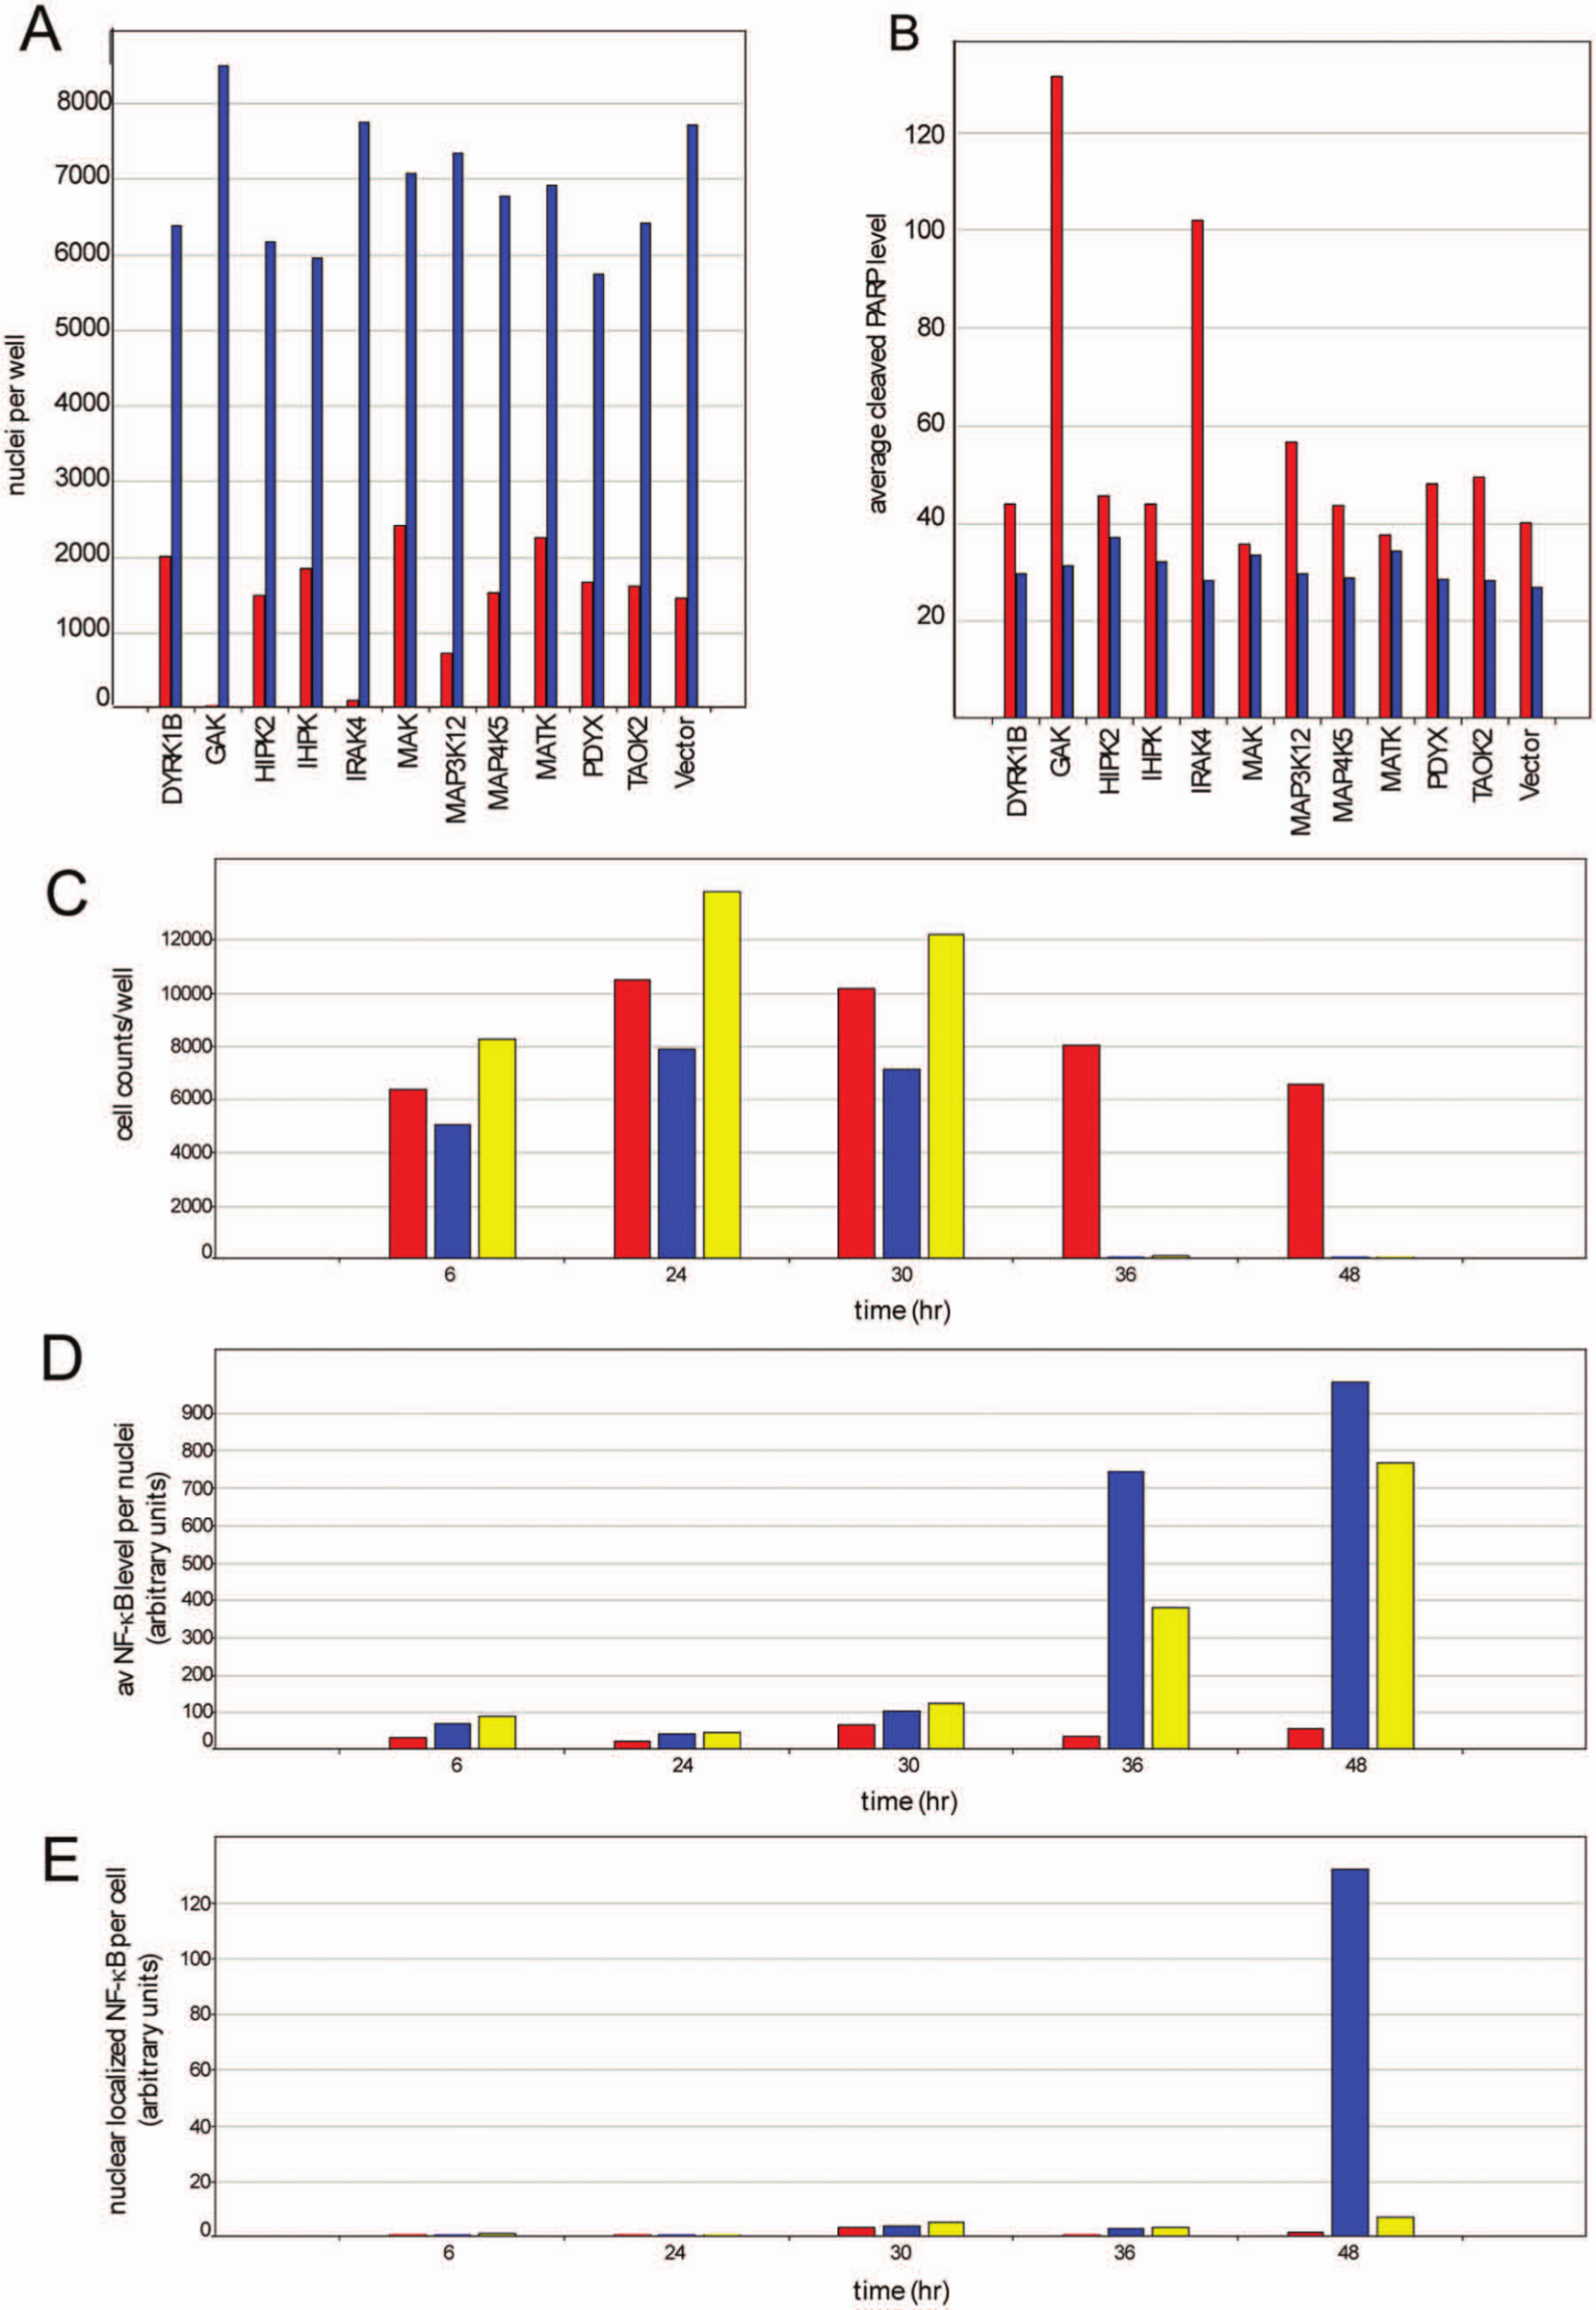
Effect of short hairpin RNA (shRNA) expression of candidate genes on survival of the renal carcinoma cell line A498 under hypoxia. A498 cells stably transduced with lentiviral vectors expressing shRNAs to the indicated genes were grown under normoxia for 2 days. At that time, one set of cultures was transferred to hypoxic growth conditions while the control set was cultured under normoxia. Growth of the cultures is measured as total cell counts (
IRAK4 is known to regulate NF-κB activity, an important component of the tumor survival response.
20
An effect of IRAK4 knockdown on cancer cell survival could be through aberrant regulation of NF-κB. As such, we decided to look at the effect of hypoxia and knockdown of both GAK and IRAK4 on NF-κB expression and localization. Initially, we looked at NF-κB expression and localization in the GAK and IRAK4 shRNA cell lines. Data are presented in
Figure 4C
–
E
. As seen in the previous figure, cell lines expressing either shRNA are very sensitive to anoxia (
Fig. 4C
). The effect on NF-κB is pronounced but complex. Both of these cell lines show higher levels of nuclear NF-κB (
Fig. 4D
), but the IRAK4 shRNA line achieves this through increasing the overall levels of NF-κB, and hence there is no change in the ratio of nuclear to cytoplasmic protein (
Fig. 4E
). In contrast, the cell line expressing the GAK shRNA has minimal effects on the overall expression of NF-κB, but the protein is almost exclusively localized to the nucleus. Since this was a significant difference between the effect of these two shRNAs on NF-κB, we examined the images directly to verify that the results of the image analysis were obvious. Representative images are shown in
Expression of Dominant-Negative Mutants of IRAK4 and GAK in A498 Renal Carcinoma Cells
To extend the observations made using RNAi, we examined the properties of cells that had been transduced with kinase-inactivated mutants of GAK and IRAK4. The cDNA for wild-type and kinase-inactivated forms (GAKK67A,D173A and IRAK4K213M, K214M) were expressed in a doxycycline-dependent manner from lentiviral vectors following transduction and selection for stable lines. Maintaining repression of the kinase genes was done to avoid the potential for antiproliferative effects from expression of the exogenous versions, which could either interfere with the establishment of the line or provoke adaptations to such expression that could subsequently affect the interpretation of the experiment.
Following 48-h of induction of the kinase genes under normoxia, samples were divided between normoxia and anoxia. Data are shown in Figure 5 . Growth of the control line, where the empty vector was introduced, recapitulates previous data showing a significant reduction when cells are grown under limiting oxygen. The IRAK4 and GAK kinase lines, both wild-type and dominant negative versions, are able to grow under normoxia. When grown under anoxia, lines expressing the IRAK4 kinases show severe loss of viability; viable cell counts plunge from approximately 10,000 cells per well to a few hundred. This effect is observed in both the wild-type and mutant IRAK4 lines. In the case of the wild-type GAK, a loss of viability is also observed, much more than is seen for the vector control, but they are able to remain at moderate levels during the time course of this experiment. For the dominant negative version of GAK, the loss of viability is more severe; cell survival is similar to that seen for the IRAK4 lines. The level of nuclear localization of NF-κB in the IRAK4-dominant negative line shows a trend toward increased levels when the line is exposed to anoxia. In the case of the GAK-dominant negative line, the extent of NF-κB localization increases steadily during the course of the experiment, as observed in the GAK shRNA experiments.
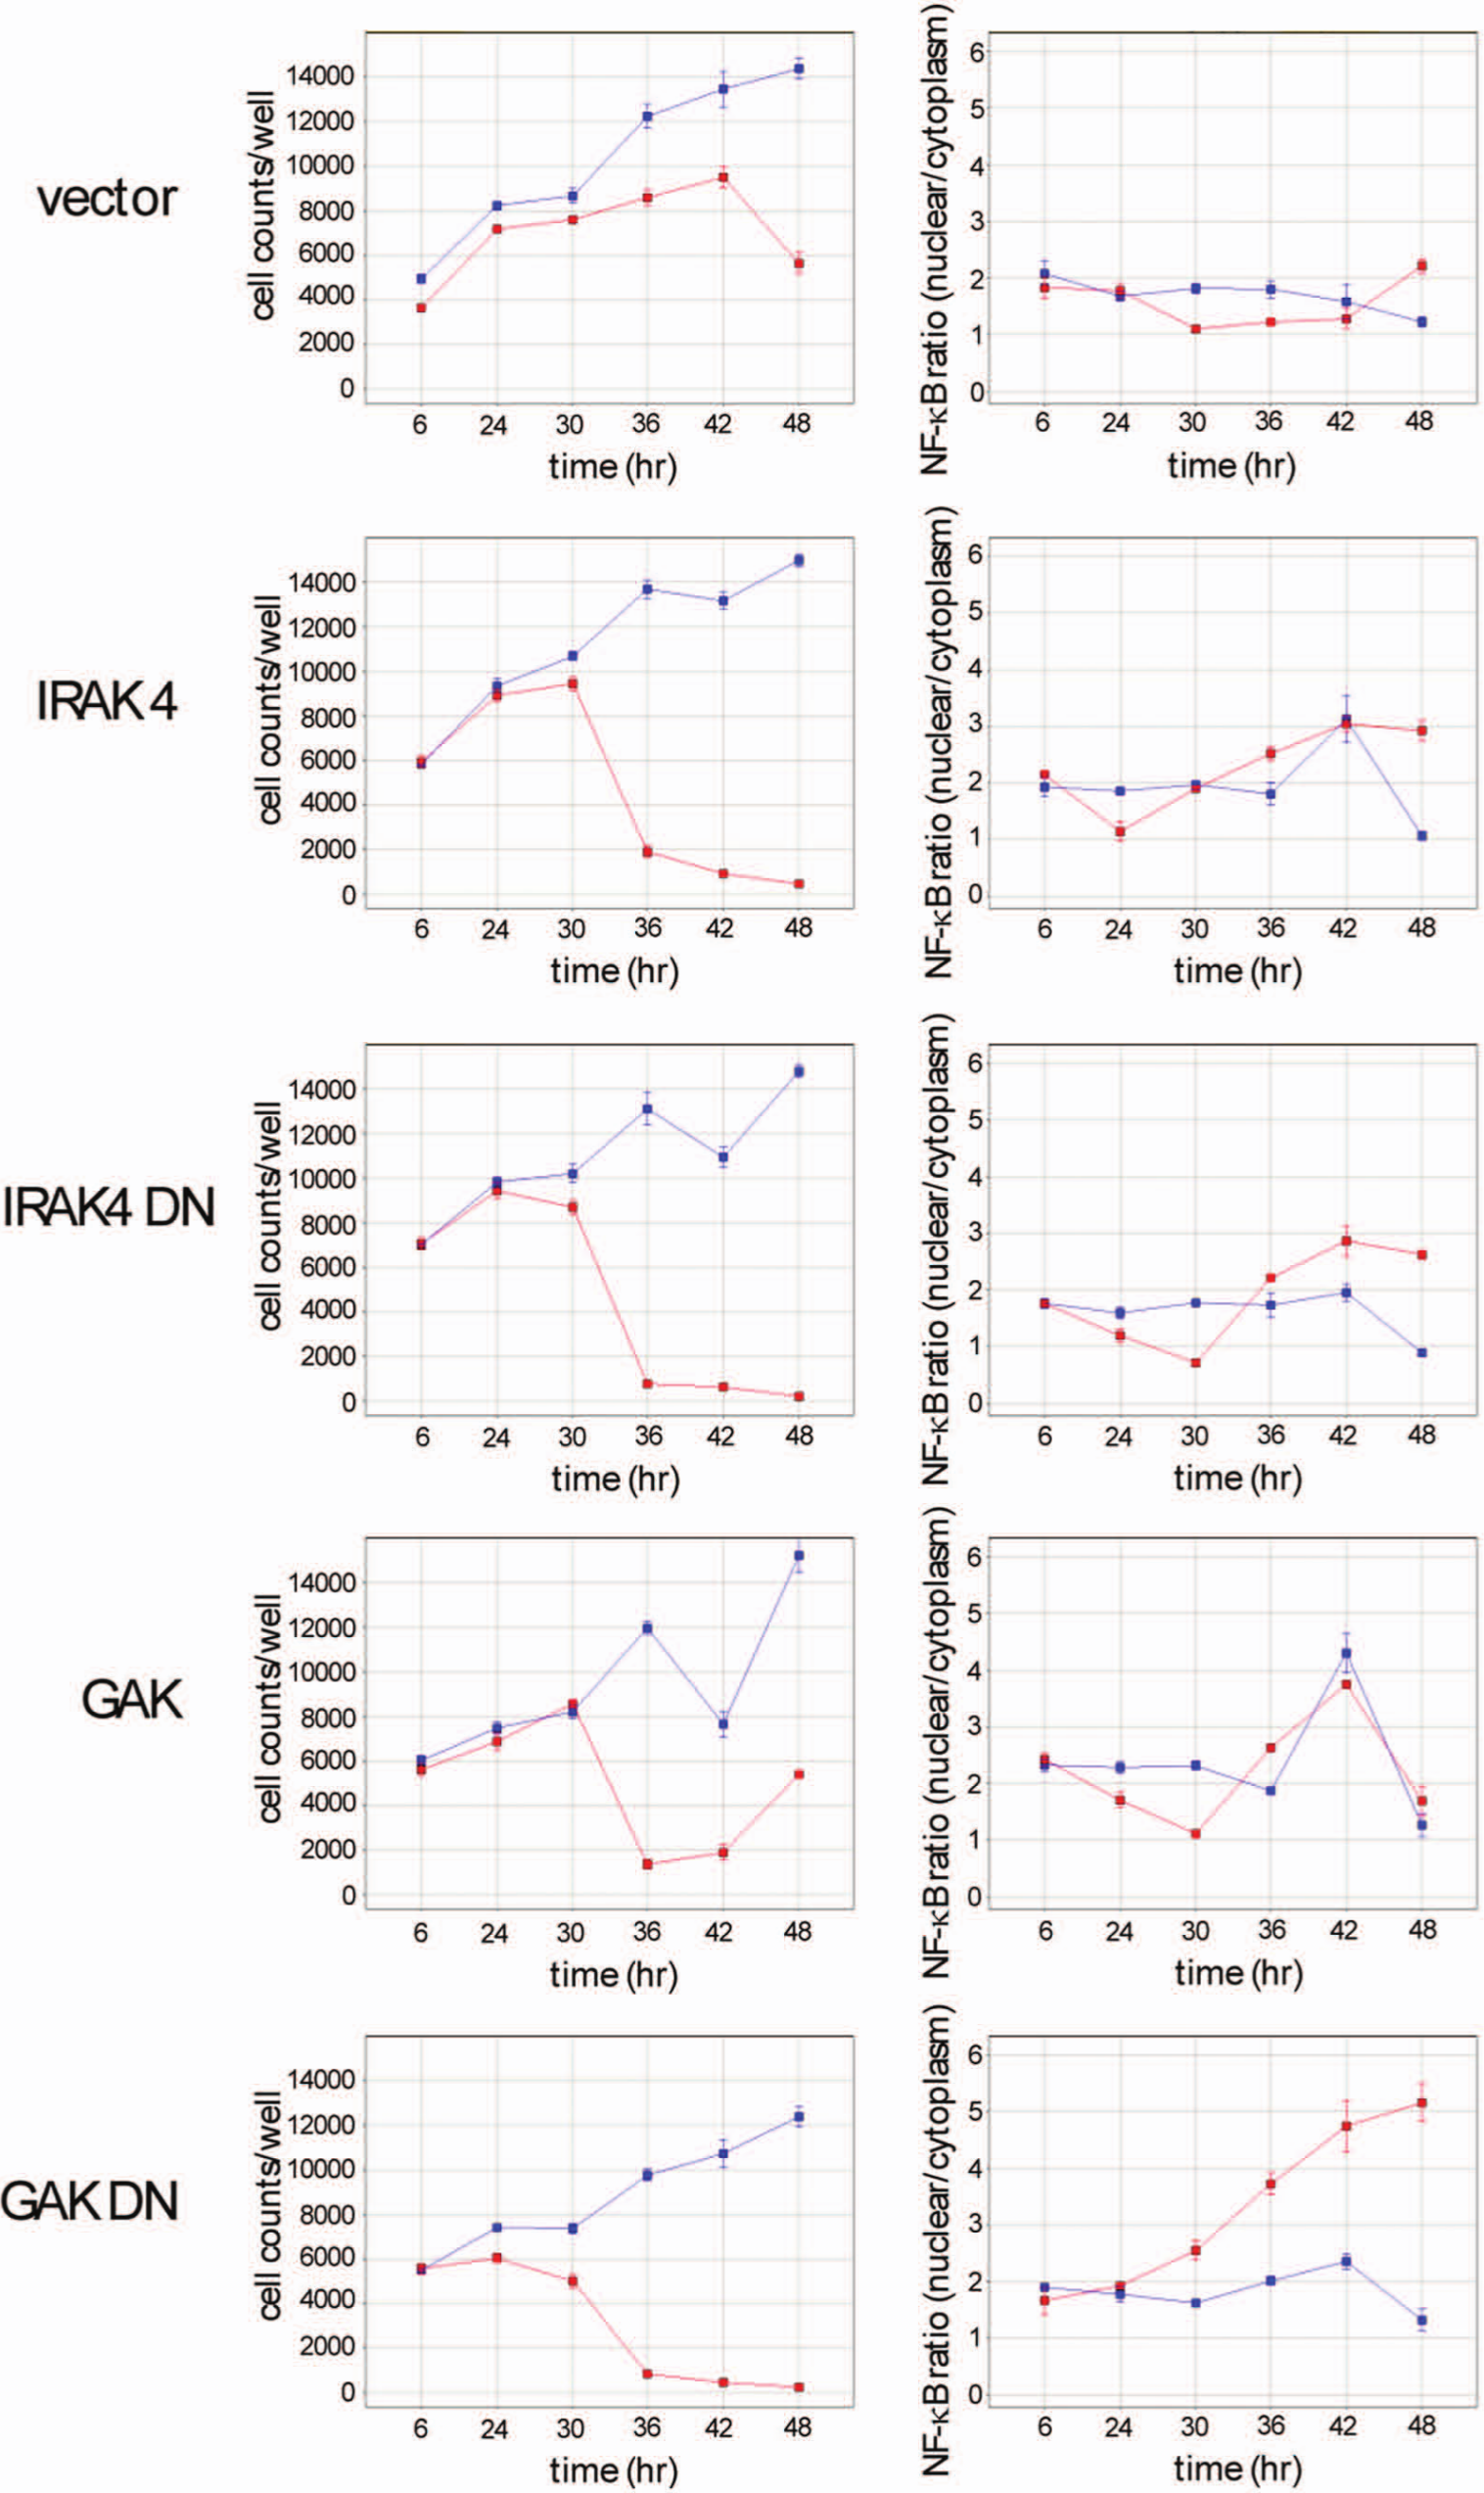
Effect of dominant negative mutant forms of IRAK4 and GAK on growth and nuclear factor–κB (NF-κB) localization during growth in anoxia. Control cell line is A498 transduced with the empty vector lentivirus. Other lines are A498 cells transduced with lentiviruses expressing the indicated kinase genes (wild type or dominant negative). Cell lines are as indicated in the figure. Red lines, growth under anoxia; blue lines, growth under normoxia.
Discussion
Hypoxic stress induces changes in cancer cells that facilitate survival, including altering metabolism of the cancer cells, recruiting endothelial and immune cells to the tumor that contribute to the survival of the tumor, and increasing the metastatic potential of tumor cells.4,13 Tumors that have adapted well to hypoxia are more aggressive and result in a poorer prognosis for the patient. Several critical strategies used by tumor cells have been described and, in some cases, such as host angiogenesis, have been targeted by therapeutics with some clinical success. However, tumors adapt to hypoxia through many mechanisms, and even successful therapeutics offer limited survival benefits due to the capacity of a tumor to blunt the effect of therapeutic interventions.13,21
Since our goal was to describe novel pathways that affect hypoxia adaptation, we wanted to use as general an assay as possible. This approach complicates the analysis of the primary screening data due to the increase in false-positive hits, but we felt it was important to screen outside of well-characterized adaptation to hypoxia, such as the induction of Hif-1α, because so much is already known about these processes. As such, we needed methods that could eliminate the majority of false-positive hits quickly. The best method available to us was to have screening data that were as robust as possible. We undertook three approaches. The first was to use a library of four individual siRNAs per target. Each gene was screened by four independent sequences, and therefore concordance among the siRNAs for an individual gene is likely to be the result of the knockdown of the intended target. Second, the library screen was run in triplicate, which allowed a measure of the statistical significance to be determined. siRNA screens are inherently less robust than small-molecule screens, 22 and therefore artifactually high responses for an siRNA are common. Repeating the screen in triplicate provides a measure of the level of noise for the screen as a whole and an assessment of the significance for each siRNA. Finally, several end points were measured, which produced a selection of genes for follow-up studies that was drawn from multiple phenotypic responses to hypoxia, increasing the opportunity to identify novel molecular pathways that affect adaptation.
Each of the three end points used to identify hits was able to identify kinase genes that had effects on one or more of the assays used to validate and characterize the hits, including hypoxia-specific growth attenuation, object area (both high and low), and object variable intensity. Although morphology-based screens are not unheard of, they are unusual. It is worth noting that the two kinase genes with the most dramatic effect on A498 cells (IRAK4 and GAK) were identified on the basis of altered nuclear morphology rather than growth rate. Other kinases identified through morphological changes, such as DYRK1B and IHPK2, also showed effects on secondary assays such as spheroid formation. As such, screens based on nonproliferative end points are valuable in identifying novel signaling pathways that can be considered for anticancer therapeutic development.
IRAK4 is best characterized for its role in the immune system, where it activates NF-κB through IKK-mediated phosphorylation and destruction of IκB. 20 The high levels of NF-κB in IRAK4-shRNA treated cells is consistent with such a role in this experiment. Although less well characterized for a role in cancer cell resistance to hypoxia, it is functional in ovarian and breast cancer.23,24 GAKs’ role in vesicle trafficking was described initially, 25 but subsequent studies identified a second role in cytokinesis, 26 and in fact it was this second role that enabled it to be identified in several recent RNAi screens.27–29 On the basis of an siRNA screen, we have extended these characterizations to include a role for GAK in the adaptation of cancer cells to hypoxia and to an effect on cancer cell survival that cannot be suppressed by the activation of NF-κB. Since NF-κB is a potent tumor survival pathway and the object of many cancer therapeutic strategies,30,31 an inhibitor that can function independently of the NF-κB survival pathway could be an important therapeutic modality. The genes identified in this study, particularly IRAK4 and GAK, but also DYRK1B, HIPK2, IHPK2, MATK, and MAP3K12, present targets that may be of particular significance to treating cancer cells within the hypoxic regions of a solid tumor. As such, their efficacy as cancer therapeutic targets may be strengthened as a function of their roles in both proliferative growth and the adaptation to the stress of hypoxia.
Footnotes
Declaration of Conflicting Interests
The authors declared no potential conflicts of interest with respect to the research, authorship, and/or publication of this article.
Funding
The authors received no external financial support for the research, authorship, and/or publication of this article.
References
Supplementary Material
Please find the following supplemental material available below.
For Open Access articles published under a Creative Commons License, all supplemental material carries the same license as the article it is associated with.
For non-Open Access articles published, all supplemental material carries a non-exclusive license, and permission requests for re-use of supplemental material or any part of supplemental material shall be sent directly to the copyright owner as specified in the copyright notice associated with the article.