
Abstract
In the past, the majority of antitumor compound-screening approaches had been performed in two-dimensional (2D) cell cultures. Although easy to standardize, this method provides results of limited significance because cells are surrounded by an artificial microenvironment, are not exposed to hypoxia gradients, and lack cell-cell contacts. These nonphysiological conditions directly affect relevant parameters such as the resistance to anticancer drugs. Multicellular tumor spheroids more closely resemble the in vivo situation in avascularized tumors. To monitor cellular reactions within this three-dimensional model system, we stably transfected a spheroid-forming glioblastoma cell line with Grx1-roGFP2, a green fluorescent protein (GFP)–based glutathione-specific redox sensor that detects alterations in the glutathione redox potential. Functionality and temporal dynamics of the sensor were verified with redox-active substances in 2D cell culture. Based on structured illumination microscopy using nonphototoxic light doses, ratio imaging was then applied to monitor the response of the glutathione system to exogenous hydrogen peroxide in optical sections of a tumor spheroid. Our approach provides a proof of concept for biosensor-based imaging in 3D cell cultures.
Introduction
Preclinical anticancer compound-screening approaches traditionally use two-dimensional (2D) cell culture, which is easy to establish but frequently provides results of limited significance because cells do not experience a physiological microenvironment. In contrast, three-dimensional (3D) cell cultures maintain tissue-like properties and therefore provide a more realistic background for the analysis of compound candidates. 1 Of these 3D cell culture models, the multicellular tumor spheroid (MCTS) model is of particular interest for drug discovery research, as it is high-throughput screening capable and mimics an avascular tumor nodule with regard to extracellular matrix content, oxygen gradients, and the formation of cell-cell contacts. 1 Different approaches for the generation of MCTS have been applied, for example, roller bottle cultures, the hanging drop method, soft agar methods, or poly-hydroxyethyl methacrylate (poly-HEMA)–mediated surface modification. A recently described 96-well approach using spheroid generation on convex agarose gel surfaces, combined with automated microscopy, has the potential to open the door for high-throughput compound screening in three dimensions. 2
MCTS substantially differs with regard to therapy resistance when compared with 2D cell cultures. This has been demonstrated for classical chemotherapeutic drugs, combinatorial approaches including chemotherapeutics and radiation, as well as compounds targeting cancer-specific metabolism and/or signaling.3–5 Treatment responses under hypoxic conditions in the inner-core regions of MCTS are of particular relevance for cancer researchers, as hypoxia triggers signaling pathways that result in the promotion of cell survival and suppression of apoptosis. 6 Consequently, these regions are suspected to harbor quiescent and drug-resistant subpopulations of cells, which cannot be eliminated during conventional chemotherapy.
In the current literature, effects of anticancer compounds in MCTS are commonly monitored in endpoint mode, either by signal integration over one spheroid or microplate cavity, 7 by flow cytometry subsequent to spheroid disintegration, 8 or by immunofluorescence/immunohistochemistry techniques subsequent to spheroid fixation. 9 Whereas such approaches provide quantitative data about averaged responses within the whole spheroid, a spatial and/or temporal resolution of the effects is lacking. Both parameters could be addressed by live cell imaging using sensitive, specific, and rapidly responding biosensors, which may provide further important information about microenvironment-dependent effects of compound candidates.
The redox potential of glutathione (EGSH) is an interesting parameter in the context of hypoxia-associated therapy resistance, as it participates in the detoxification of xenobiotics and reactive oxygen species and changes with therapeutically relevant events such as apoptosis. Independently regulated glutathione pools exist in different subcellular compartments (cytosol, mitochondria, endoplasmic reticulum, nucleus) and take part in compartment-specific functions. However, the precise diagnostic values of changes in EGSH are yet poorly defined, especially because until recently they could not be measured in a nondestructive and compartment-specific manner. The genetically encoded redox sensor Grx1-roGFP2, a fusion protein consisting of a redox-sensitive green fluorescent protein (GFP) variant (roGFP2) and human glutaredoxin 1, was introduced in 2008. 10 It allows for ratiometric measurements in individual compartments of living cells, and unlike previously established redox-sensitive roGFPs, it offers high selectivity for glutathione and is kinetically capable of monitoring the glutathione redox potential (EGSH) in real time (for review of these and related genetically-encoded redox probes, please see reference 11). These features qualify Grx1-roGFP2 variants as reporter candidates for imaging of compound-mediated effects in real time.
Drug evaluation approaches based on 3D live cell imaging suffer from their inherent phototoxicity, which is caused by the generation of reactive species within cells due to photon absorption, intersystem crossing, and energy transfer to bioactive molecules. Photodynamically generated reactive (oxygen) species affect oncogenic signal transduction (e.g., by PI3K/AKT 12 ) and therefore interfere with compound-mediated effects. This situation is further worsened by the necessity to record several optical planes to reconstruct a 3D image, as well as by the application of fluorescent reporters, which frequently further limit the tolerable light dose exposure for live cell microscopy. In previous work, we quantified the phototoxicity of various fluorescent markers frequently applied in microscopy13,14 and found that light exposure >10 J/cm2 can lead to significant cell damage in monolayer culture. We aimed at the realization of a concept for 3D live cell imaging that delivers maximum information during the application of a tolerable light dose. This includes the use of photostable, sensitive, and specific molecular markers in combination with a suitable microscopy method. To this end, we combined the advantages of Grx1-roGFP2 redox sensors in MCTS and light dose–controlled structured illumination microscopy to image drug-induced effects in three dimensions. Our results demonstrate a feasibility of this method for improved unbiased analyses of biosensor responses in 3D cell cultures.
Materials and Methods
Cell Culture
All cell lines were cultivated under standard culture conditions (37 °C, 5% CO2, >95% humidity). T24 cells were purchased from ATCC (#HTB-4) and maintained in McCoy’s 5A medium containing glutamax (Life Technologies, Darmstadt, Germany), 10% fetal calf serum (FCS; PAA, Pasching, Austria), and 1% PenStrep (PAA). U373MG cells were purchased from Cell Lines Service (#300366) and maintained in RPMI1640 medium containing glutamax (Life Technologies), 10% FCS, and 1% PenStrep. U251MG-L106 is a transfected subclone of the U251MG glioblastoma cell line (obtained from the DKFZ Tumorbank), which expresses a modified enhanced GFP (eGFP) gene harboring the Flp recombinase target (FRT) sequence for site-specific integration of expression vectors. The clone was selected due to (1) the presence of a single copy FRT site and (2) the strength and homogeneity of gene expression from the targeted locus, which had been ascertained in previous analyses (unpublished data). U251MG-L106 cells were cultivated in RPMI1640 medium containing glutamax, 10% FCS, 1% PenStrep, and 600 µg/mL G418 (Roth, Karlsruhe, Germany) to maintain selection pressure on the targeted locus. Recombinant subclones (U251MG-L106-RS, U251MG-L106-MRS) expressing the redox sensor genes were further treated with 300 µg/mL hygromycin (Life Technologies). Spheroid culture was performed in agarose-coated 96-well plates (Greiner) as basically described by Friedrich et al. 2 Cells were seeded at densities between 2500 and 20 000/well in growth media. The convex surface of the biologically inert gel rejected cell adhesion and favored the formation of aggregates, which formed stable spheroids within 24 h of cell culture. For drug treatment and subsequent microscopic analysis, spheroids were transferred to eight-well µ-slides (ibidi GmbH, Martinsried, Germany) using clipped micropipette tips.
Cloning of redox Sensor Expression Vectors
The coding sequences of Grx1-roGFP2 and Mito-Grx1-roGFP2 were PCR amplified with oligonucleotide primers (Entelechon, Regensburg, Germany) containing attB1 and attB2 overhangs for Gateway cloning. Fragments were transferred into pDONR221 (Life Technologies) using BP clonase (Life Technologies) according to the manufacturer’s instructions. After sequence verification, the coding sequences were transferred to a Gateway-compatible variant of the pcDNA5-FRT vector (Life Technologies) using LR-Clonase (Life Technologies) according to the manufacturer’s instructions. The presence of the FRT sequence in this expression vector allowed for site-specific integration of the constructs into the U251MG-L106 clone.
Transfections
U251MG-L106 cells were co-transfected with expression constructs for the redox sensor proteins and the pOG44 plasmid (transiently expressing Flp recombinase [Life Technologies]) using GeneJammer reagent (Agilent, Waldbronn, Germany) according to the manufacturer’s instructions. Seventy-two hours posttransfection, hygromycin was added to the cell culture media to select for Flp recombinase catalyzed targeted integration of the redox sensor constructs in the U251MG-L106 cell line genome, which coincides with recombination-mediated expression of the hygromycin resistance gene. Surviving colonies were expanded and analyzed for redox sensor mRNA expression using Superscript III reverse transcriptase (Life Technologies, according to the manufacturer’s instructions) and the oligonucleotide primers previously used for cloning.
Redox Measurements in 2D Cell Culture
Cells were seeded at a density of 20 000/well in 96-well plates (Greiner, Frickenhausen, Germany) and grown in standard culture medium. Forty-eight hours after seeding, medium was exchanged for EBSS buffer, and the plate was incubated in a microplate reader (Fluostar Omega, BMG Labtech, Offenburg, Germany) at 37 °C. For each well, fluorescence ratios (excitation 400 nm, emission 520 nm vs. excitation 485 nm, emission 520 nm) were recorded during 60 cycles of 1.5 s. Redox-active agents (H2O2 and dithiothreitol [DTT]; Sigma, Schnelldorf, Germany) were diluted in HBSS and injected automatically using built-in injectors (H2O2 after cycle 10 [t = 15 s], DTT after cycle 30 [t = 45 s], resulting in final concentrations stated in the respective experiments. Average values of blank corrected measurements performed in quadruplicate were plotted against time. Curves were fitted using an automated algorithm implemented in the MARS data analysis software (version 1.20, BMG Labtech), which is based on the determination of moving average values.
Flow Cytometry
Flow cytometry was carried out on a CyFlow Space instrument (Partec, Münster, Germany). Data were analyzed using Flomax (version 2.7, Partec). Prior to analysis, cells were detached by trypsin/EDTA treatment, centrifuged for 5 min at 200 × g, and resuspended in EBSS buffer (containing H2O2 when appropriate). In general, 20 000 events from each cell preparation were captured. Of these, single cells were identified by dotplot analysis (forward scatter [FSC] vs. side scatter [SSC]) and gated for further analysis. Fluorescence intensity was recorded at an excitation wavelength of 405 nm (for the oxidized fluorophore in Grx1-roGFP2 variants) as well as 488 nm (for eGFP and the reduced fluorophore in Grx1-roGFP2-variants). Fluorescence intensity ratios were calculated and plotted using the ratio algorithm implemented in the Flomax software.
Spheroid Imaging
U251MG-L106-RS–derived spheroids were grown for 1 wk after seeding 3000 cells per well in agarose gel–coated 96-well plates. Spheroids were transferred to eight-well µ-slides for fluorescence imaging using structured illumination as basically described in reference 15. A Ronchi grating (Edmund Optics, Karlsruhe, Germany) with 10 line pairs per millimeter (lp/mm) was projected into the focal image plane by a microscope objective lens (Plan Neofluar 10×/0.3). Three different lateral positions of the grating were adjusted by a piezo positioning system (PX100, Piezosystem Jena GmbH, Jena, Germany). Single planes of the sample were selected by moving the objective lens in the axial direction. From an image stack thus obtained, a 3D image of the whole sample could be reconstructed. For ratio imaging, light-emitting diodes operated at wavelengths of 470 ± 12 nm and 385 ± 5 nm (Luxeon III Star, Philips Lumileds Lighting Corporation, San Jose, CA; and NCSU034A(T), Nichia Corporation, Tokushima, Japan) were used together with fiber-optic coupling, a condenser lens, and a dichroic mirror at 510 nm. Fluorescence arising from the sample was detected by an integrating digital charge-coupled device camera (ProgRes C10, Jenoptik GmbH, Jena, Germany) together with a long-pass filter for λ ≥ 515 nm.
As reported for microscopic setups with structured illumination, 15 the intensity of the excitation light is described by

where I0 represents a constant component and IS as well as IC the modulated fractions of a grating with variable phase Φi. By use of three different phase positions, Φ1 = 0, Φ2 = 2π/3, and Φ3 = 4π/3, and measurement of the corresponding fluorescence intensities I1, I2, and I3, one can eliminate the modulated light fraction according to the algorithm

Image information arising from above and beyond the focal plane is eliminated by subtraction because I1, I2, and I3 have the same amplitude with undefined phase position. Therefore, the remaining unstructured image arises from the focal plane with an axial resolution of 5 to 6 µm.
Results and Discussion
Generation of Multicellular Tumor Spheroids
The cultivation of spheroids requires the prevention of cells to adhere to artificial surfaces, as given in plastic cell culture dishes. Matrix-providing reagents such as methocel, reconstituted basement membrane (Matrigel), or purified extracellular matrix components may alleviate spheroid formation but also provide an undesired artificial microenvironment containing varying loads of growth factors or other bioactive reagents, which complicate spheroid culture and analysis. To provide a reproducible and biologically inert microenvironment for the generation of spheroids, we coated 96-well plates with agarose gels according to the procedure described by Friedrich et al. 2 We tested several tumor cell lines for MCTS growth under these conditions. The most reproducible results were achieved for the T24 bladder carcinoma cell line, the U373 astrocytoma/glioblastoma cell line, as well as U251MG-L106 cells, an eGFP-expressing subclone of the U251MG astrocytoma/glioblastoma cell line. All three cell lines formed round-shaped spheroids within 24 to 48 h post seeding, which remained stable for weeks during long-term culture ( Fig. 1a ). Spheroid size was highly reproducible and dependent on cell numbers seeded (as exemplarily shown for U251MG-L106; Fig. 1b – c ). It was furthermore slightly decreasing during long-term culture up to 14 days postseeding (not shown).
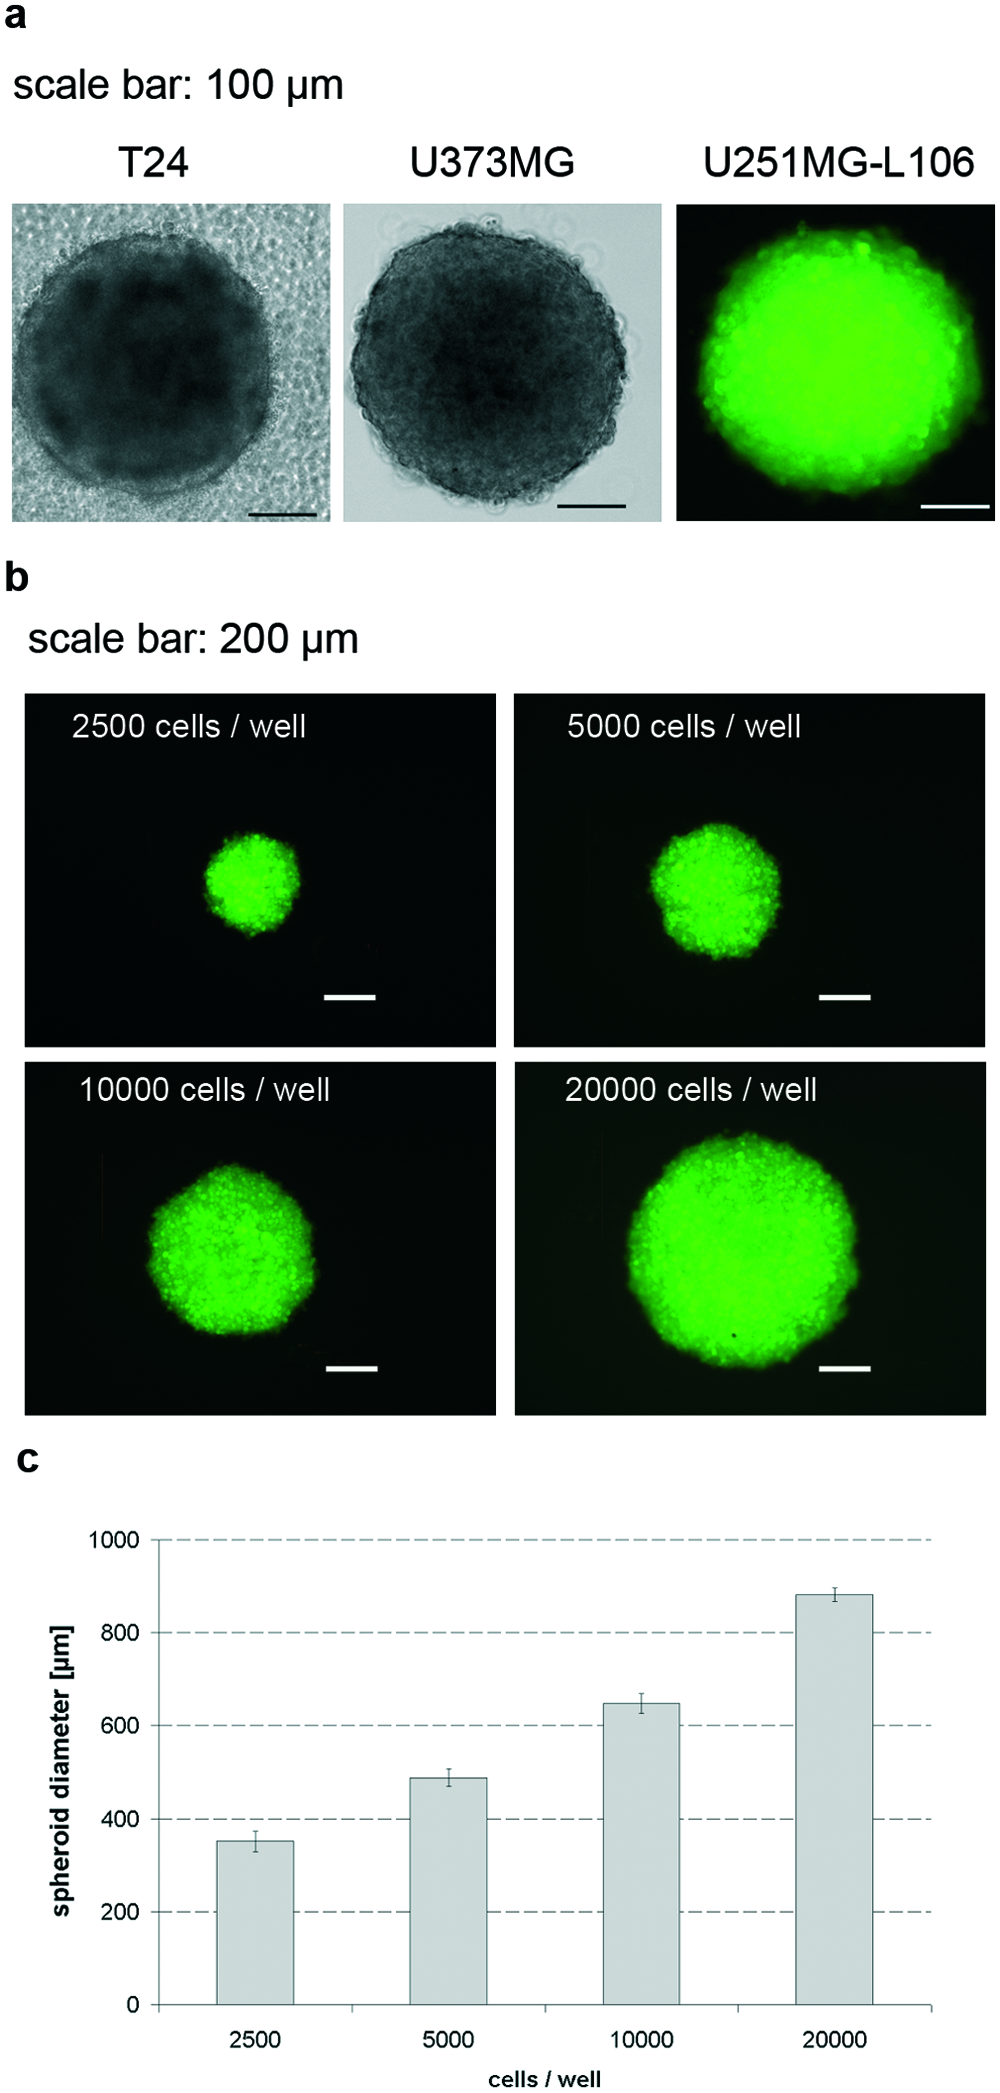
Generation and characterization of multicellular tumor spheroid (MCTS). (
Standardized Expression of Redox Sensor Variants in U251MG-L106 Subclones
As the efficiency of most anticancer drugs is affected by (partial/temporary) hypoxia in core regions of the tumor, a noninvasive approach providing spatial and temporal resolution of drug-mediated effects in MCTS would be helpful for the identification of candidate formulations that specifically target therapy-resistant cell populations. We chose differentially targeted variants of the genetically encoded redox sensor Grx1-roGFP2 as reporters for compartment-specific, therapy-associated alterations in EGSH. These may provide valuable insights into the detoxification of xenobiotics, as well as ROS-metabolism of hypoxic cells in response to therapeutic approaches.
To obtain cell clones that (a) reproducibly form MCTS and (b) reveal strong and homogeneous expression of Grx1-roGFP2, we took advantage of an FRT sequence within the genome of U251MG-L106 cells, allowing for the rapid and standardized generation of isogenic subclones by site-specific integration of genetic elements. U251MG-L106 was previously analyzed for the presence of the FRT site in single copy, as well as for its homogeneous expression from the targeted locus (unpublished data). The FRT site is integrated within the coding sequence of eGFP, which allows convenient control of the recombination event by monitoring loss of eGFP expression. We used this technology to generate U251MG-L106 subclones expressing Grx1-roGFP2 in mitochondria (U251MG-L106-Mito-Grx1-roGFP2 alias U251MG-L106-MRS) and the cytosol (U251MG-L106-Grx1-roGFP2 alias U251MG-L106-RS). As expected, the expression of redox sensor genes and proteins was strong and homogeneous in both resulting isogenic daughter clones, as determined by reverse-transcription PCR (not shown) and flow cytometry ( Fig. 2a ). Correct mitochondrial localization of Mito-Grx1-roGFP2 in U251MG-L106-MRS was ascertained by fluorescence microscopy ( Fig. 2b ).
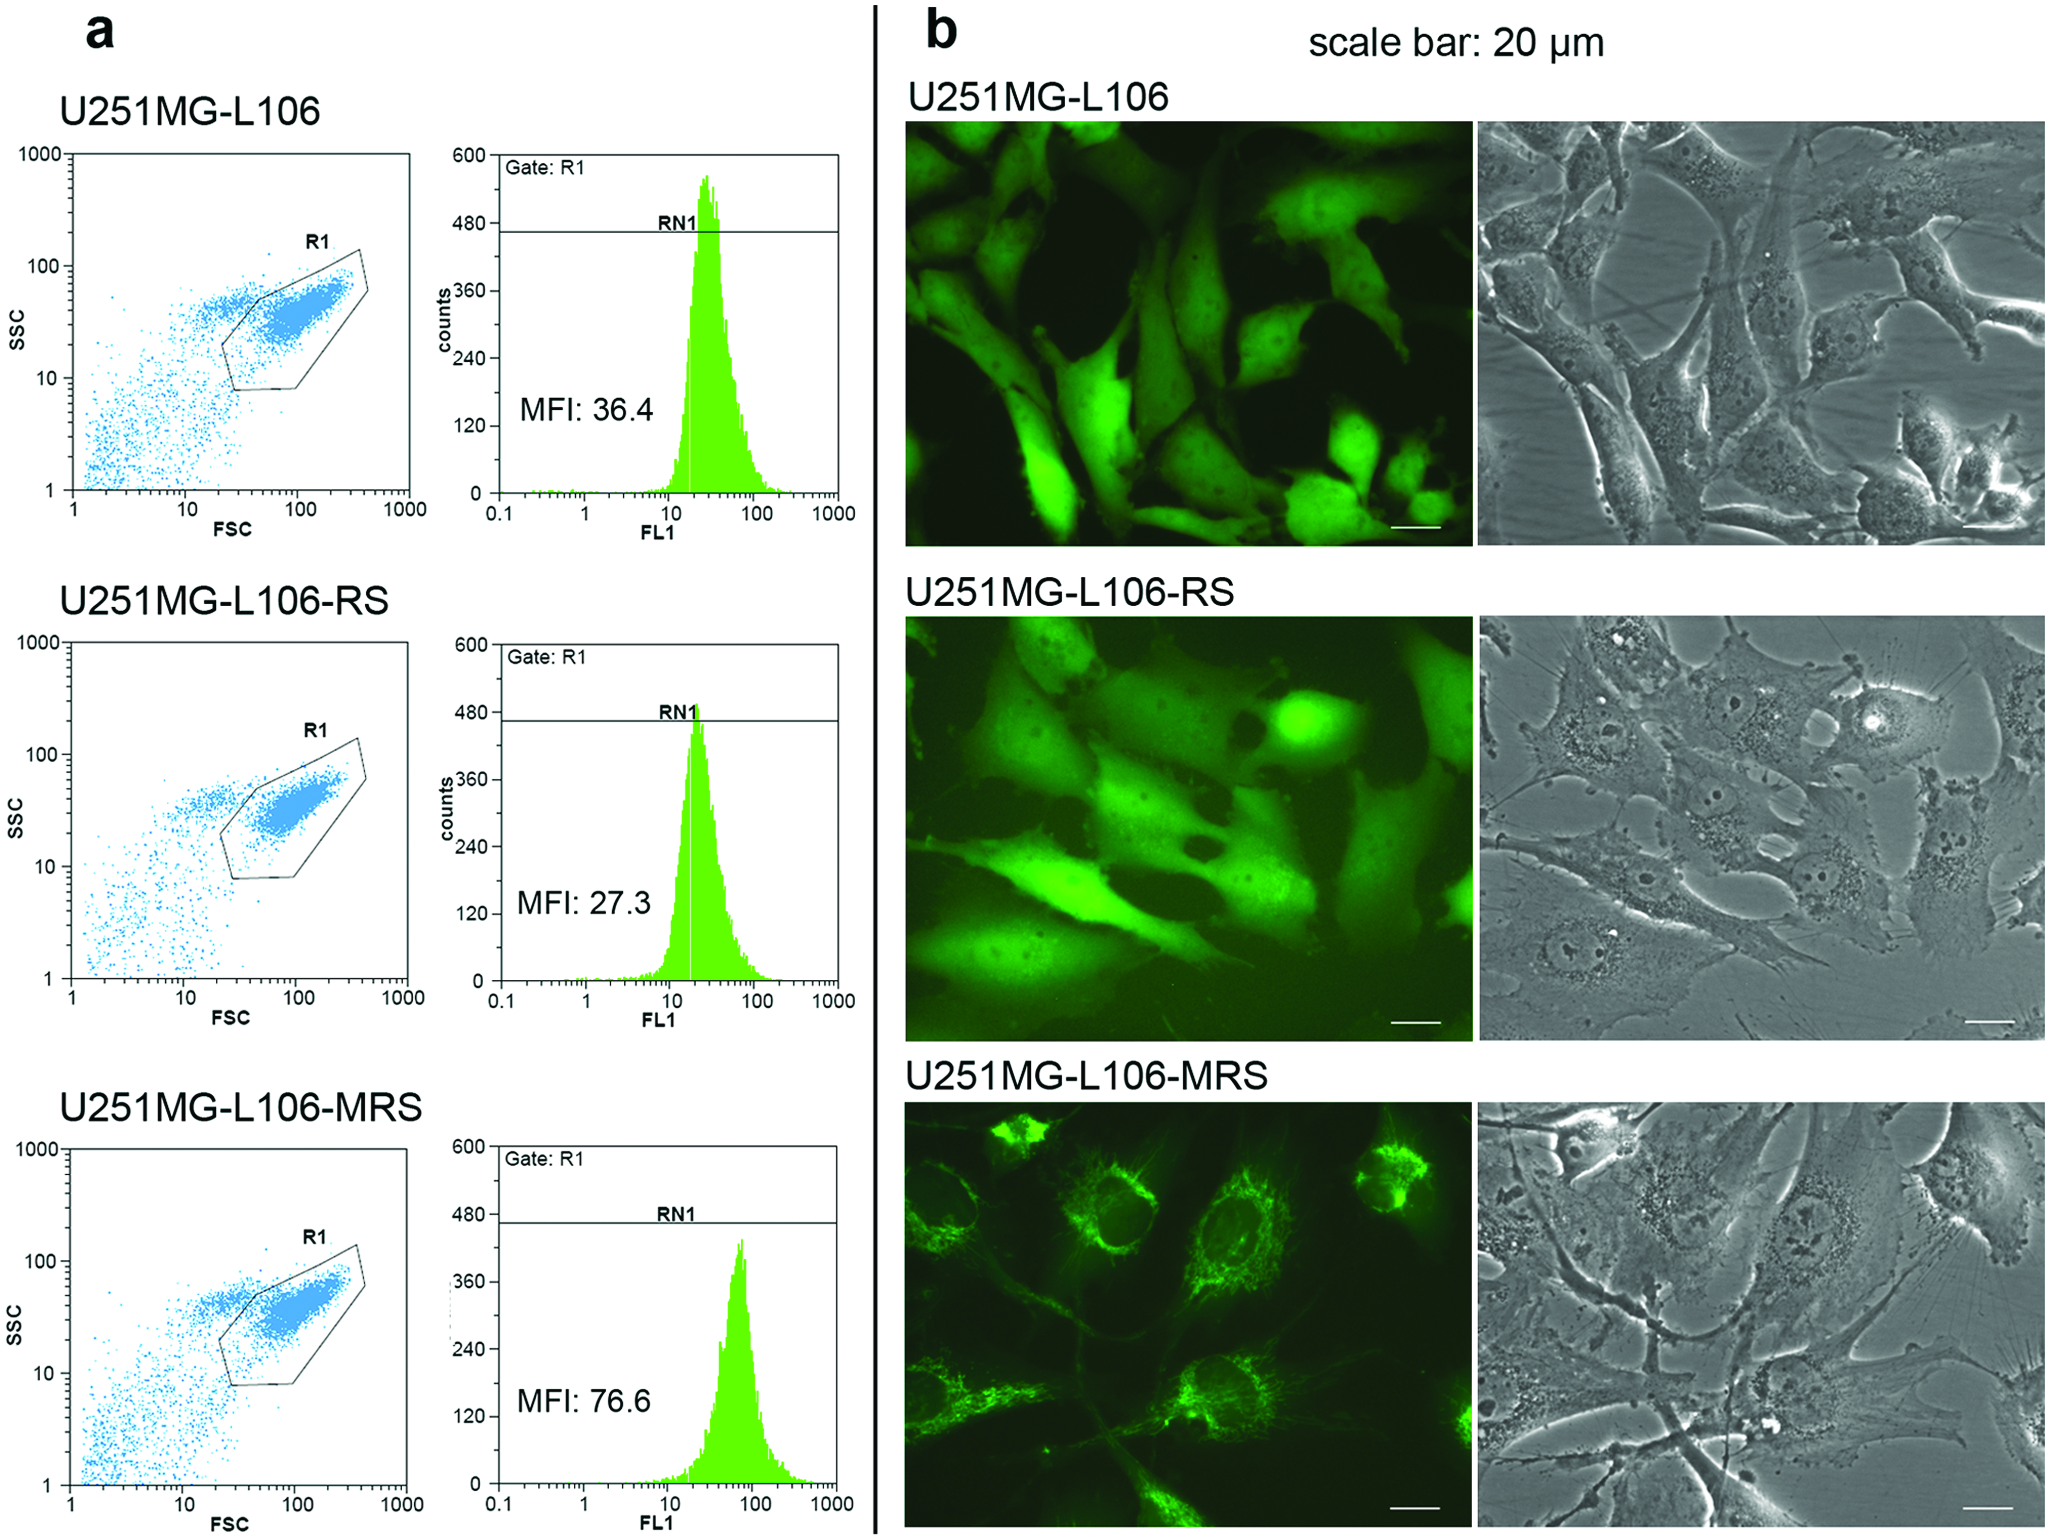
Generation of isogenic U251MG glioblastoma cells stably expressing Grx1-roGFP2 (RS) and Mito-Grx1-roGFP2 (MRS). The parental clone U251MG-L106 stably expresses enhanced green fluorescent protein (eGFP) and allows for targeted integration of the redox sensor expression vectors, which leads to loss of eGFP and expression of the transgene. (
Validation of Redox Sensor Function by Flow Cytometry and in 2D Cell Culture
Both cytoplasmic and mitochondrial Grx1-roGFP2 sensor proteins respond to exogenously applied hydrogen peroxide (H2O2) and DTT when expressed in HeLa cells. 10 To evaluate basic functionality of the redox sensor proteins in the U251MG-L106 background, we initially used ratiometric flow cytometry (at excitation wavelengths of 405 nm vs 488 nm) to examine the response of sensor-expressing cells versus U251MG-L106 subsequent to incubation with different doses of hydrogen peroxide for 5 min. The sensor transfectants, but not the parental U251MG-L106 cells (expressing eGFP), exhibited an oxidation of the fluorophore at 50 µm and more pronounced at 100 µM H2O2 ( Fig. 3a ). To analyze the temporal dynamics of redox sensor responses in the transfected cells, we applied ratiometric measurements subsequent to H2O2/DTT treatment in 2D cell cultures using a microplate reader with built-in injectors. Oxidation of the fluorophore occurred rapidly (within approximately 10–15 s) upon incubation of the cells with H2O2 in both redox sensor transfectants but not in the parental clone. In U251MG-L106-RS, the degree of fluorophore oxidation correlated well with the concentration of the oxidizing agent, whereas DTT injection was followed by a slow reduction of the sensor, the timing of which depended on the concentration of the reducing agent. U251MG-L106-MRS responded similarly, but the dose dependence was less pronounced. In general, the cytoplasmic redox sensor showed a stronger response than the mitochondrially localized protein, indicating that externally applied H2O2 predominantly leads to an oxidation of the cytoplasmic GSH pool. The fluorophore of the eGFP protein expressed by the parental clone U251MG-L106 was not affected by injection of the redox-active agents ( Fig. 3b ).
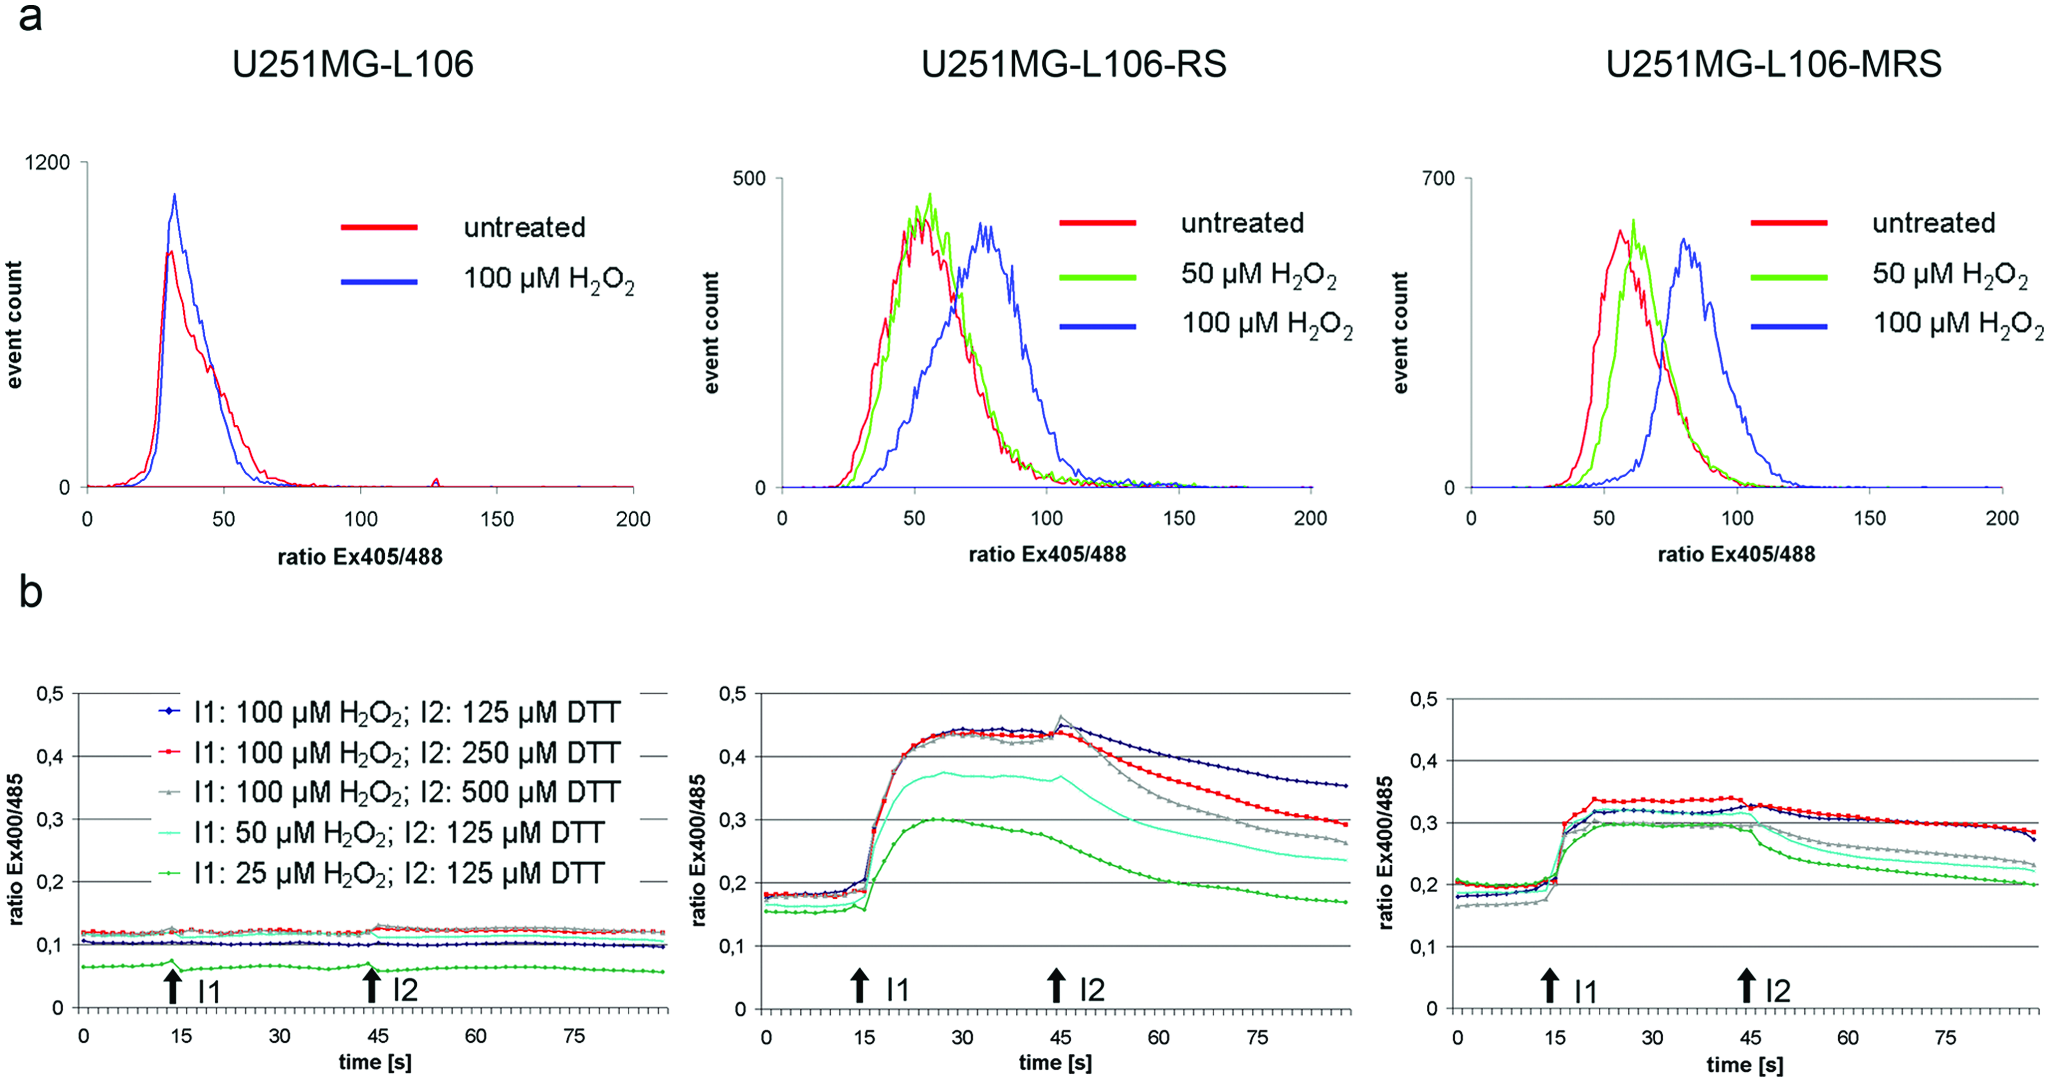
U251MG-L106-RS and U251MG-L106-MRS respond to exposure to oxidizing and reducing reagents in suspension and in monolayer culture. (
Imaging Redox Sensor Modulation in Glioblastoma Spheroids
To provide a proof of concept for the feasibility of redox-based imaging in 3D cell cultures, we analyzed optical sections of spheroids formed from U251MG-L106-RS cells before and subsequent to oxidation by hydrogen peroxide. Spheroids were grown for 1 wk to a size of approximately 500 µm in diameter and transferred to eight-well µ-slides. Prior to spheroid oxidation, a microscopic image was taken using the structured illumination setup, as illustrated in
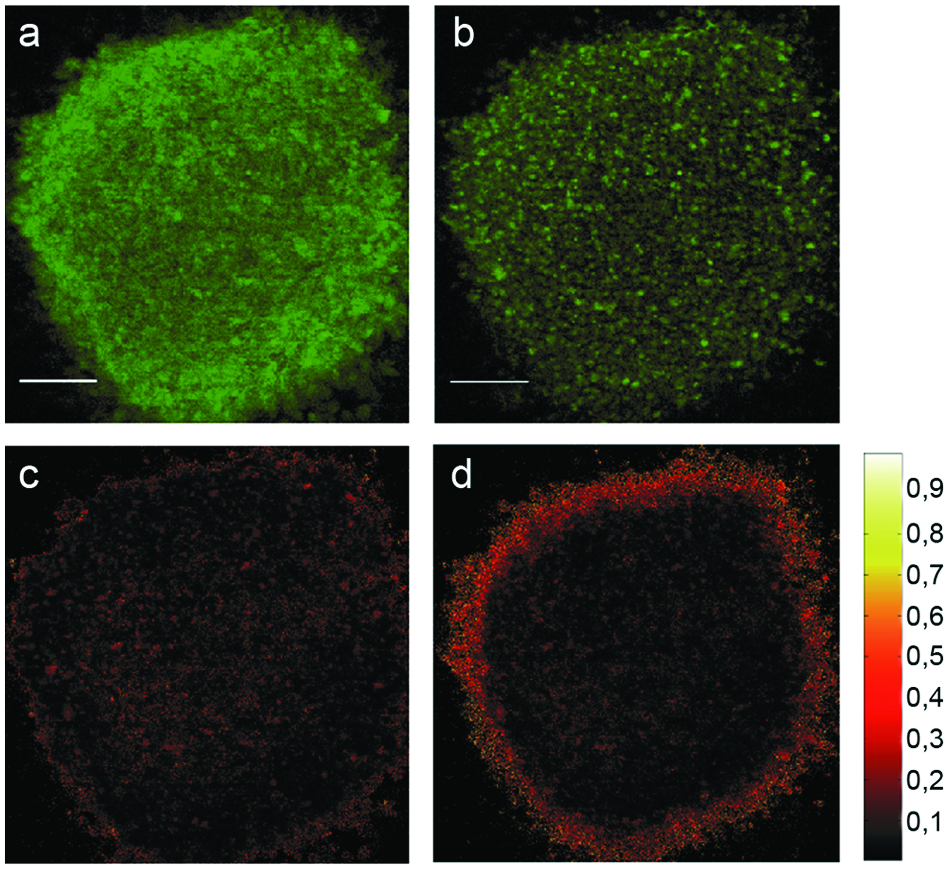
Ratio imaging of U251MG-L106-RS spheroids. (
Because of the high number of fluorescent molecules located within a 5 µm layer as well as the high efficiency and sensitivity of the detection system, the total light exposure for recording three structured images (needed for calculation of one focal plane) could be limited to about 0.05 J/cm2. Correspondingly, for the ratio image a light exposure of 0.1 J/cm2 was needed. Assuming a light dose limit of 10 J/cm2 for fluorophore-stained cells, 14 our experimental conditions allow for the acquisition of approximately 100 ratio images without evoking phototoxicity. Therefore, various layers of a 3D sample can be assessed at moderate (10–20×) magnification, and repeated measurements of long duration become possible without affecting cell viability. The application of selective plane illumination microscopy (SPIM) 16 could further reduce the reactive oxygen burden generated during spheroid imaging, because this method permits selective illumination of a single plane without affecting out-of-focus parts of the sample. Very recently, we developed an optical setup adapted to an inverse microscope, which allows for SPIM in glass capillaries subsequent to microfluidics-based spheroid treatment. 17 This device could be used for improved unbiased imaging of drug-induced effects in biosensor-equipped spheroids at conditions of low light exposure.
In concordance with the kinetic data obtained in the 2D cell culture experiment, sensor oxidation by hydrogen peroxide occurs rapidly in cells accessible for the drug. Our current microscopic setup still requires a manual exchange of the different light sources for ratiometric imaging and is therefore not suitable for the detection of sensor responses occurring within a few seconds. Further technical developments currently addressed in our lab include quasi-simultaneous excitation with pulsed laser diodes, combined with a fast detection system, to perform precise imaging of rapid redox sensor responses. Such a setup would also be easily adaptable for the analysis of other genetically encoded sensor molecules requiring fast detection technologies, such as biosensing of apoptosis using fluorescence lifetime imaging, which was recently demonstrated in 2D cell cultures. 18
In conclusion, we present an imaging-based concept for the spatial and temporal analysis of drug-induced effects in biosensor-equipped glioblastoma tumor spheroids, which may provide insights into responses of therapy-resistant hypoxic cell populations in inner-core regions of tumors. The concept was initially realized for the analysis of the redox sensor Grx1-roGFP2, which enables the specific measurement of EGSH, a cellular parameter directly associated with drug-induced reactions such as the detoxification of xenobiotics. However, the genome of the spheroid-forming recipient cell line U251MG-L106 harbors an FRT sequence for site-specific integration and homogeneous expression of transgenes, which allows a rapid adaptation of the cellular model to any genetically encoded biosensor available. Recent advances in spheroid handling, combined with low light dose microscopy and fast excitation/detection technologies, could complement our concept toward the realization of a platform for anticancer drug evaluation in three dimensions, which then would provide valuable comparative information, as well as significantly exceed knowledge that can be acquired from two-dimensional cell culture systems.
Footnotes
Acknowledgements
The authors thank Eva Winkler, Petra Kruse, Andrea Böhmler, and Claudia Hintze for expert technical assistance.
Declaration of Conflicting Interests
The authors declared no potential conflicts of interest with respect to the research, authorship, and/or publication of this article.
Funding
The authors disclosed receipt of the following financial support for the research, authorship, and/or publication of this article: This study was supported by grants from the Government of Baden-Württemberg and the European Union–Europäischer Fonds für die regionale Entwicklung.
References
Supplementary Material
Please find the following supplemental material available below.
For Open Access articles published under a Creative Commons License, all supplemental material carries the same license as the article it is associated with.
For non-Open Access articles published, all supplemental material carries a non-exclusive license, and permission requests for re-use of supplemental material or any part of supplemental material shall be sent directly to the copyright owner as specified in the copyright notice associated with the article.