
Abstract
We present a spheroid trapping device, compatible with traditional tissue culture plates, to confine microtissues in a small area and allow suspension cultures to be treated like adherent cultures with minimal loss of spheroids due to aspiration. We also illustrate an automated morphology-independent procedure for cell recognition, segmentation, and a calcium spike detection technique for high-throughput analysis in 3D cultured tissue. Our cell recognition technique uses a maximum intensity projection of spatial-temporal data to create a binary mask, which delineates individual cell boundaries and extracts mean fluorescent data for each cell through a series of intensity thresholding and cluster labeling operations. The temporal data are subject to sorting for imaging artifacts, baseline correction, smoothing, and spike detection algorithms. We validated this procedure through analysis of calcium data from 2D and 3D SHSY-5Y cell cultures. Using this approach, we rapidly created regions of interest (ROIs) and extracted fluorescent intensity data from hundreds of cells in the field of view with superior data fidelity over hand-drawn ROIs even in dense (3D tissue) cell populations. We sorted data from cells with imaging artifacts (such as photo bleaching and dye saturation), classified nonfiring and firing cells, estimated the number of spikes in each cell, and documented the results, facilitating large-scale calcium imaging analysis in both 2D and 3D cultures. Since our recognition and segmentation technique is independent of morphology, our protocol provides a versatile platform for the analysis of large confocal calcium imaging data from neuronal cells, glial cells, and other cell types.
Introduction
The physiological relevance of 3D cultures is inspiring unprecedented development of 3D culture platforms and materials to replace 2D platforms in drug discovery and tissue engineering applications.1,2 The feasibility of this endeavor still requires work toward the design of 3D platforms to facilitate large-scale culture, reproducibility of results, automation, cost-effectiveness, and adaptation of 3D cultures to high-throughput readout/analysis technologies.2,3 Several studies have demonstrated the potential of meeting these design goals using both scaffold-based systems (such as microwell plates,4–6 hydrogel beads,7,8 and polymer scaffolds) and non-scaffold-based 3D cultures (suspension cultures).9,10 Suspension cultures are particularly very promising because unlike scaffold-based platforms, the methods involved in tissue production can be simplified such that minimal fabrication skills or specialized chemical treatments and equipment are required, thus making the method relatively convenient and cost-effective for use.9,11
The lack of convenience of adherent culture in suspension cultures, however, often results in reduced cell retention odds during prolonged cultures.12,13 Even with commercial platforms for spheroid cultures, such as hanging-drop microplates and low-attachment plates, long-term cultures are still problematic. First, these platforms are expensive. 14 Second, low-attachment culture plates (such as 384-well plates, Alvetex 3D Cell Growth Plates, and Cellusponge-collagen) facilitate the formation of uniform spheroids but do not prevent the aspiration of cells during medium changes and other sample preparation steps, which require rinsing; care must be taken to avoid aspiration of cells15,16—which may limit opportunities for automation. Hanging-drop microplates prevent the aspiration of spheroids and facilitate the formation of uniform-sized microtissues but are limited to very low volumes of the medium. This makes them labor-intensive for long-term cultures.12,15
Another limitation, though not unique to suspension cultures but universal to 3D culture systems and 2D cultures to some extent, lies in the adaptation of cultures to high-throughput analysis procedures—specifically in neuroscience where calcium imaging is a major tool for evaluating cellular behavior. The aggregation of cells in spheroids leads to the formation of dense microtissue, which coupled with signal interaction between neighboring cells only allows for fuzzy means of individual cell body identification. Even with commercial software like Metamorph, cell segmentation in dense tissue has been reported to be ineffective. 17 A typical calcium signal extraction and analysis process from an in vitro culture involves labeling the microtissue with a fluorescent dye, followed by excitation of the dye using a suitable laser. Spatiotemporal calcium data are then extracted as a mean fluorescence of areas normally hand drawn to encompass individual cells (also known as regions of interest [ROIs]). The data are plotted using a suitable visualization software and signals are often manually quantified, documented, and archived. However, such interpretation of this readout is inclined to be ambiguous or relative (depending on who looks at the data) or may require specialized skill to determine true signals from noise. Moreover, this manual approach of selecting ROIs and interpreting calcium spikes is not realistic in high-throughput studies—even in monolayer 2D cultures where cells are sparse. Manual analysis, sorting, documentation, and archiving of large data sets could translate into hundreds of hours. A common solution has been to study only a fraction of the population of cells in the field of view, but this may only provide a biased result. Such challenges contribute to difficulty for the adoption of 3D technologies in large-scale industrial production processes, such as in pharmaceutical compound screening.
The purpose of this paper is, first, to present a simple spheroid trapping device, compatible with conventional tissue culture plates, to facilitate the long-term culture of spheroids in culture without aspiration. The device confines spheroids in a 3D space, providing the convenience of adherent cultures in a suspension culture. The second purpose is to present a methodology for the rapid extraction and estimation of calcium spikes from a large amount of confocal imaging data with minimal human supervision.
Materials and Methods
Device Fabrication
Polydimethylsiloxane (PDMS) prepolymer was cast on a silicon wafer in a polystyrene petri dish to a height of about 10 mm and cured at 72 °C for at least 2 h. The resultant PDMS blanket was oxygen plasma-treated for 2–5 min, treated with tetrachlorosilane, and kept under vacuum overnight to facilitate PDMS release later in the fabrication process. Six-millimeter-diameter through-holes were made in the PDMS blanket using a biopsy punch to obtain a silane-treated PDMS blanket with through-holes. An alternative technique to create a PDMS blanket with through-holes involved casting PDMS prepolymer in a petri dish with 3D-printed cylindrical molds and treating the cured PDMS blanket with silane. Another PDMS blanket was used to collect 7–8 mm PDMS studs by punching holes in a thick PDMS blanket using 7 or 8 m biopsy punch or by filling holes, made in a silane-treated PDMS blanket using 3D-printed molds, with PDMS prepolymer. The 7–8 mm stubs were placed in a thin layer of PDMS prepolymer that was allowed to cure and was silane treated as described above. Pieces of nylon mesh (40-µm pore size) were laid on the 6 mm through-holes and the stubs (7–8 mm) used to fit the mesh into the through-hole, forming a cave-like structure. PDMS prepolymer was cast at the base of the mesh and cured, to support and preserve the mesh in the cave-like structure formed after its isolation from the PDMS blanket and stubs.
Neuronal Calcium Imaging and Data Acquisition
SHSY 5Y cells cultured as neurospheroids or monolayers on a Matek plate were loaded with 4 µM fluo-4 (F14201, Molecular Probes, Thermo Fisher Scientific, Waltham, MA USA), 0.01% Pluronic F-127 (P3000MP, Thermo Fisher Scientific,), and 1% probenecid (P36400, Molecular Probes, Thermo Fisher Scientific) in 2 mL of Hank’s balance salt solution (HBSS) and incubated for 1 h at 37 °C. The cells were incubated in HBSS with 1% probenecid for 45 min. Cellular calcium data were acquired by laser scanning microscopy through a 20× objective of an inverted microscope (Nikon Eclipse TE300) through a 505 nm long pass filter of a 488 nm confocal laser scanning unit. The images were acquired using SimplePCI (PCM 2000) software at a rate of 1.37 ± 2 frames per second.
Image Processing and Estimation of Calcium Spikes
Each image sequence was interpreted as a 3D image with x, y, and t coordinates. The goal of image processing was to extract a per-cell fluorescence intensity value as a function of time. Each individual time series was then subjected to further data processing to obtain the number of intensity spikes in the time series and thus the number of neuronal activation events.
Unless otherwise stated, all image processing steps took place in Crystal Image. 18 Crystal Image natively read the SimpleCPI cxd file, and the green channel was extracted. The main task of the image processing step was the unsupervised identification of the cell area of those cells that showed calcium activity. All images were prepared by subjecting each slice individually to an adaptive tristate median filter 19 to remove shot noise and runaway pixel values, followed by conventional 3 × 3 Gaussian smoothing in the spatial domain. A maximum intensity projection (MIP) of the stack was then computed. The MIP contained the highest local intensity at any given time during acquisition. Background regions and cells without calcium activity remained dark in the MIP, whereas cells with calcium activity appeared comparatively bright. Unsharp masking was applied to the MIP to make the background intensity more homogeneous and allow the application of a global threshold for cell segmentation. Segmentation was then performed with a hysteresis thresholding step, whereby the lower threshold was adjusted manually to obtain a visually accurate representation of the bright cell regions. This step was the only one that required user intervention. The result was a binary mask with white pixels representing the area of active cells and black pixels representing background or inactive cells. The boundaries of individual cells were further isolated by a watershed segmentation step and additional morphological erosion to increase the gaps between isolated cells. The resulting clusters of connected white pixels were labeled (i.e., numbered) and served to identify a per-cell ROI.
In each slice of the stack, the pixel intensities underneath each ROI were averaged, and the average intensity was used as the representative fluorescence intensity for the kth cell and for the discrete time (t) at which the slice was acquired. The resulting intensity time series Ik(t) were transferred as csv (comma-separated values) text files into MATLAB (MathWorks, Natick, MA) for the next step of signal analysis and peak detection.
First, we attempted to identify data sets with dominant trends that are indicative of rapid photobleaching or dye saturation defects. We hypothesized that signals that are dominated by attenuation through rapidly photobleaching and saturated signals would exhibit relatively low variability, quantified by their high-frequency content. Consequently, a low-pass-filtered version of the time series would show a low mean magnitude of relative error between the filtered and original signals. We therefore filtered each signal using a circular averaging filter (radius = 5) and a 41-point, fourth-degree Savitzky–Golay filter. 20 Signals were classified as defective when the normalized root mean square error due to circular averaging filtering was less than 3%, and the mean magnitude of relative error due to Savitzky–Golay filtering was less than 1%. Using these two criteria, data with photobleaching and saturation defects were archived without further analysis. Those data sets, with limited trends that were not excluded, were then subjected to baseline drift correction, followed by smoothing, spike detection, and spike quantification.
Local minima and maxima used for baseline estimation and spike peaks were extracted using open-source code (extrema, https://blogs.mathworks.com/pick/2008/05/09/finding-local-extrema/). The signal’s baseline was estimated by fitting a cubic spline through the local minima of each time series; the baseline calcium fluorescence was then removed by subtracting the estimated baseline from the signal. In the next step, time series were classified as having actual calcium spikes or noise. Spike noise classification was performed using a decision boundary based on the comparison of standard deviation (SD) and median absolute deviation (MAD). We hypothesized that, compared with noisy data, time series with calcium spikes have a higher relative error between SD and MAD. Using select training data sets, we established a decision boundary for classification of data with no spikes versus data with calcium spikes. Data were classified as having spikes if the relative error between MAD and SD was at least 0.6*SD; otherwise, the signal was considered noisy (physiological zero spikes, since the data were not classified as defective due to artifacts), and these data sets were archived without further analysis. The calcium traces classified to have spikes were then smoothed using a moving-average filter with a window length of about 5–9 s and normalized by their mean value. Spikes were defined as local maxima whose signal-to-noise ratio (SNR) was greater than 5 and had a height of at least 15% of the highest peak from the baseline. SNR was estimated as a ratio of local smooth signal to local MAD.21,22 Peaks that met this criterion were quantified as spikes. Raw spike data (csv file format) and their corresponding graphical plots were sorted and archived in folders with appropriate labels for convenient reference.
Results
Design and Fabrication of Spheroid Trap
Here we demonstrate a simple device design, which can be fabricated in any cell culture laboratory with basic PDMS fabrication capability. As illustrated in Figure 1a , the device is made of an invaginated liquid-permeable membrane structure whose pore size is smaller than the targeted spheroid diameter, such that spheroids are trapped in the confines of the structure while allowing the exchange of nutrients. This facilitates medium changes and washing without losing cells. The shape of the structure is reinforced via a silicon base. The device can be integrated in conventional cell culture platforms, such as MatTek and multiwell plates, by appropriate bonding techniques, such as oxygen plasma bonding. During culture, the structure is partially submerged in medium, and spheroids are added via the opening at the top. We utilized a nylon mesh of 40 µm pore size (which is commercially available for cell straining) and attached it to a MatTek plate through a PDMS base. The procedure for the fabrication of this device is illustrated in Figure 1b . Briefly, to shape porous nylon mesh into cup-shaped structures, pieces of the mesh were cut and laid on top of through-pores in a thick, silane-treated PDMS blanket (7–10 mm thickness). PDMS stubs were force-fitted into the pores to hold the mesh in a budded shape, leaving a small piece of the mesh exposed in a 1–2 mm clearance between the base of the stub and the PDMS blanket. A PDMS prepolymer was cast at the base of the assembly and allowed to flow into clearance. Note that it is important that the diameter of stubs is larger than the diameter of the through-holes to avoid PDMS prepolymer from rising beyond the clearance and potentially clogging the whole mesh. On curing, the thin PDMS membrane in the clearance tucked the nylon mesh and reinforced it to retain the budded shape. The mesh, now tucked in a PDMS base, was retrieved and an opening was made at the top of the mesh structure using a 4 mm biopsy punch. The structure was bonded to a glass-bottom culture plate using oxygen plasma bonding. Figure 2a shows pictures of the spheroid trap bonded to a glass coverslip. We sterilized the assembly by spraying it with 70% ethanol and leaving it to dry under UV light overnight.
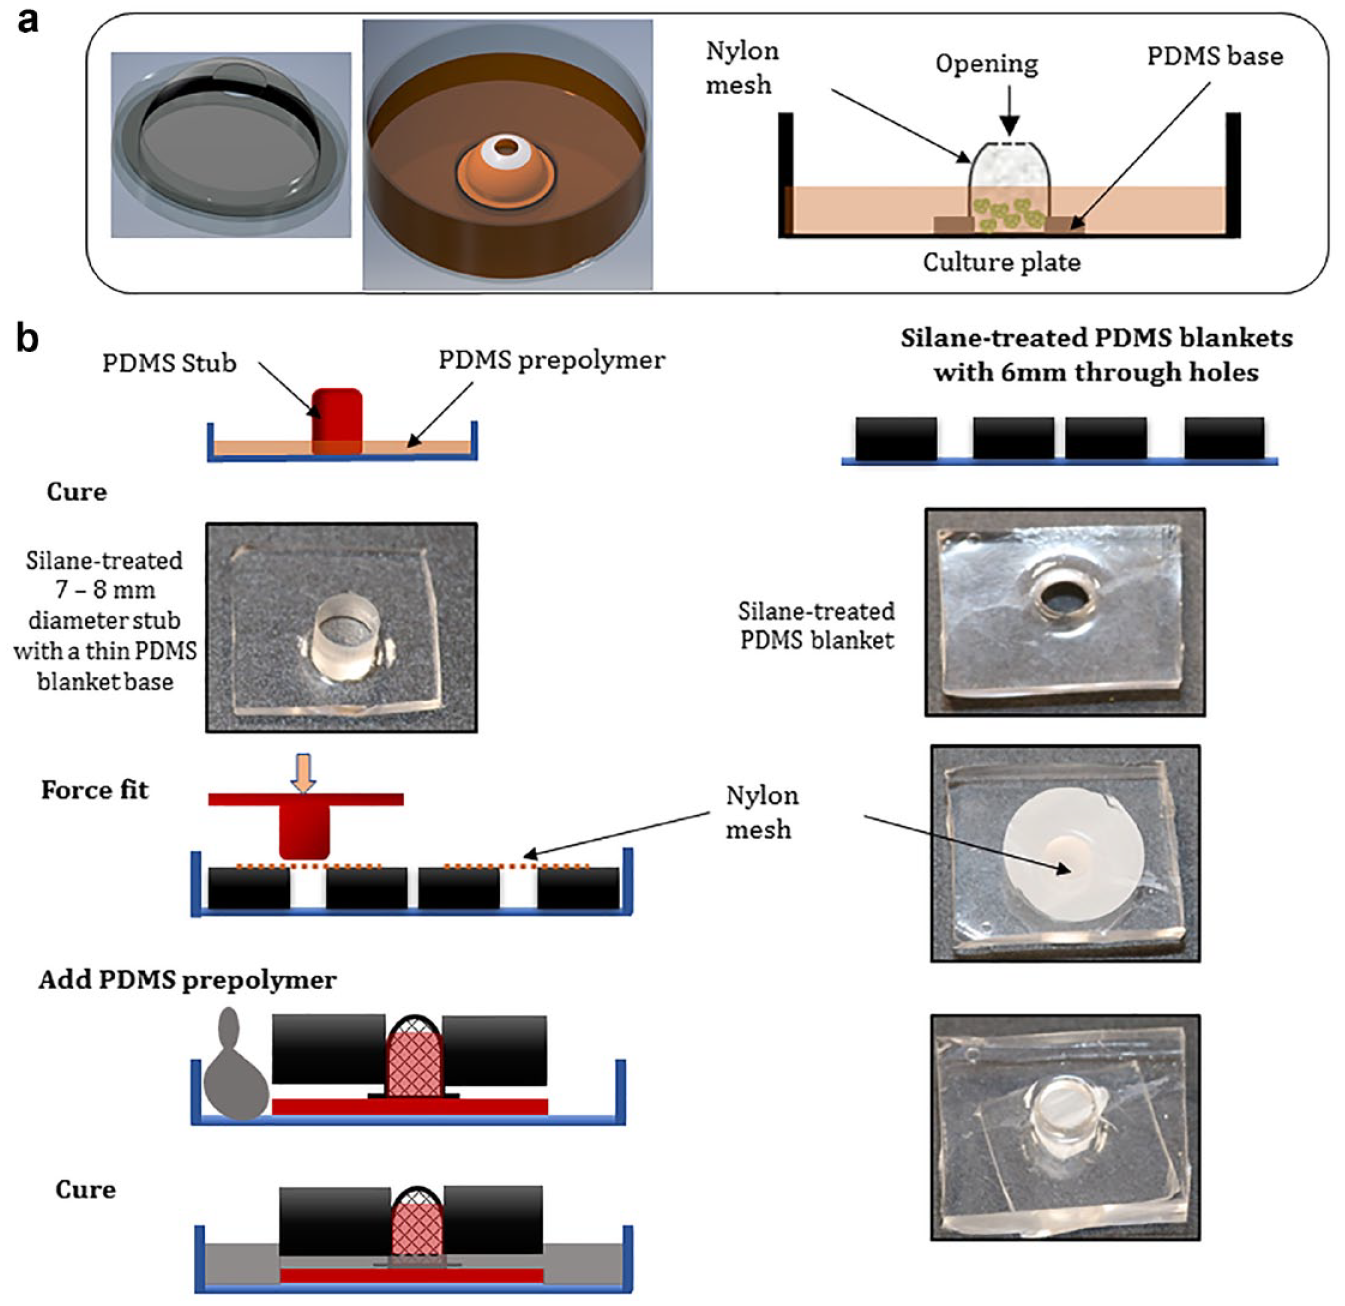
Spheroid trap design and fabrication. (a) To the left, a computer model of a spheroid trap; the inset in the middle demonstrates how the device may be incorporated into a tissue culture plate, and as illustrated (inset extreme right), spheroids are seeded via the opening at the top of the device and medium partially filled to keep spheroids confined in the mesh. (b) Schematic illustrating the fabrication process.
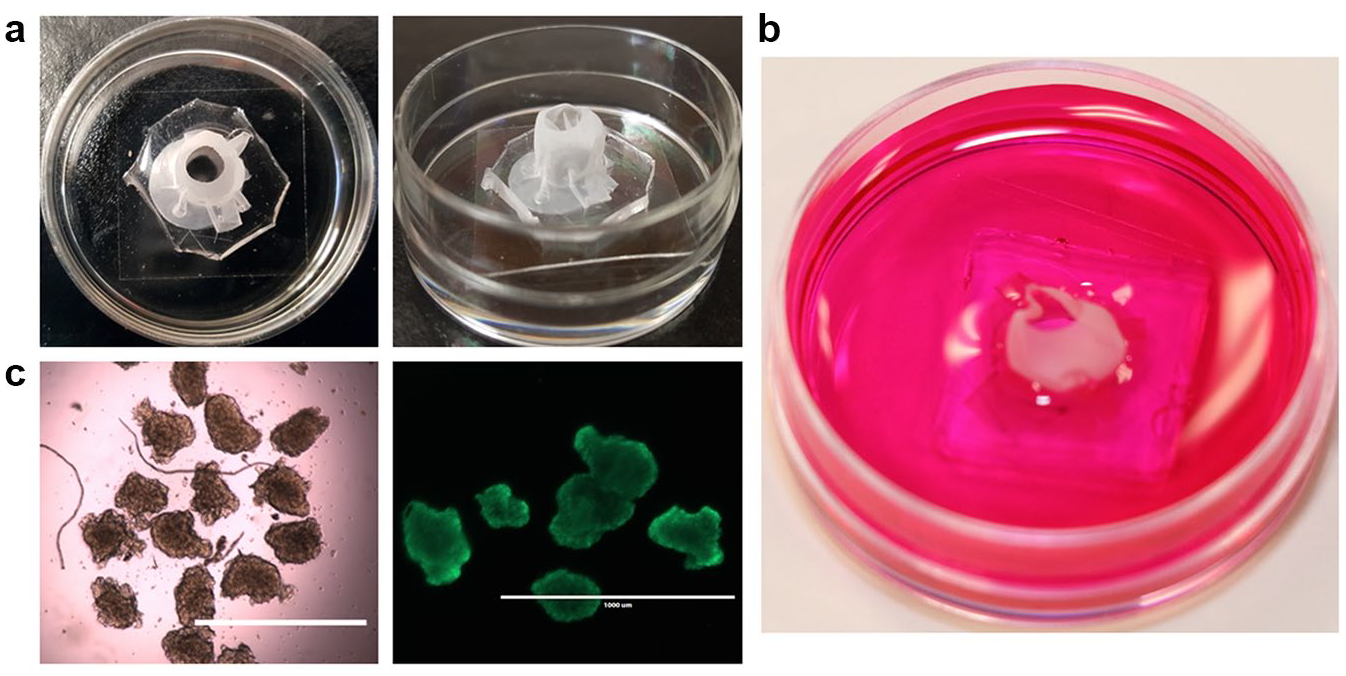
Cell culture in the device. (a) Pictures showing top and side views of the spheroid trap in a 35 mm MatTek plate. (b) Picture showing the device in a 35 mm plate after adding medium. (c) Bright field image of spheroids (left) and fluorescent image of spheroids stained with calcein AM (right) to illustrate compatibility of the device with common imaging techniques. The scale bars are 1000 microns.
Spheroid Culture and Staining in the Spheroid Trap
To use the spheroid trap for cell culture, spheroids were formed by aggregation of about 1000 SHSY 5Y cells suspended in 30 µL hanging drops of medium, arrayed on polystyrene petri dish lids, for 3 days. Medium was added to the plate in which the spheroid trap was previously integrated and filled to about a half of the height of nylon mesh (illustrated in Fig. 2b ). The spheroids were then transferred into the spheroid trap via the opening previously made in the nylon mesh. This confined the cells and facilitated culture of suspended cells for an extended period without any loss (100% trap efficiency) of spheroids. One of the challenges for 3D culture platforms, such as scaffolds and hydrogels, is limited light transmittance, which renders cultures in these materials incompatible or inconvenient in assays that require live optical microscopy. We checked our construct for compatibility with bright field imaging and immunofluorescence; as shown in Figure 2c , this spheroid trap did not interfere with either bright field or fluorescent imaging. Since the cells were confined in a small area, the device eliminated the delicate handling requirements of suspension cells; the cells were treated like adherent cells during both medium changes and washing during staining assays. Importantly, this spheroid trapping method prevented the loss of spheroids due to aspiration in prolonged cultures.
Computer-Aided Definition of ROIs in Calcium Imaging Data of 3D Cultures
In this section, we report the performance of a computer-aided technique for the definition of ROIs. Spheroids and monolayer-cultured cells were stained using Fluo-4 calcium dye and calcium dynamics recorded by confocal microscopy. Typical calcium image sequences recorded contained about 800–1000 frames on average. The image sequences were analyzed using the steps summarized in
Figure 3a
. Briefly, the technique involves derivation of the MIP image of the sequence, which is used as a representative image of the image sequence in the segmentation of cell bodies instead of tracking the intensity of individual pixels in the entire image sequence, as in principal component analysis (PCA)-based techniques. Compared with individual frames in the image sequence (
Fig. 3b(i)
), the MIP images enhanced distinction in features and delineated cell boundaries in both sparse tissue and dense tissue, which we demonstrate with projections of a calcium image sequence acquired from cells cultured in a monolayer (2D) and spheroids (3D) in
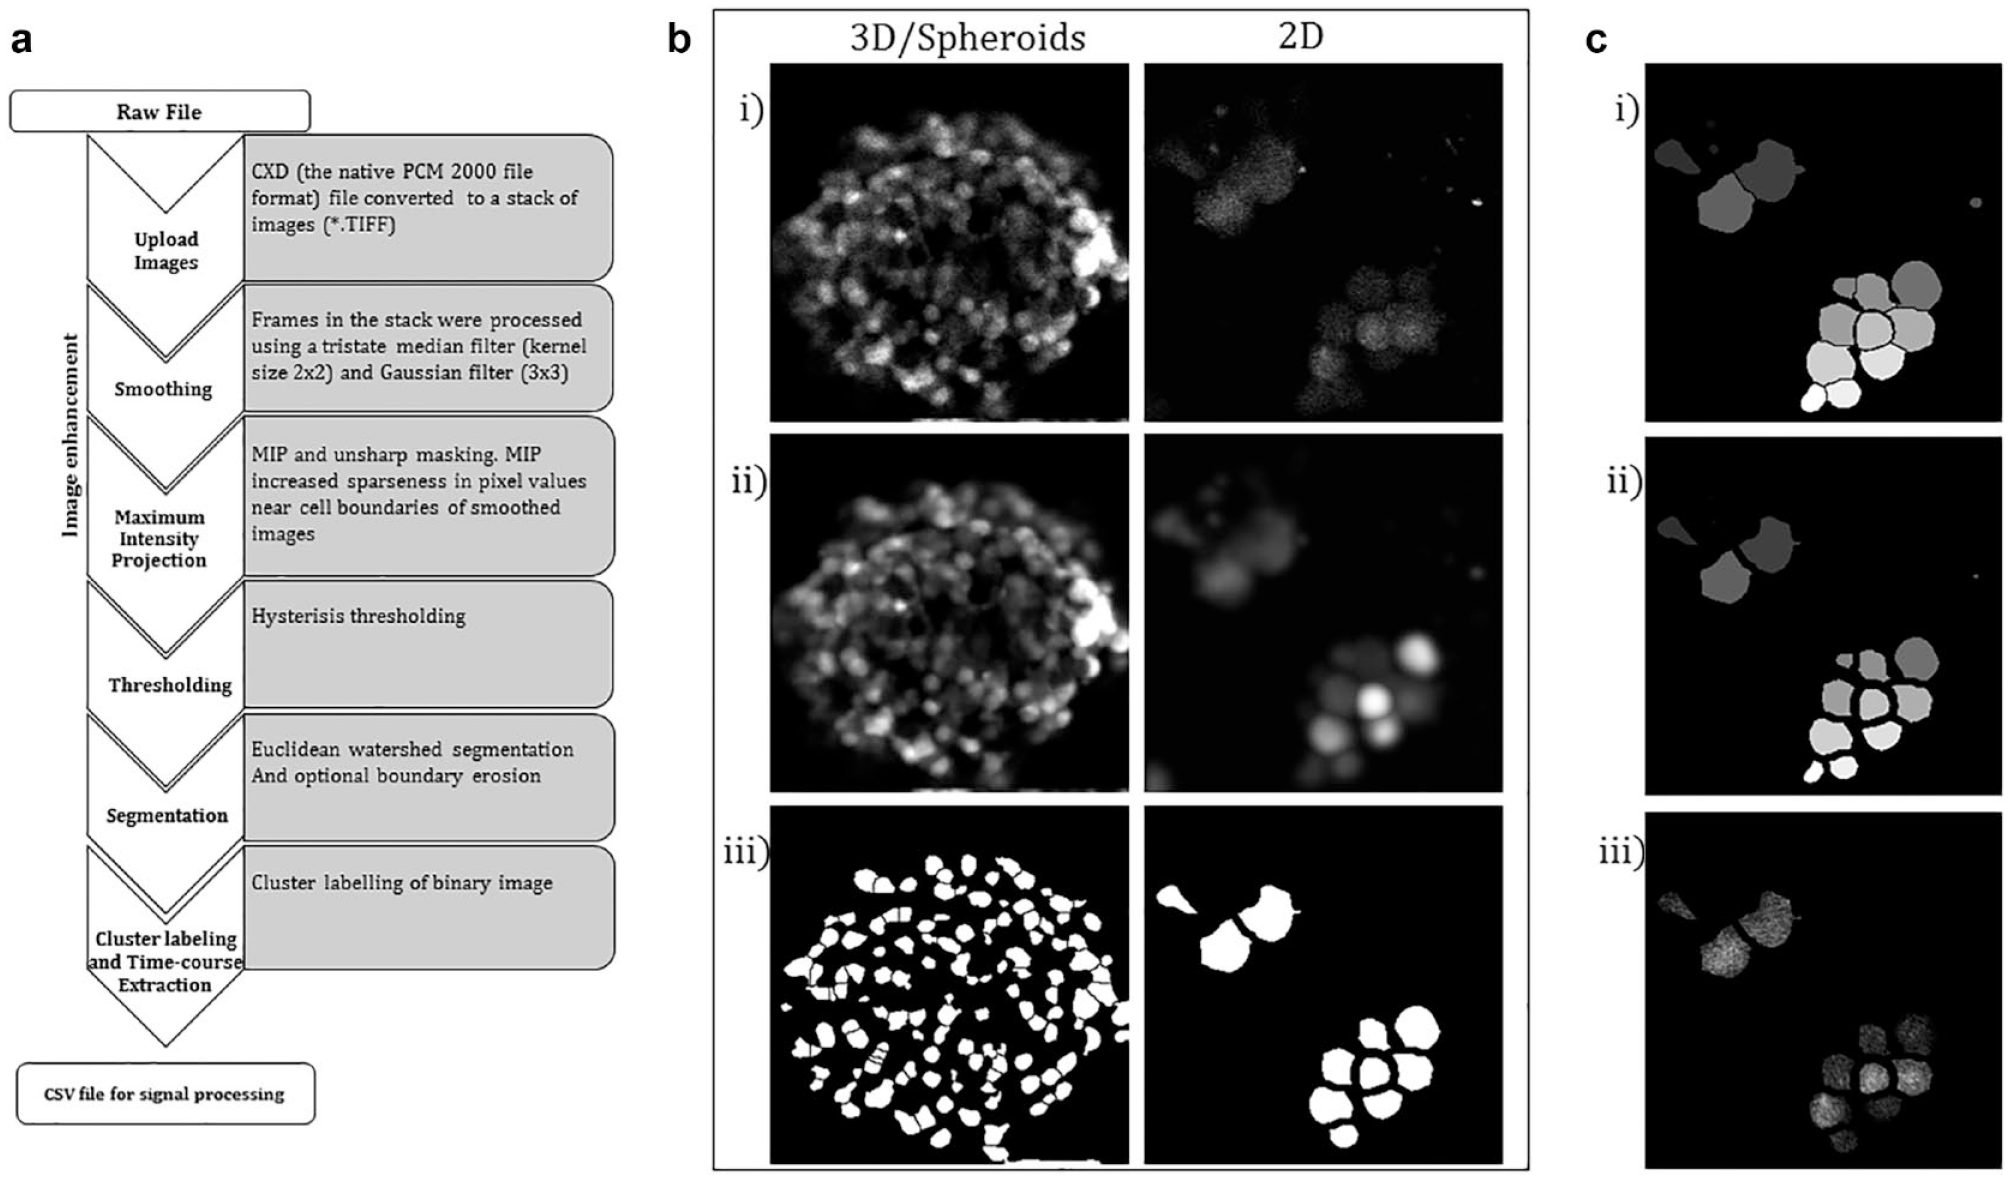
Image processing and calcium signal extraction. (a) Flow diagram showing operations used to create ROIs and extract calcium florescence signals. (b) The insets illustrate the results obtained using Crystal Image software, from 2D (right) and 3D (left) cells, at select points: (i) the top-most image frame in a stack of spatial-temporal calcium data obtained from confocal imaging of SHSY 5Y cells, (ii) results of the MIP of the stacks (the MIP operation was preceded by medium and Gaussian filtering), and (iii) binary masks obtained after thresholding and segmentation. Areas with a pixel value of 1 define an area encompassing a single cell; the masks were appended to the raw image stack and mean florescent data were extracted from each region. (c) Results obtained after processing a 2D stack for (i) watershed segmentation, (ii) boundary erosion, and (iii) the top-most frame after appending the binary mask.
Data Sorting and Spike Detection
Because our ROI definition technique does not track changes in individual pixel values through the entire image sequence, all cells whose MIP was above the set threshold were preserved in the thresholding and segmentation step, and their calcium fluorescent data were extracted without prior knowledge of the quality of the data. Therefore, the first part of the signal analysis process (whose architecture, along with typical outputs, is presented in Fig. 4 ) served to classify and eliminate data with photobleaching and saturation defects ( Fig. 4a ), as well as data with mere noise but no spikes ( Fig. 4b ). Spikes were quantified in the rest of the data after baseline correction, smoothing, and intensity thresholding and reported as shown in Figure 4c . As demonstrated with noisy data in Figure 4b and the trace with spikes in Figure 4c , a cubic spline fit was sufficient in estimation of the signal baselines. To facilitate the rapid analysis of large-scale calcium data and postanalysis referencing, the documentation feature of our analysis archived both raw data (csv file format) and their corresponding graphical plots in folders. The folders were labeled to indicate the data set analyzed, as well as to classify contents, indicating whether the data were analyzed for spikes or removed due to imaging defects, as demonstrated by Figure 4d (a larger version of this inset is also provided in Suppl. Fig. S2 ).
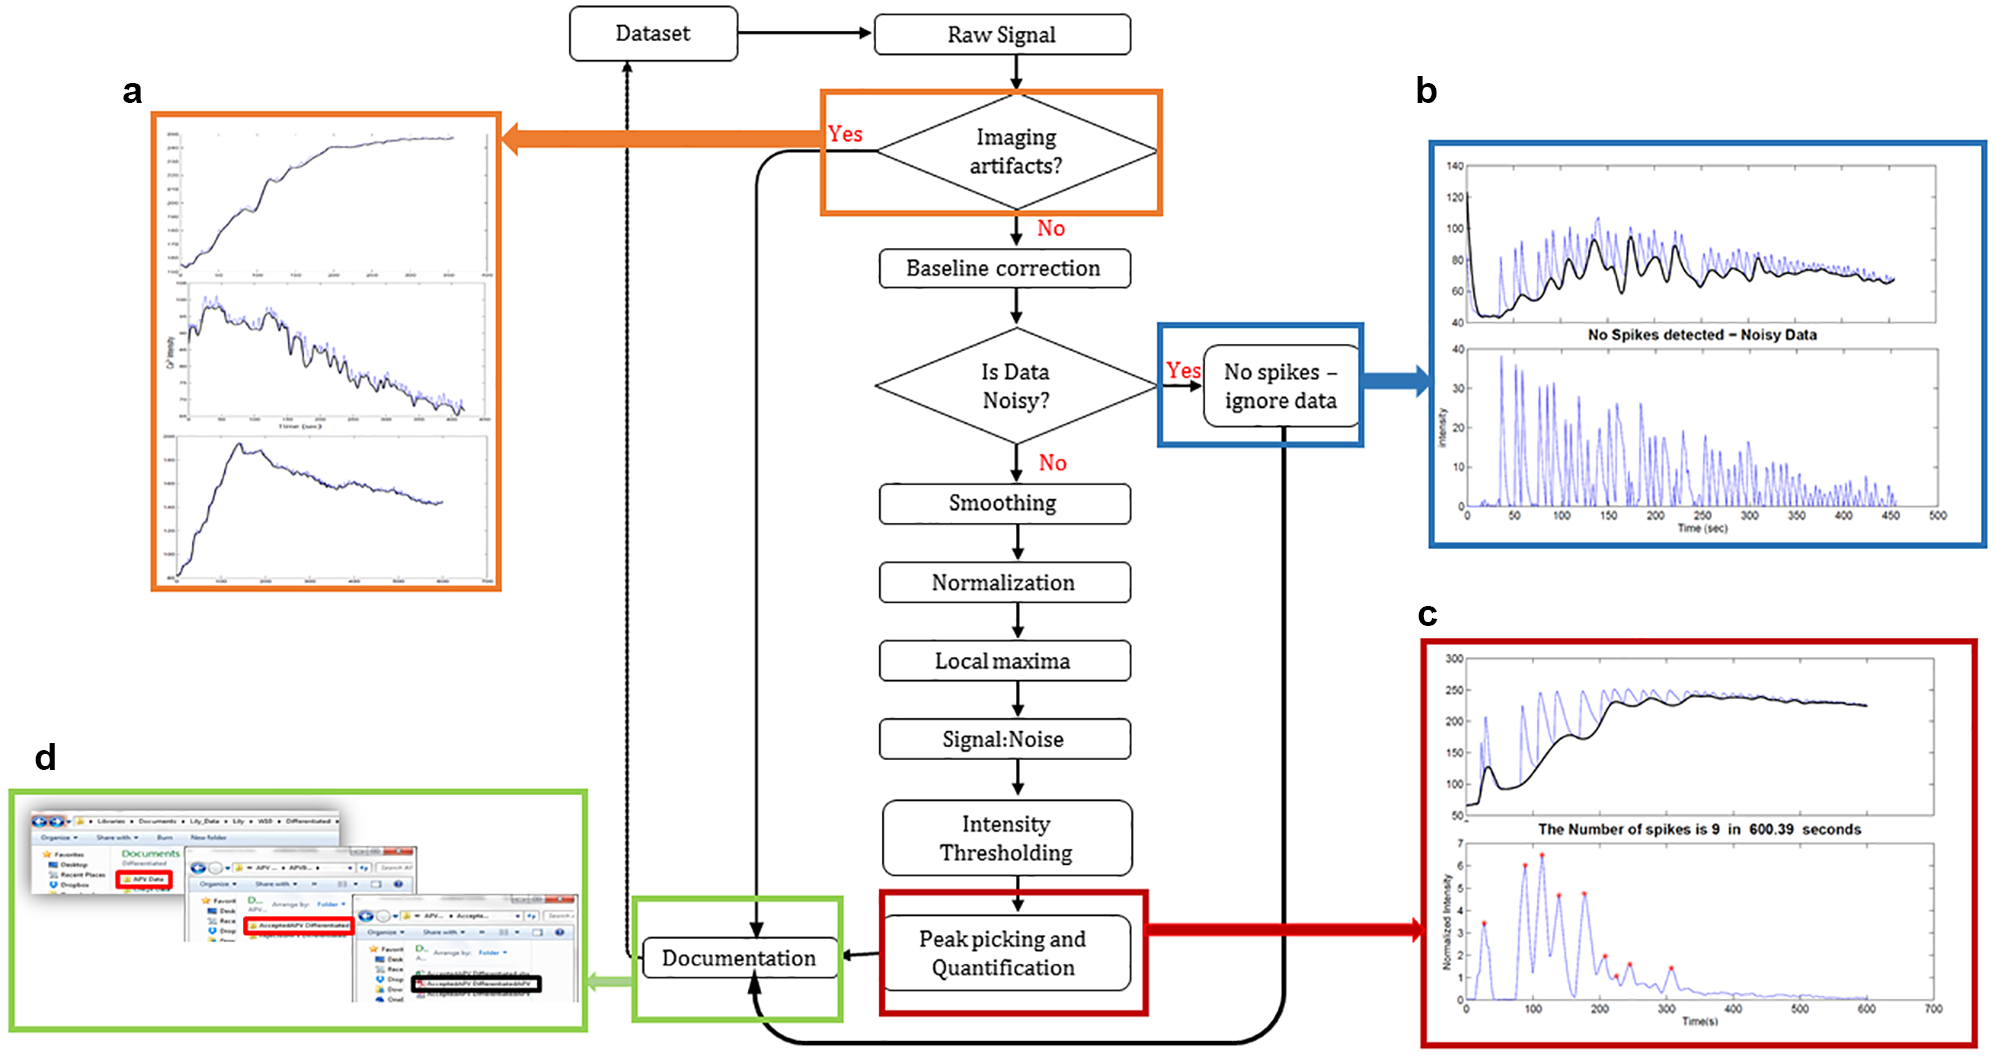
Calcium signal processing flowchart. This software takes in data sets in a spreadsheet of calcium florescent data, sorts for imaging artifacts (rapid photobleaching and saturation), adjusts the baseline of the signal, sorts out data with a low chance of spikes, attenuates noise by soothing, and subjects the signal to spike quantification. The results are compiled in appropriate documents and organized in folders. (a) Samples of data classified to have rapid photobleaching and saturation defects. (b) Noisy data. The black plot is the baseline fitted to the signal. The inset at the bottom shows the signal after baseline correction. (c) Data before and after spike quantification. (d) Illustration of how the software creates folders for each data file showing separate folders for processed data and defective data. The folders contain raw data and plots giving insights of the data.
Discussion
Herein, we demonstrated complementary tools to facilitate automation of suspension 3D neuronal culture. First, we presented a spheroid trap to facilitate retention of spheroids in culture over prolonged times. Tong et al. 13 described a design to promote long-term spheroid culture based on the concept of spheroid trapping as well, but our design is significantly easier to implement and allows accessibility to spheroids during culture. The device confines suspended cultures in a small area during culture, eliminating the need for delicate care to prevent suction of spheroids during medium changes and tissue preparation steps, which require the quick addition and disposal of liquid from the culture. Second, we describe a method for the rapid extraction of calcium fluorescent spikes from confocal imaging data of 3D microtissues and its subsequent analysis. Calcium is a ubiquitous signaling molecule in tissues, including nerve and glia tissue, cardiac tissue, and smooth muscle cells. It mediates important physiological processes ranging from instantaneous processes, such as muscle contraction, membrane excitability, learning and memory, and neurosecretion, to slower processes, such as gene transcription, cell/neurite growth, synaptogenesis, cell migration, and apoptosis. The dynamics of intracellular calcium in tissue are of fundamental importance to general physiology and pharmacology. Therefore, rapid analysis of calcium data may have significant implications to high-throughput assays, which utilize calcium dynamics.
The analysis of large calcium imaging data poses challenges in the identification of cell locations, extraction of calcium signals, and detection of neuronal spikes. 17 This has inspired a body of work utilizing wavelet-based,32,33 Fourier-based,34,35 and model fitting-based 36 techniques for quantification on calcium spikes. To adapt these techniques for high-throughput screening, automated signal analysis techniques ought to be combined with image processing techniques for the cell extraction of spatial-temporal calcium data from 2D frames. However, very few studies have demonstrated automated calcium spike quantification, including procedures for computer-aided cell recognition and signal extraction from confocal imaging data without manual ROI identification. Moreover, this work has only demonstrated cell segmentation in isolated calcium events, where calcium events are punctated and diffused, 37 or in monolayer cultures;38,39 however, the identification of cell bodies in image frames of dense 3D tissue has not been explored.
We suggested an approach based on the MIP image of an image sequence to identify cells in dense microtissues. A major advantage to this approach is the ability to identify cell bodies using a single image frame—a less computationally expensive technique compared with PCA-based segmentation, which utilizes spatial comparison of pixel values in individual frames to track and identify cell bodies. 17 On the other hand, because our technique does not utilize any spatial information of pixels defining cell bodies, it is limited to the segmentation of stationary cells. The suitability of technique for the analysis of large data sets is due to its ability to integrate almost all aspects of data analysis (rapid upload of data, identification of cells, extraction of calcium signals, detection and quantification of neuronal spikes, and lastly, sorting and archiving) in a process that requires minimal human supervision. Importantly, the algorithms used in this technique are available in open-source image processing software such as Crystal Image and ImageJ (NIH, Bethesda, MD) and can be implemented in Python and MATLAB. In addition, these protocols may be customized, by changing the smoothing window, decision boundaries, intensity, and/or SNR thresholds to suit different data sets or meet different demands.
Supplemental Material
Supplemtantal_Material_for__Spheroid_Trapping_and_Calcium_Spike_Estimation_by_Ndyabawe_et_al – Supplemental material for Spheroid Trapping and Calcium Spike Estimation Techniques toward Automation of 3D Culture
Supplemental material, Supplemtantal_Material_for__Spheroid_Trapping_and_Calcium_Spike_Estimation_by_Ndyabawe_et_al for Spheroid Trapping and Calcium Spike Estimation Techniques toward Automation of 3D Culture by Kenneth Ndyabawe, Mark Haidekker, Amish Asthana and William S. Kisaalita in SLAS Technology
Footnotes
Supplemental material is available online with this article.
Declaration of Conflicting Interests
The authors declared no potential conflicts of interest with respect to the research, authorship, and/or publication of this article.
Funding
The authors received no financial support for the research, authorship, and/or publication of this article.
References
Supplementary Material
Please find the following supplemental material available below.
For Open Access articles published under a Creative Commons License, all supplemental material carries the same license as the article it is associated with.
For non-Open Access articles published, all supplemental material carries a non-exclusive license, and permission requests for re-use of supplemental material or any part of supplemental material shall be sent directly to the copyright owner as specified in the copyright notice associated with the article.