
Abstract
Collective migration is an important cellular trait, which is intensely studied by both basic and translational researchers. Investigation of the underlying mechanisms necessitates high-throughput assays and computational algorithms capable of generating reproducible quantitative measurements of cell migration. We present a desktop tool that can be used easily by any researcher, to quantify both fluorescent and phase-contrast images produced in the course of commonly used gap closure (“scratch,” “wound healing”) collective migration assays. The software has a simple graphical interface that allows the user to tune the relevant parameters and process large numbers of images (or movies). The output contains segmented images and the numerical values inferred from them, allowing easy quantitative analysis of the results.
Introduction
Collective cell migration is a phenotypic behavior of high interest, mainly because of its relevance in physiological processes such as embryonic development, but also pathological processes such as cancer.1,2 Migration involves many types of biochemical processes (e.g., signaling, transcription, and trafficking), and hence it is assumed to be highly regulated. To understand this complex cellular behavior, it is essential to discover the molecular components that control it. In terms of experimental biology, collective cell migration is a “clean,” well-defined phenotype; a group of cells moves in a coordinated fashion in the same direction. The typical time scale of the migratory response is minutes to hours. A common approach in cell biology is to perturb the system and test the phenotypic effect of the perturbation. Perturbations may include physiological stimuli and exposure to pharmaceutical compounds or other chemicals, along with genetic interference such as forced expression of genes, RNA interference (RNAi), and so on. Assessing the phenotypic effects of such perturbations necessitates measuring collective cell migration in a quantitative manner. To do this reproducibly and reliably in a high-throughput setting calls for automated processing, done in a consistent way over a large set of images. The characteristics of the images may also vary (e.g., due to different microscope settings or to position effects) for images obtained from different wells of the same sample plate. Hence, an algorithm for analysis of such images must be robust against these and similar sources of variation. A widely used collective migration assay comprises a monolayer of cells with a gap clean of cells (also known as a wound-healing assay). The gap can be created either by a scratch or by growing the cells over a plastic insert that is removed just before the assay starts. Following stimulus and scratching at time t = 0, the cells start to close the gap, and images are taken at preset time intervals, using either fluorescent or phase-contrast microscopy. Detecting the gap width is usually easier in fluorescent images, but it involves expression of a fluorescent protein or treatment with a fluorescent dye, often creating problems such as bleaching and toxicity caused by the illumination. On the other hand, phase contrast is much easier to obtain but more difficult to analyze. Our analysis of images obtained by phase-contrast microscopy allows efficient investigation of primary cells that do not express fluorescent markers. The aim of the analysis is to obtain, for both types of microscopy, quantitative time-dependent information on various aspects of the process (e.g., gap width vs time). We present a simple desktop tool that uses as input large sets of images and performs on them quantitative analysis of collective cell migration.
Built-in Software
Neither of the two screening microscopes used by us (Olympus ScanR [Olympus, Center Valley, PA] and ImageXpress Micro [Molecular Devices, Sunnyvale, CA]) provides built-in modules for the kind of analysis presented here. The Olympus software can be used to perform cell-wise analysis but not segmentation of the whole image, and no tools are provided to automatically merge the individual images of each well to a single image, so it is not possible to quantify scratch areas with the Olympus ScanR analysis software. The software of Molecular Devices can be used to analyze the so-called Oris cell migration assays, which start with a circular area free of cells in the middle of the well, caused by silicon stoppers that are located in the well before seeding. 3 Using the corresponding plates would have been, however, much more expensive than our way of using a robot to generate the scratch. To analyze scratch assays, the user must develop his or her own algorithm.
Related Work
Several existing published methods and tools address the same problem. CellProfiler (http://www.cellprofiler.org/) is a general software not dedicated to scratch assays and uses image brightness and hence is less efficient for identification based on brightness-independent (e.g., texture based) features. TScratch 4 and a recently introduced support vector machine (SVM)–based method 5 use advanced algorithms to analyze images in a brightness-independent manner. They were designed for phase-contrast microscopy (and hence will not perform well for fluorescent images). Furthermore, both set the threshold in an automatic but image-dependent way, whereas qCMA determines the parameters of the algorithm in a more uniform fashion in the course of a training session (see below).
Materials and Methods
Implementation
The software is implemented in MATLAB (MathWorks, Natick, MA); the stand-alone version can run over Windows, MAC, or LINUX and is freely available online (see URL in the abstract). We include a preliminary separate optional step called MERGE WELL that merges subimages taken from the same well, by high-magnification microscopy, into a single image. The resulting image is the input for our application, qCMA, which quantifies the gap width via a simple graphical user interface (GUI) ( Figure 1 ) for fluorescent or phase-contrast microscopy through the following steps:
Input image is converted to gray-scale.
Image is converted to binary, employing a threshold parameter that is determined by the user in the course of a training session. Here lies the main difference between fluorescent and phase contrast: In fluorescent images, the threshold is taken directly on the gray-scale matrix (intensity-based threshold), whereas in phase contrast, it is taken on the local standard deviation matrix (texture-based threshold).
Binary image is processed to get clear separation between regions containing cells and the gap. This is done in a sequence of procedures: median filtering, morphologically close, filling holes, and removing small objects.6,7
Calculate the average gap width (AGW) and identify boundaries, according to Figure 2B , C .
The user can save (optionally) the segmented image (and movie) and store gap width data (as a line of a text file).
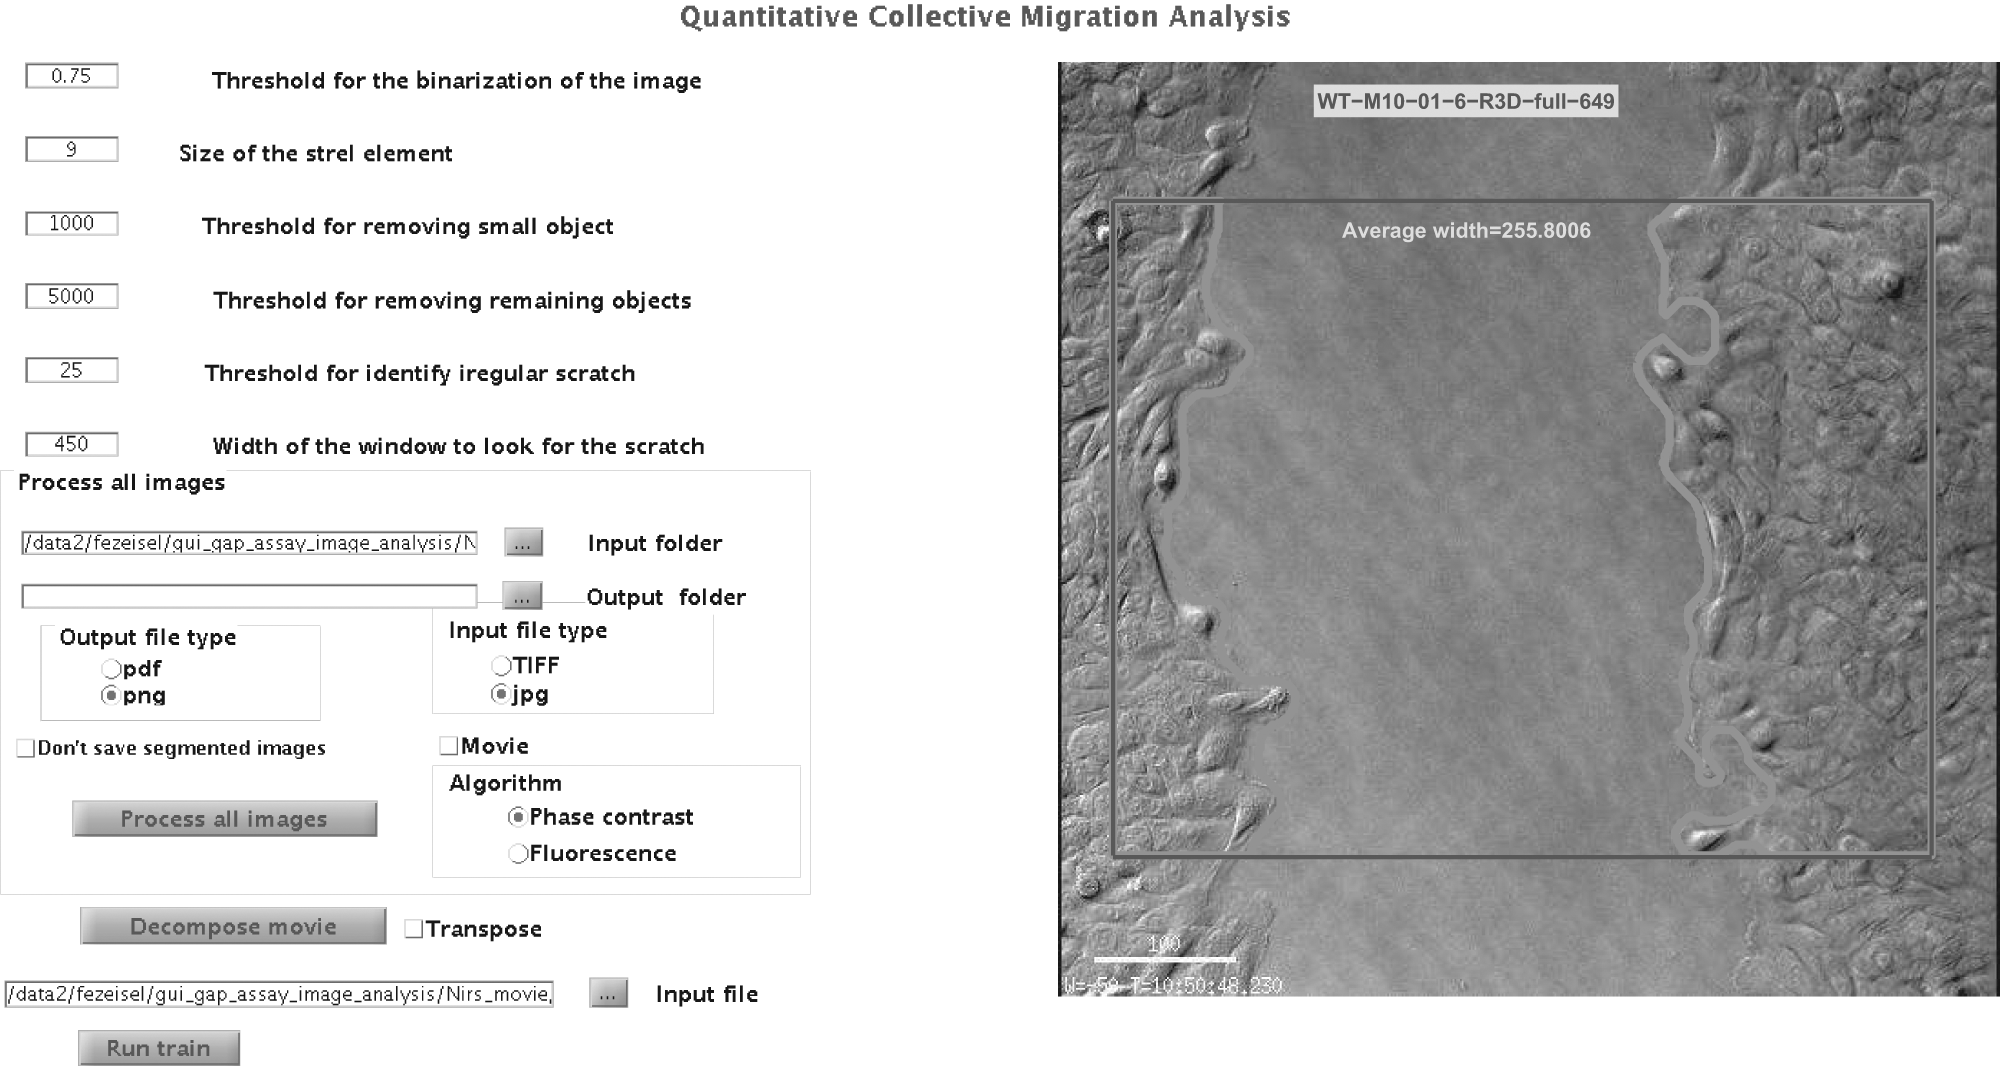
Graphical user interface (GUI) of the software: The parameters’ setting and the running options appear on the left side of the GUI. The right side is devoted to show the results of a training session; here we show an example of a typical phase-contrast image.
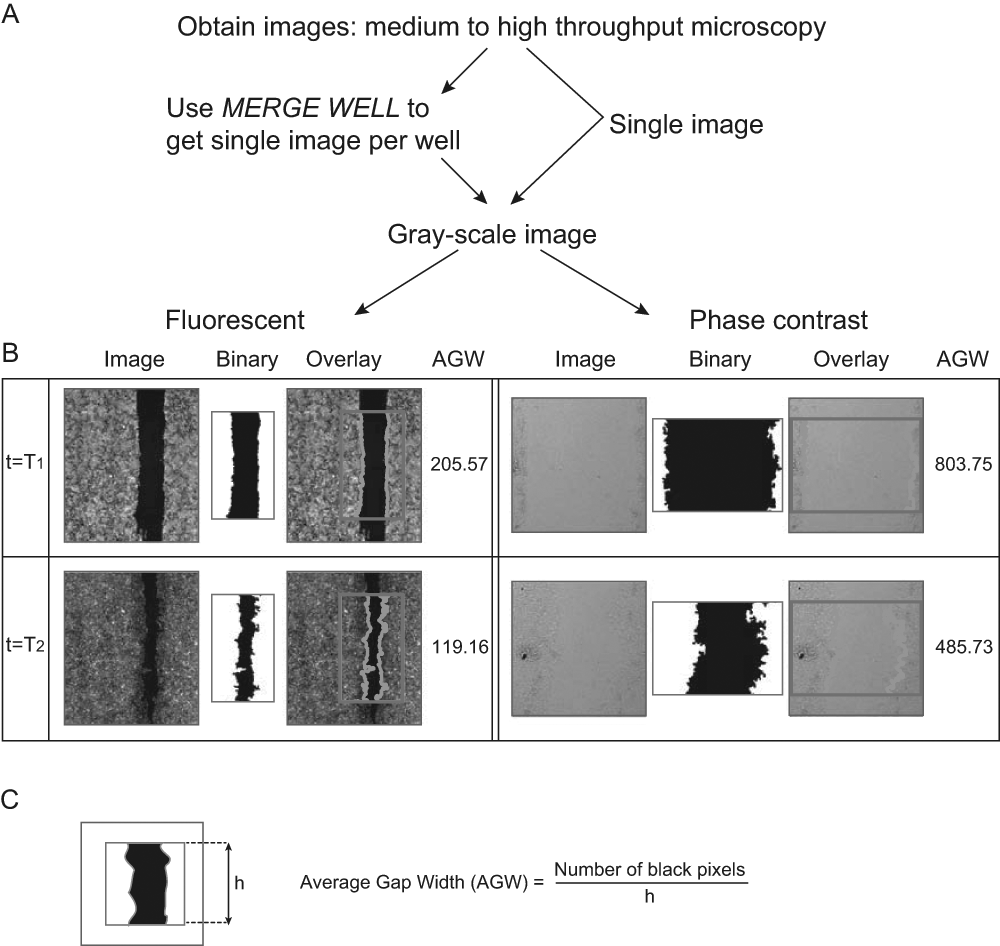
Software outline: (
All processing is done on the part of the image contained within a frame (marked red in Fig. 2B ). Although the height of the framed region is fixed at 70% of the full image (15% from the upper and lower edges are discarded), the width is defined by the user. The left/right position of the frame is set to place the gap at its center. Using the frame is important to eliminate confounding effects caused at the boundaries. Six input parameters are used (see supplementary information for details). The user tunes the relevant parameters on his or her own images in a training session, initialized with the default values.
Work Flow
Obtain images from either fluorescent or phase-contrast microscopy.
If needed, merge sub-images to one image with MERGE WELL.
Prepare an input folder, containing either a movie or a set of images.
Define your output folder.
If you have a set of images, go to step 6. For a movie, (a) Choose the movie file in the input file field. (b) Press “decompose movie,” to produce an image from each frame and store it in your output folder (note that at this stage, it is recommended to set the input and output folder to be the same).
Training session: initialize the parameters (default values are provided), choose a typical image as your input file, and train by pressing “Run train”; modify parameters and repeat. It is recommended to train on a few images along the set.
Set your favorite output file type.
Optionally select “don’t save segmented images” (preferred mode for very large sets of images—this will substantially reduce running time and storage requirements).
Press “process all images” to run over all images in the input folder. This will save into the output folder the individual segmented images (or a movie of segmented images) and a single text file with the numerical results.
Results and Discussion
We developed efficient, freely available software for quantitative analysis of collective cell migration that is easy to use on a desktop computer. qCMA has several advantages over those available software packages of which we are aware (e.g., TScratch, WinScratch). The advantages are as follows: (1) qCMA was designed to analyze images obtained using both phase-contrast and fluorescent microscopy. (2) We included a training session, which enables the user to optimize the parameters according to the conditions of the available images. The idea underlying our approach is that to make a fair comparison of different images within a data set (or movie), it is better to use the same set of parameters (without sacrificing trivial intensity dependence). We achieve this by allowing the user to set the parameters of the algorithm in the course of a training session that uses as input a few of his or her images, representative of the quality and conditions of his or her data set. (3) The software was designed to analyze a subframe of the image, which helps to avoid boundary effects, without manipulating the image. (4) An easy-to-use interface enables the users to perform their analysis of movies and large data sets in a simple way, with relatively short running time and with a consistent set of parameters.
The running times (on a desktop computer, Intel i7 2.9 GHz, 64-bit 4-GB RAM, running on a single processor) were as follows: (1) For a data set of 528 fluorescent images, TIFF files, 1076 × 1230, 1.3 MB: 667 s (including saving all segmented images)—about 3000 images/h. Without saving the images, the running time was 400 s, 4700 images/h. (2) For a movie of 721 phase-contrast images (jpg files, 518 × 514, 50 KB each), the running time was 335 s when all segmented images were saved (~7700 images/h; without saving the images: 160 s [~16 200 images per hour]). As one can see, running time is strongly affected by the image size and not only by the number of images, and hence working with higher resolution increases running time.
We used this tool for analysis of siRNA screens in a 96-well format (Olympus ScanR microscope), where high-magnification subimages were taken using a fluorescent dye. The assay is based on mammary epithelial MCF10A cells transfected with siRNA and stimulated with epidermal growth factor (EGF) after a scratch is made using a robotic arm. In this assay, hundreds of oligonuleotides were screened at a few time points with multiple replicates, to assess their effect on migration. Having an automated and efficient pipeline was a must to analyze such a large data set in a consistent way. Some results of the control wells of the siRNA screen, using the fluorescent dye, shown in Figure 3A , span the entire range of observed gap-closing speeds. These measurements demonstrate the range of speeds that can be measured by the scratch assay.
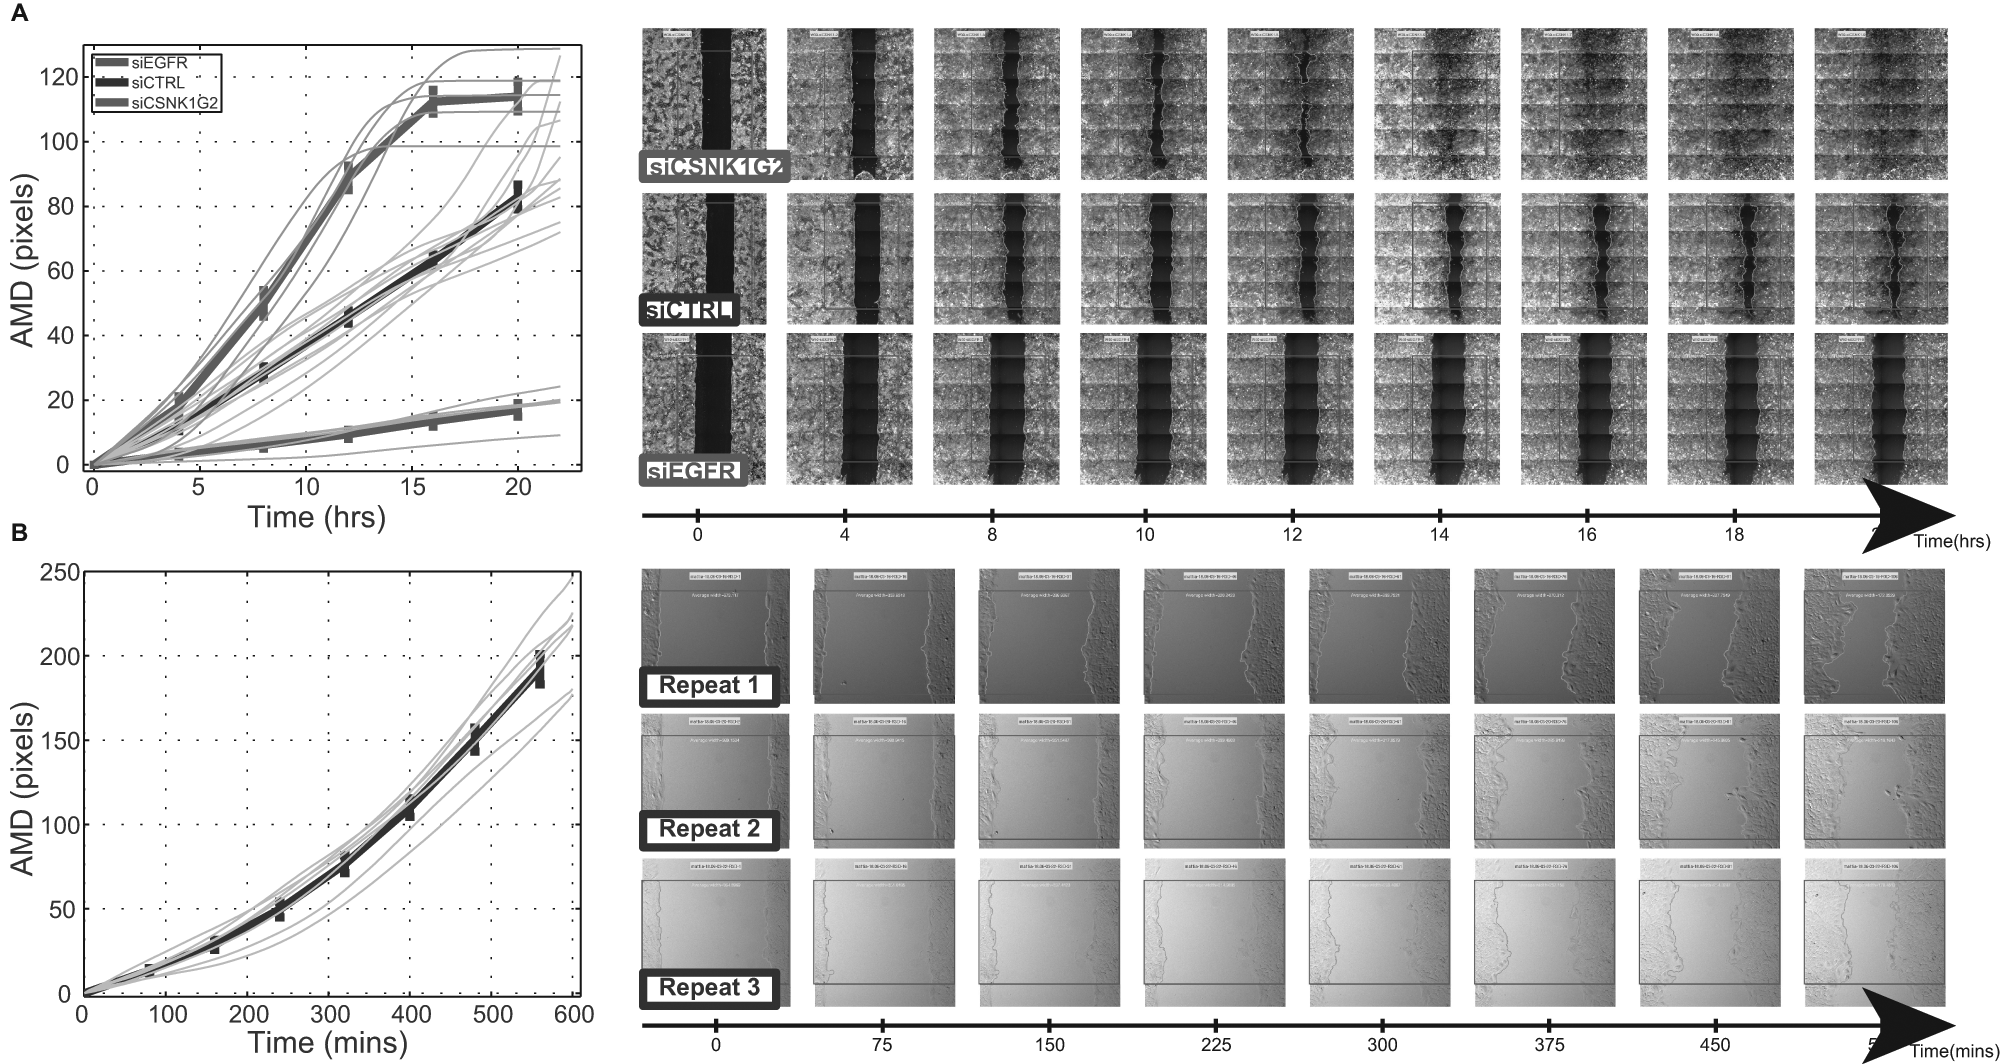
Application of the software: (
We used the software also for analysis of movies obtained by DeltaVision (Applied Precision Inc, Issaquah, WA, USA) time-lapse differential interference contrast (DIC) light microscopy. This is a low-throughput assay (done in an 8-well format using a wound-healing assay from ibidi, Martinsried, Germany). Here the temporal resolution is 5 to 10 min, which allows exploring the kinetics of different treatments. We show in Figure 3B an example of such quantitative results obtained from this assay, demonstrating the reproducibility of the quantification over different experimental conditions, such as light and cell density.
Footnotes
Declaration of Conflicting Interests
The authors declared no potential conflicts of interest with respect to the research, authorship, and/or publication of this article.
Funding
The authors disclosed receipt of the following financial support for the research, authorship, and/or publication of this article: Supported by the German Research Foundation (DIP), the DKFZ International PhD Program (CK), the AIRC and Marie Curie Actions (ML), the Linda and Michael Jacobs Charitable Trust (WJK), the Leir Charitable Foundation and the Israel Science Foundation (ISF).
References
Supplementary Material
Please find the following supplemental material available below.
For Open Access articles published under a Creative Commons License, all supplemental material carries the same license as the article it is associated with.
For non-Open Access articles published, all supplemental material carries a non-exclusive license, and permission requests for re-use of supplemental material or any part of supplemental material shall be sent directly to the copyright owner as specified in the copyright notice associated with the article.