
Abstract
Automating the analysis of neurons in culture represents a key aspect of the search for neuroactive compounds. A number of commercial neurite analysis software packages tend to measure some basic features such as total neurite length and number of branching points. However, with only these measurements, some differences between neurite morphologies that are clear to a human observer cannot be identified. The authors have developed a suite of image analysis tools that will allow researchers to produce quality analyses at primary screening rates. The suite provides sensitive and information-rich measurements of neurons and neurites. It can discriminate subtle changes in complex neurite arborization even when neurons and neurites are dense. This allows users to selectively screen for compounds triggering different types of neurite outgrowth behavior. In mixed cell populations, neurons can be filtered and separated from other brain cell types so that neurite analysis can be performed only on neurons. It supports batch processing with a built-in database to store the batch-processing results, a batch result viewer, and an ad hoc query builder for users to retrieve features of interest. The suite of tools has been deployed into a software package called HCA-Vision. The free version of the software package is available at http://www.hca-vision.com.
Introduction
T
Manual or semiautomated measurement of cell morphology changes is a time-consuming, labor-intensive, and nonreproducible process. Researchers may spend hours manually tracing cell shapes. It is subjective and can sometimes undermine the reliability of the research output. Meijering et al. 3 reported a semiautomatic neurite tracing technique, which improved reproducibility and accuracy in neurite centerline extraction, as well as reduced the labor intensiveness. Xiong et al. 4 presented a method for automated neurite labeling and analysis in fluorescence microscopy images without associating neurites with their parent neuron bodies. Therefore, there is no result produced to report individual neuron-based neurite distribution such as number of branching points per neuron and average neurite outgrowth. The neuron-based statistical information is certainly of biological interest. A number of free and commercial high- content analysis systems tend to measure some basic features such as total neurite length and number of branching points. 5,6 However, with only these measurements, neuronal morphologies that appear distinctly different to a human observer can be measured as identical by an automated classifier. When presented with a dense well, the HCA software of these systems is unable to distinguish between individual neurons, resulting in biased per-cell measurements. Another drawback with such software is that fewer neurite structures are detected since the thickness of the neurites has to be predefined. 7
Our software package provides sensitive and information-rich measurements of both neurons and neurites even when neurons and neurites are dense. It reports 13 image-wide measurements and 34 neuron-based features, including the primary neurites in contact with the neuron body and the number of layers of arborization from these primary neurites into secondary, tertiary branches. It also supports batch processing with the built-in database to store the batch-processing results, a batch result viewer, and an ad hoc query builder for users to retrieve features of interest. To speed up the neurite analysis, multicore-enabled parallel image analysis has been developed, which can significantly reduce the batch-processing time. 8
In this article, a fully automated neurite tracing and neuronal morphology analysis software package is reported.
Materials and Methods
Isolation, cultivation, staining, and imaging of rat cerebellar granule neurons
Primary cultures of cerebellar granule neurons (CGNs) were obtained from 7-day-old Oncins France Strain A rats by mechanically chopping the cerebellum, followed by trypsin digestion and trituration. 9 Then, 30,000 or 100,000 cells were seeded in black, clear-bottomed, poly-D-lysine-coated 96-well (BD Biosciences, Franklin Lakes, NJ) plates for short-term (up to 4 days) and long-term cultivation (>4 days), respectively. The plates were incubated at 37 °C with 5% CO2 and 95% humidity up to 7 days. The cells were fixed with 4% paraformaldehyde (PFA; Electron Microscopy Sciences, Hatfield, PA). Nuclei were stained with 0.5 µM DRAQ5 (Biostatus Ltd, Leicestershire, UK) and the neuronal cells with anti-β-tubulin III (R&D Systems, Minneapolis, MN) and Alexa Fluor 488–conjugated secondary antibody (Invitrogen, Carlsbad, CA). Images were acquired with IN Cell Analyzer 3000 (GE Healthcare, Piscataway, NJ), which is an automated confocal laser scanning microscope. Images for the red and green channels (DRAQ5 and Alexa Fluor 488) were taken simultaneously. DRAQ5 was excited with the 647-nm krypton laser, and emitted light was collected using a 695BP55 filter. Alexa Fluor 488 was excited using the 488-nm line of the argon laser, and emitted light was collected using a 535BP45 filter. Brain-derived neurotrophic factor (BDNF) was from Sigma (St. Louis, MO).
HCA-Vision development
HCA-Vision was designed with the following 3 layers: the image-processing layer written in C, a C++ wrapper layer, and the data and image presentation layer written in C#. The image-processing layer has all fundamental image analysis functions for neuron body detection, neurite detection, and neurite analysis. The wrapper layer is implemented in managed extensions for C++. It bridges the gap between unmanaged C functions and the top-level functions written in C#. This layer also translates managed data types into unmanaged data types so that parameters specified in the top-level functions can be passed into the low-level C functions. HCA-Vision also includes an optional Web service for users to remotely view batch-processing results stored in the built-in database. Developed using Microsoft .Net technology, the software provides an intuitive Graphical User Interface (GUI) and employs modular software architecture. Neurite analysis module includes 3 routines: neuron body detection, neurite detection, and neurite analysis.
Workflow
The workflow of HCA-Vision is divided into 3 main phases:
Define parameter profiles for batch processing or reuse. The GUI provides a user-friendly wizard to guide the users in the process of choosing optimal parameters for the automated neuron body detection, neurite detection, and neurite analysis. Once the set of parameters are tuned, they are saved into a parameter profile for batch processing or reuse.
Perform batch processing using pretuned parameters. Users can use the saved profile to batch process all images generated in the experiment.
View or query batch-processing results. The batch-processing results are piped into a database for storage, ad hoc query, and visualization. Users can view the batch-processing results using the batch result viewer, including both the result images and measured features. Summary results for the batch can be produced using the ad hoc query tool provided in the software.
The full complement of the workflow for the above 3 phases can be viewed online under the supplementary material part A—HCA-Vision User Manual. 10
Neuron body detection
The neuron body detection aims at identifying and marking the neuron bodies. This includes the following steps: smoothing the neurite outgrowth image; background correction to remove global trends in the background of the image; suppressing small structures such as neurites; thresholding the image to detect neuron bodies; if the nucleus image for the neuron bodies is available, detecting nuclei to be used as masks to split touching neuron bodies; filtering neuron bodies by applying certain cell selection criteria such as minimum size; and producing the neuron body detection result image to be used in the neurite analysis step.
When neurite outgrowth images are dense, some neurons may touch each other and need to be split. When nucleus images are available, the segmented nuclei are used as seeds to separate the touching neuron bodies. Otherwise, watershed algorithms are directly applied to separate the touching neuron bodies. Sometimes nuclei can be clumped. A de-clumping function is provided in HCA-Vision to separate them. In this case, maximum nucleus size is required to specify the maximum nucleus area above which the nucleus will be de-clumped. A sample image can be viewed in the supplementary material part B showing the original clumped nuclei, segmented nuclei, and de-clumped nuclei.
Neuron body measurements include number of neuron bodies, area, perimeter, and intensity statistics—the maximum intensity, mean intensity, integrated intensity, and standard deviation of intensity for each neuron body.
Neurite detection
Neurites are thin structures that can display very weak and noisy contrast on highly variable backgrounds, depending on the imaging conditions. Neurite trees display multiscale, fractal-like structures. A very fast algorithm capable of dealing with this complexity has been developed. 11 The algorithm uses nonmaximum suppression as a mechanism to identify pixels belonging to linear features. This is followed by several postprocessing steps that complete and clean the result image obtained. As for most image analysis algorithms, a number of parameters control the process and influence the quality of the results. The parameters of the described algorithms are intuitive to the user, are mostly independent of each other, and can be adjusted successively.
Neurite analysis
The neurite analysis is to trace neurites and to associate neurites with the corresponding neurons. It produces statistics of neuron and neurite structures on both a cell-by-cell and image-by-image basis. 12 Some definitions of neurite segments are illustrated in Figure 1 . They are listed as follows:
Neurite segments: S1 to S8
Roots: R1 to R2
Extremities: E1 to E5
Branching points: B1 to B3
Longest neurite segment: S1 + S2
Neurite field area: area of convex hull (i.e., the area enclosed by dotted lines)
Primary neurite: neurite shown in orange
Secondary neurite: neurite shown in cyan
Tertiary neurite: neurite shown in blue
Branch layers: layer 1 is for primary, 2 for secondary, and 3 for tertiary
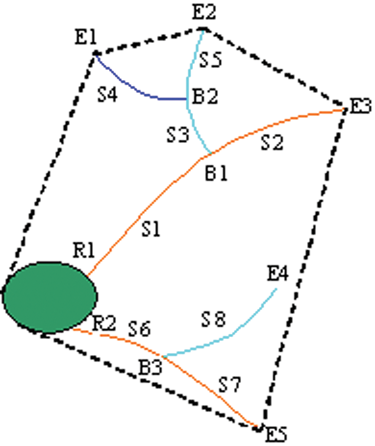
Segmented neurite outgrowth image.
Measurements that quantify neurite morphology are generated from the results of the neuron body and neurite detection. The neurite structure is converted into a graph representation and grown from the detected neuron bodies using a graph-based watershed algorithm. 2,13 This process associates neurite trees with their parent neuron bodies and introduces relationships between individual neurite segments. These relationships define the complexity of the neurite arborization from the number of branch points to the branching layer of the arborization. The algorithm also accumulates length, width, and brightness quantities as it traverses the neurite structures. Thirty-four measurements are produced per neuron body to characterize neuronal morphology.
In
Figure 2
, the original image represents a neuron viewed under fluorescence microscopy. The output generated by HCA-Vision details primary (blue), secondary (yellow), tertiary (purple), and quaternary neurites (teal).
Figure 2c
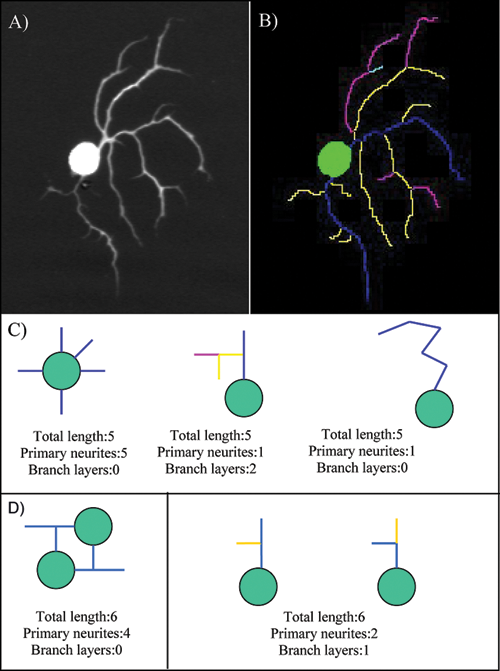
(
Quantifying neurite structure with mixed cell populations
In mixed cell populations, it is often necessary to filter and separate each cell type before cell counting and further analysis. For example, an image may contain a mixture of neurons and other brain cell types such as astrocytes and other unstained glial cells. Neurite analysis is to be performed only on neurons. Therefore, the neurons shall be readily separated from the astrocytes and the glial cells based on intensity in the neuron channel within the nucleus region. In some cases, the nonneuron nuclei could only be filtered out by using a combination of their size, brightness, and low intensity in the neuron channel within the nucleus region. More details on quantifying neurite structure with mixed cell populations can be found in the HCA-Vision User Manual. 10
Validation
Crucial experiments have been conducted to show that treatments that modulate neurite morphology can be dose-dependently detected and analyzed using HCA-Vision.
From the Trk neurotrophin receptors, TrkB is expressed at the highest level in the CGNs. 14,15 Therefore, we tested the effect of the TrkB ligand, BDNF, on the number of neuronal cells and on the number and length of neurites. Cerebellar granule cells were seeded in 96-well plates. Two hours after cell seeding, BDNF was added to final concentrations of 1.25 to 10 ng/mL, and the cells were incubated further for 3 days. Then the cells were fixed, stained, and imaged as described above. The images were analyzed using the HCA-Vision software. Image analysis indicates that BDNF slightly increased the number of neuronal cells at 2.5 ng/mL, but thereafter no further increase in the number of neuronal cells was detected. Analysis of the images revealed that BDNF increased the total length, area, and number of neurites. The average number of neurites emerging from a cell body, as well as the average number of neurite extremities, was also increased, whereas the average length of the longest neurite was not affected ( Fig. 3 ). Thus, the image analysis revealed that BDNF enhances neurite outgrowth mainly by increasing the number of neurites in the cells.
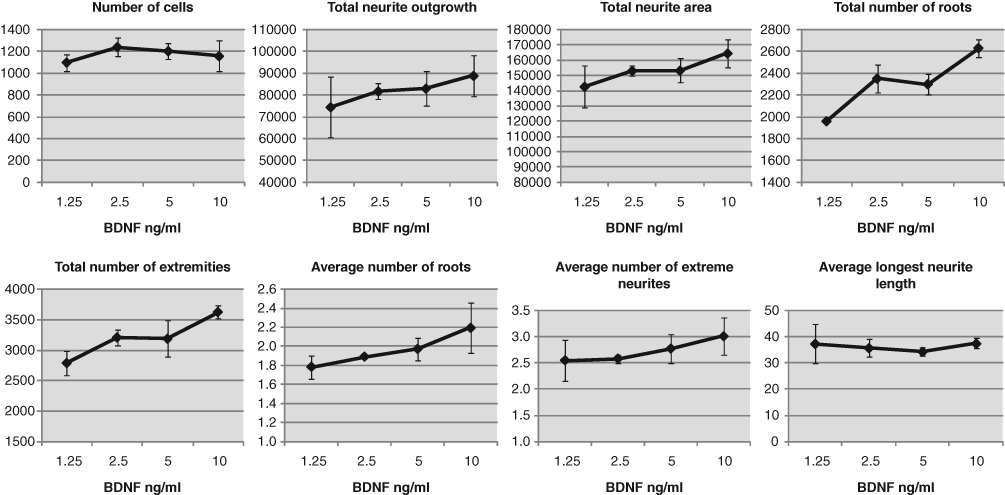
Analysis of the effect of brain-derived neurotrophic factor (BDNF) on neurite outgrowth in cerebellar granule cells using the HCA-Vision software. The cells were incubated with the indicated concentrations of BDNF for 3 days. Median of triplicate samples and standard deviations are shown.
The experimental results show that the sophisticated analysis of neurite arborization can be conducted using HCA-Vision.
Another experiment is detailed in Vallotton et al. 12 The software was validated using images of cortical neurons by comparing results obtained using HCA-Vision with those obtained using an established semiautomated tracing solution. The results generated by HCA-Vision showed that Sez-6 null neurons exhibited a significant increase in neurite branching, although the neurite field area was unchanged due to a reduction in mean branch length. The comparison showed that HCA-Vision delivered considerable speed benefits and reliable traces.
Results
An experiment was carried out using a plate of images acquired with IN Cell Analyzer 3000 (GE Healthcare). The isolation, cultivation, and staining of the neurons are briefly described in the Materials and Methods section. The images were captured from a 96-well plate, 16 images per well. Each neurite outgrowth image has 2 channels, with 1 channel showing the nuclei and the other showing the neurons and neurites.
HCA-Vision produces quantitative measures and statistics together with result images. It reports a range of features of neurite outgrowth, including image-wide summary statistics, cell-based measurements, and a well-based summary for each plate. The image-wide and cell-based measurements are stored in the built-in database, which can also be exported as a CSV file for loading into applications such as Excel for further analysis.
Image-wide summary statistics
The image-wide summary includes the following statistics:
Number of cells—total number of neuron bodies
Total and average neurite outgrowth—the total length of all neurite structures (in pixels) and this value averaged by the number of neuron bodies
Total and average neurite area—the total area of all neurite structures (in pixels) and this value averaged by the number of neuron bodies
Total and average number of segments—a segment is a linear structure between branching points or a neuron body; average number of segments is the total number of segments averaged by the number of neuron bodies
Average branching layers and longest neurite from a cell—the average of the highest level of branching for a cell and the length (in pixels) of the longest path from a neuron body to an extreme segment
Total and average number of roots—the number of points where neurite structure touches a neuron body and this value averaged by the number of neuron bodies
Total and average number of extreme neurites—the number of terminating neurite segments and this value averaged by the number of neuron bodies
Total and average number of branch points—the number of points where a neurite structure splits into 2 or more branches and this value averaged by the number of neuron bodies
Cell-based measurements
The cell-based measurements include the following:
Total neurite length—sum of the length of each neurite segment for the cell
Max neurite length—the length (in pixels) of the longest path from a neuron body to an extreme segment
Max branch layer—the highest level of branching for the cell
Mean branch layer—the mean level of branching for the cell
Number of branch points—the number of points where a neurite structure splits into 2 or more branches
Number of roots—the number of points where a neurite structure touches a neuron body
Number of segments—a segment is a linear structure between branching points or a neuron body
Number of extremities—the number of terminating neurite segments
Neurite field area—the area of the convex hull containing the cell’s neurite structure
Max intensity neurite—the maximum intensity along the neurite structure
Mean intensity neurite—the mean intensity along the neurite structure
Integrated intensity neurite—the integrated intensity along the neurite structure
Std dev intensity neurite—the standard deviation of the intensity along the neurite structure
Branch layer statistics—for each branch layers 1 to 3, the number of branches, total neurite length, and max neurite length are reported
Plate summary
The plate summary is composed of normalized features for each well. All features extracted from the images sampled from the same well are averaged to produce the well-based normalized statistics. A sample plate summary can be viewed in the supplementary material part B.
Result images
HCA-Vision produces 3 result images for each neurite outgrowth image. The first result image is called the “neurite parent image” ( Fig. 4b ). It is color coded so that neurite segments are given the same color as the color of their parent neuron body. The second is called the “branch layer image” ( Fig. 4c ). This image shows the neuron bodies in green, primary neurites (those touching the neuron body) in yellow, secondary neurites (those touching primary neurites) in pink, tertiary branch layers in cyan, and so on. The third is “complete label image of neuron bodies and neurites” ( Fig. 4d ). In this image, the neuron bodies are color coded and so are the different layers of neurites.
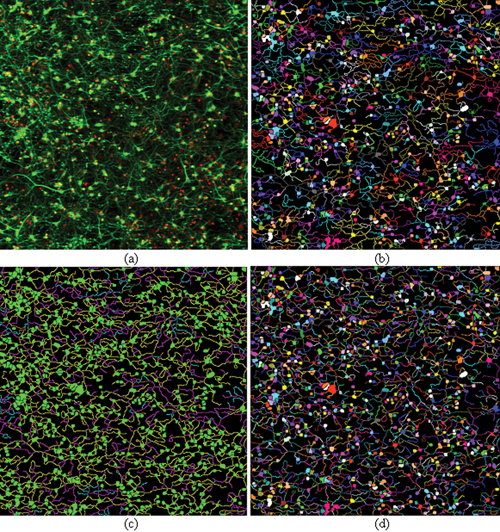
Neurite analysis results produced by HCA-Vision, showing neuronal cell bodies together with associated neurites. (
Conclusions
HCA-Vision is a software package for both automated high-throughput analysis and thorough individual analysis of microscopy images of cells. It can be used by pharma companies for high-content screening and the large community of neuroscience researchers for quantifying their images, especially those who have particularly high demands on the image analysis quality and require tight control over the analysis process. It releases researchers from time-consuming and labor-intensive manual tracing and allows them to accurately measure cell changes and improve their understanding of biological systems and processes. It can detect nuclei and neurons and automatically trace neurites, even in the presence of varying background brightness, different neurite staining, high cell densities, and high levels of neurite interconnections. It extracts detailed and biologically relevant features describing the complexity of the neurite arborization, including measurements of neurite features at various levels of branching. It produces detailed, relevant information about cell morphology. In addition, it provides intuitive wizards to help biologists tune the image analysis parameters and allows the parameters to be saved for batch processing or future reuse. The results from HCA-Vision are reproducible, reliable, and objective.
Footnotes
Acknowledgements
We thank Ida-Maria Sintorn for her work on nucleus de-clumping and Gabriele Hofmann for isolation and cultivation of the cerebellar granule cells. Thanks to the following people for allowing us to use their images as sample images in HCA-Vision: Dr. Myles Fennell, Wyeth Research, Princeton, NJ; Dr. Stephen Haggarty, Broad Institute of Harvard and MIT, Cambridge, MA; and Dr. Brent Reynolds, Queensland Brain Institute, Australia. The authors would also like to thank anonymous reviewers for providing thoughtful comments.