
Abstract
Automated microscopes have enabled the unprecedented collection of images at a rate that precludes visual inspection. Automated image analysis is required to identify interesting samples and extract quantitative information for high-content screening (HCS). However, researchers are impeded by the lack of metrics and software tools to identify image-based aberrations that pollute data, limiting experiment quality. The authors have developed and validated approaches to identify those image acquisition artifacts that prevent optimal extraction of knowledge from high-content microscopy experiments. They have implemented these as a versatile, open-source toolbox of algorithms and metrics readily usable by biologists to improve data quality in a wide variety of biological experiments.
Introduction
The advent of high-content screening (HCS) has had a tremendous impact on drug discovery and genome analysis. Sophisticated algorithms are integral to HCS, easing the process of automatically scoring images for phenotypes without visual inspection. The use of automated microscopy and image analysis has increased screening speed, objectivity, and statistical power by multiplexing the extraction of complex quantitative information from each cell.
However, these advances have also generated the need for robust metrics and workflows for quality control (QC) of HCS images, typically to reduce the number of images that are spuriously scored as screening hits. Anomalies in image quality can pollute high-content microscopy data and in some cases even preclude certain types of experiments. Analysis of these data sets requires the researcher to explore and visualize gigabytes of image and extracted feature information; simple spreadsheet programs (e.g., Microsoft Excel) are inadequate for the task. Commercial automated systems do not package QC metrics and visualizations as a cohesive toolset readily accessible to users; researchers may resort to custom software solutions 1 or to visual exploration of hits to exclude obvious artifacts. Solutions are needed that package together data metrics and visualizations in a user-friendly software tool compatible with any automated microscope, to enable automatic detection of image aberrations that would otherwise corrupt the data and diminish the experimental results.
In this article, we characterize several QC metrics for common artifacts that confound high-content imaging experiments. Our approach to HCS QC has developed over many years of image-based screens for complex phenotypes and is implemented in open-source software.
Methods and Materials
HCS microscopy images were acquired using an ImageXpress Micro automated cellular imaging system (Molecular Devices, Sunnyvale, CA). The 384-well plates containing U2OS cells stained with Hoechst 33342 and Alexa Fluor 594 phalloidin markers were imaged with an exposure of 15 and 1000 ms for Hoechst and phalloidin, respectively, at 20× magnification and 2× binning. For each site, the optimal focus was found using laser autofocusing on the Hoechst channel. The automated microscope was then programmed to collect a z-stack of 32 images (z = 0 at the optimal focal plane, 16 images above the focal plane, 16 below) with 2 µm between slices. For additional validation, we used images from a large phenotypic screen obtained with the protocol above, along with the addition of a MitoTracker (Invitrogen, Carlsbad, CA) mitochondrial stain and the acquisition of four sites per well. Even though focusing was performed automatically, two plates contained extensive focus artifacts and were discarded from the screen; for these plates, each image was manually annotated as in- or out-of-focus.
Synthetic HCS cellular images (25 per test condition) were created using SIMCEP simulation software 2 run in MATLAB (Mathworks, Inc., Natick, MA). The cells were simulated for a given cell count with a clustering probability of 25% and a charge-coupled device (CCD) noise variance of 0.0001. The synthetic image dimensions were the same as those of the microscopy images, and the simulated nuclei and cell areas were matched to the corresponding average areas obtained from an HCS plate. Increasing focus blur was simulated by applying Gaussian filters of increasing size to the images.
Metrics directed toward two types of artifacts were examined: focal blurring and image saturation. The various focus metrics were evaluated using the multiwell microscopy image z-stacks and the artificially blurred synthetic images with the following approach:
Computing QC thresholds on a training image set: An expert (one of the coauthors, MAB) defined ground truth by selecting the z-offset corresponding to the boundary between acceptable in-focus images and unacceptable out-of-focus images, as determined visually. A training set of images spanning all z-offsets was created from a random selection of wells, and the optimal threshold for each focus metric was chosen based on this training set. True positives (TPs) and false positives (FPs) were defined as images correctly or incorrectly detected as in-focus according to ground truth, respectively; a false negative (FN) is an image incorrectly detected as out-of-focus. For each metric, the per-image F-score was calculated for each bin, defined as

where precision (p) and recall (r) are defined as


Because the F-score is a measure of detection accuracy, we define the QC threshold for a metric as the optimal boundary between in- and out-of-focus images; it is computed as the value corresponding to the maximum F-score.
Evaluating metric performance on a test image set: The F-scores were calculated for each metric from the remaining wells using the QC thresholds established above.
A similar approach was taken with the saturation artifact metrics, with the exception that ground truth comprised a set of artifact-laden images manually selected from five plates from another HCS microscopy experiment. Training and test sets were created from a random selection of images from the ground truth set and from the remaining images, respectively.
Most QC metric computation and cellular analysis was performed using a pipeline (a serial set of image analysis algorithms) constructed using version 2.0 of CellProfiler, a cell image analysis software package. 3 A MetaXpress (Molecular Devices) journal/macro was used to retrieve and export the instrument-acquired per-image signal/noise ratio. Exploration of image data was performed with CellProfiler Analyst. The open-source software packages CellProfiler and CellProfiler Analyst are maintained by the Imaging Platform at the Broad Institute; both packages are freely downloadable from http://www.cellprofiler.org.
Results and Discussion
Characterization of QC metrics
Common artifacts that confound image analysis algorithms include out-of-focus images, debris, image overexposure, fluorophore saturation, and uneven field illumination, among others. Because these anomalies affect intensity, morphological, and textural measurements in a variety of ways, we have found that a single QC metric that captures all types of artifacts is not feasible. Therefore, multiple metrics were developed and applied tailored to the specific artifact. Here, we characterize metrics commonly used by our group.
QC metrics for out-of-focus images
The most common and problematic HCS artifacts are out-of-focus images acquired despite automated microscope autofocusing. Relative focus metrics have been studied extensively for optimal focal plane selection, 4 in which the goal is to select the best focal plane among many images of the same field of view. However, these methods are not directly applicable in the context of HCS QC, in which an absolute focus metric is needed to identify the focus quality of single images from thousands of fields of view.
Because image focus, signal/noise, and cell density commonly fluctuate across an HCS experiment, it is useful to test the candidate QC metric against similarly varying images to ensure reliability across a broad range of experiments. 5 In addition to informal testing in dozens of HCS experiments, we validated and characterized several candidate focus metrics using two sets of benchmark images ( Fig. 1A ):
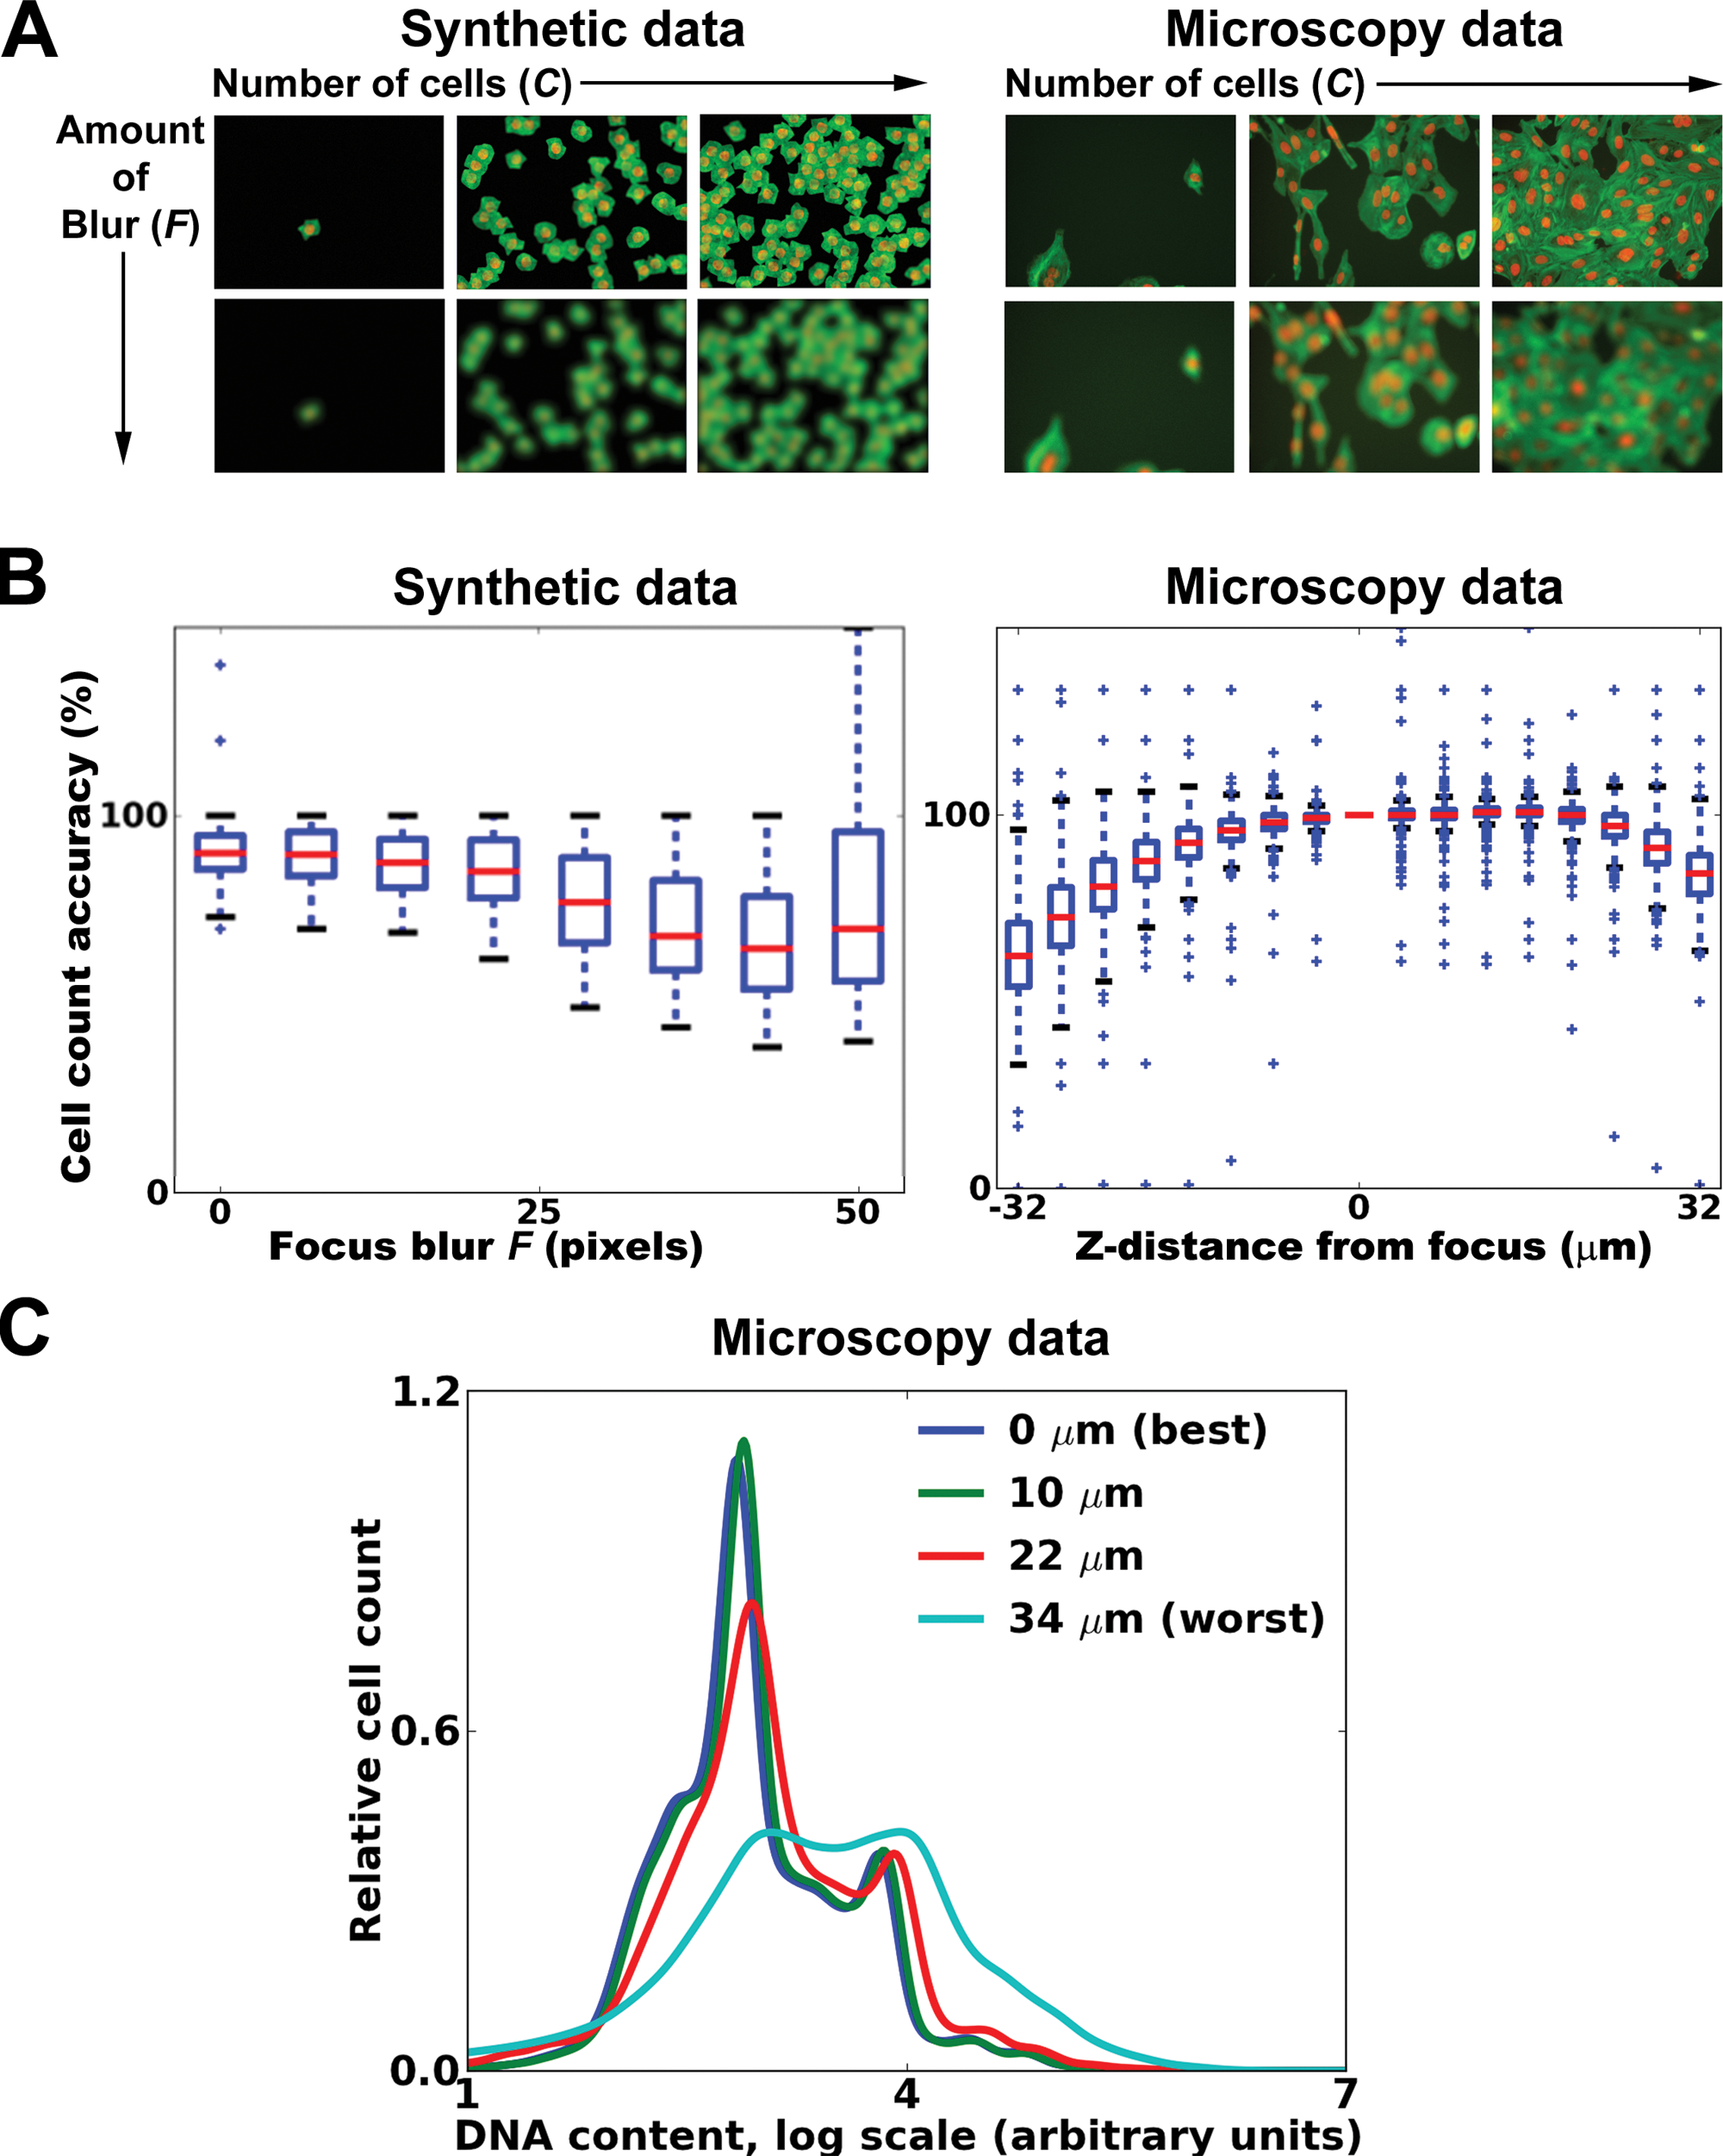
Analysis of focus metrics using synthetic and microscopy high-content screening (HCS) image data. (
We created a set of synthetic HCS images of cell populations with ground truth segmentation. We then blurred the images artificially and quantified the performance of metrics with respect to the amount of blur and the cell count per image. As expected, we observed that a typical quantitative measure such as cell count degrades with increasing focus blur, F ( Fig. 1B , left).
Because synthetic cell images are unlikely to fully represent the actual experimental variation typical of an experiment, we also tested microscopy images of cell samples from a 384-well HCS plate. We imaged multiple fields of view per well and multiple focal planes per field above and below the optimal focal plane. Applying larger blurring filters in the synthetic images is considered equivalent to increasing the distance from the optimal focal plane in the microscopy images, and both will be referred to in terms of F. Again, quantitative measures such as cell count ( Fig. 1B , right) and DNA content distribution ( Fig. 1C ) of the cell population degrade with increasing focal blur.
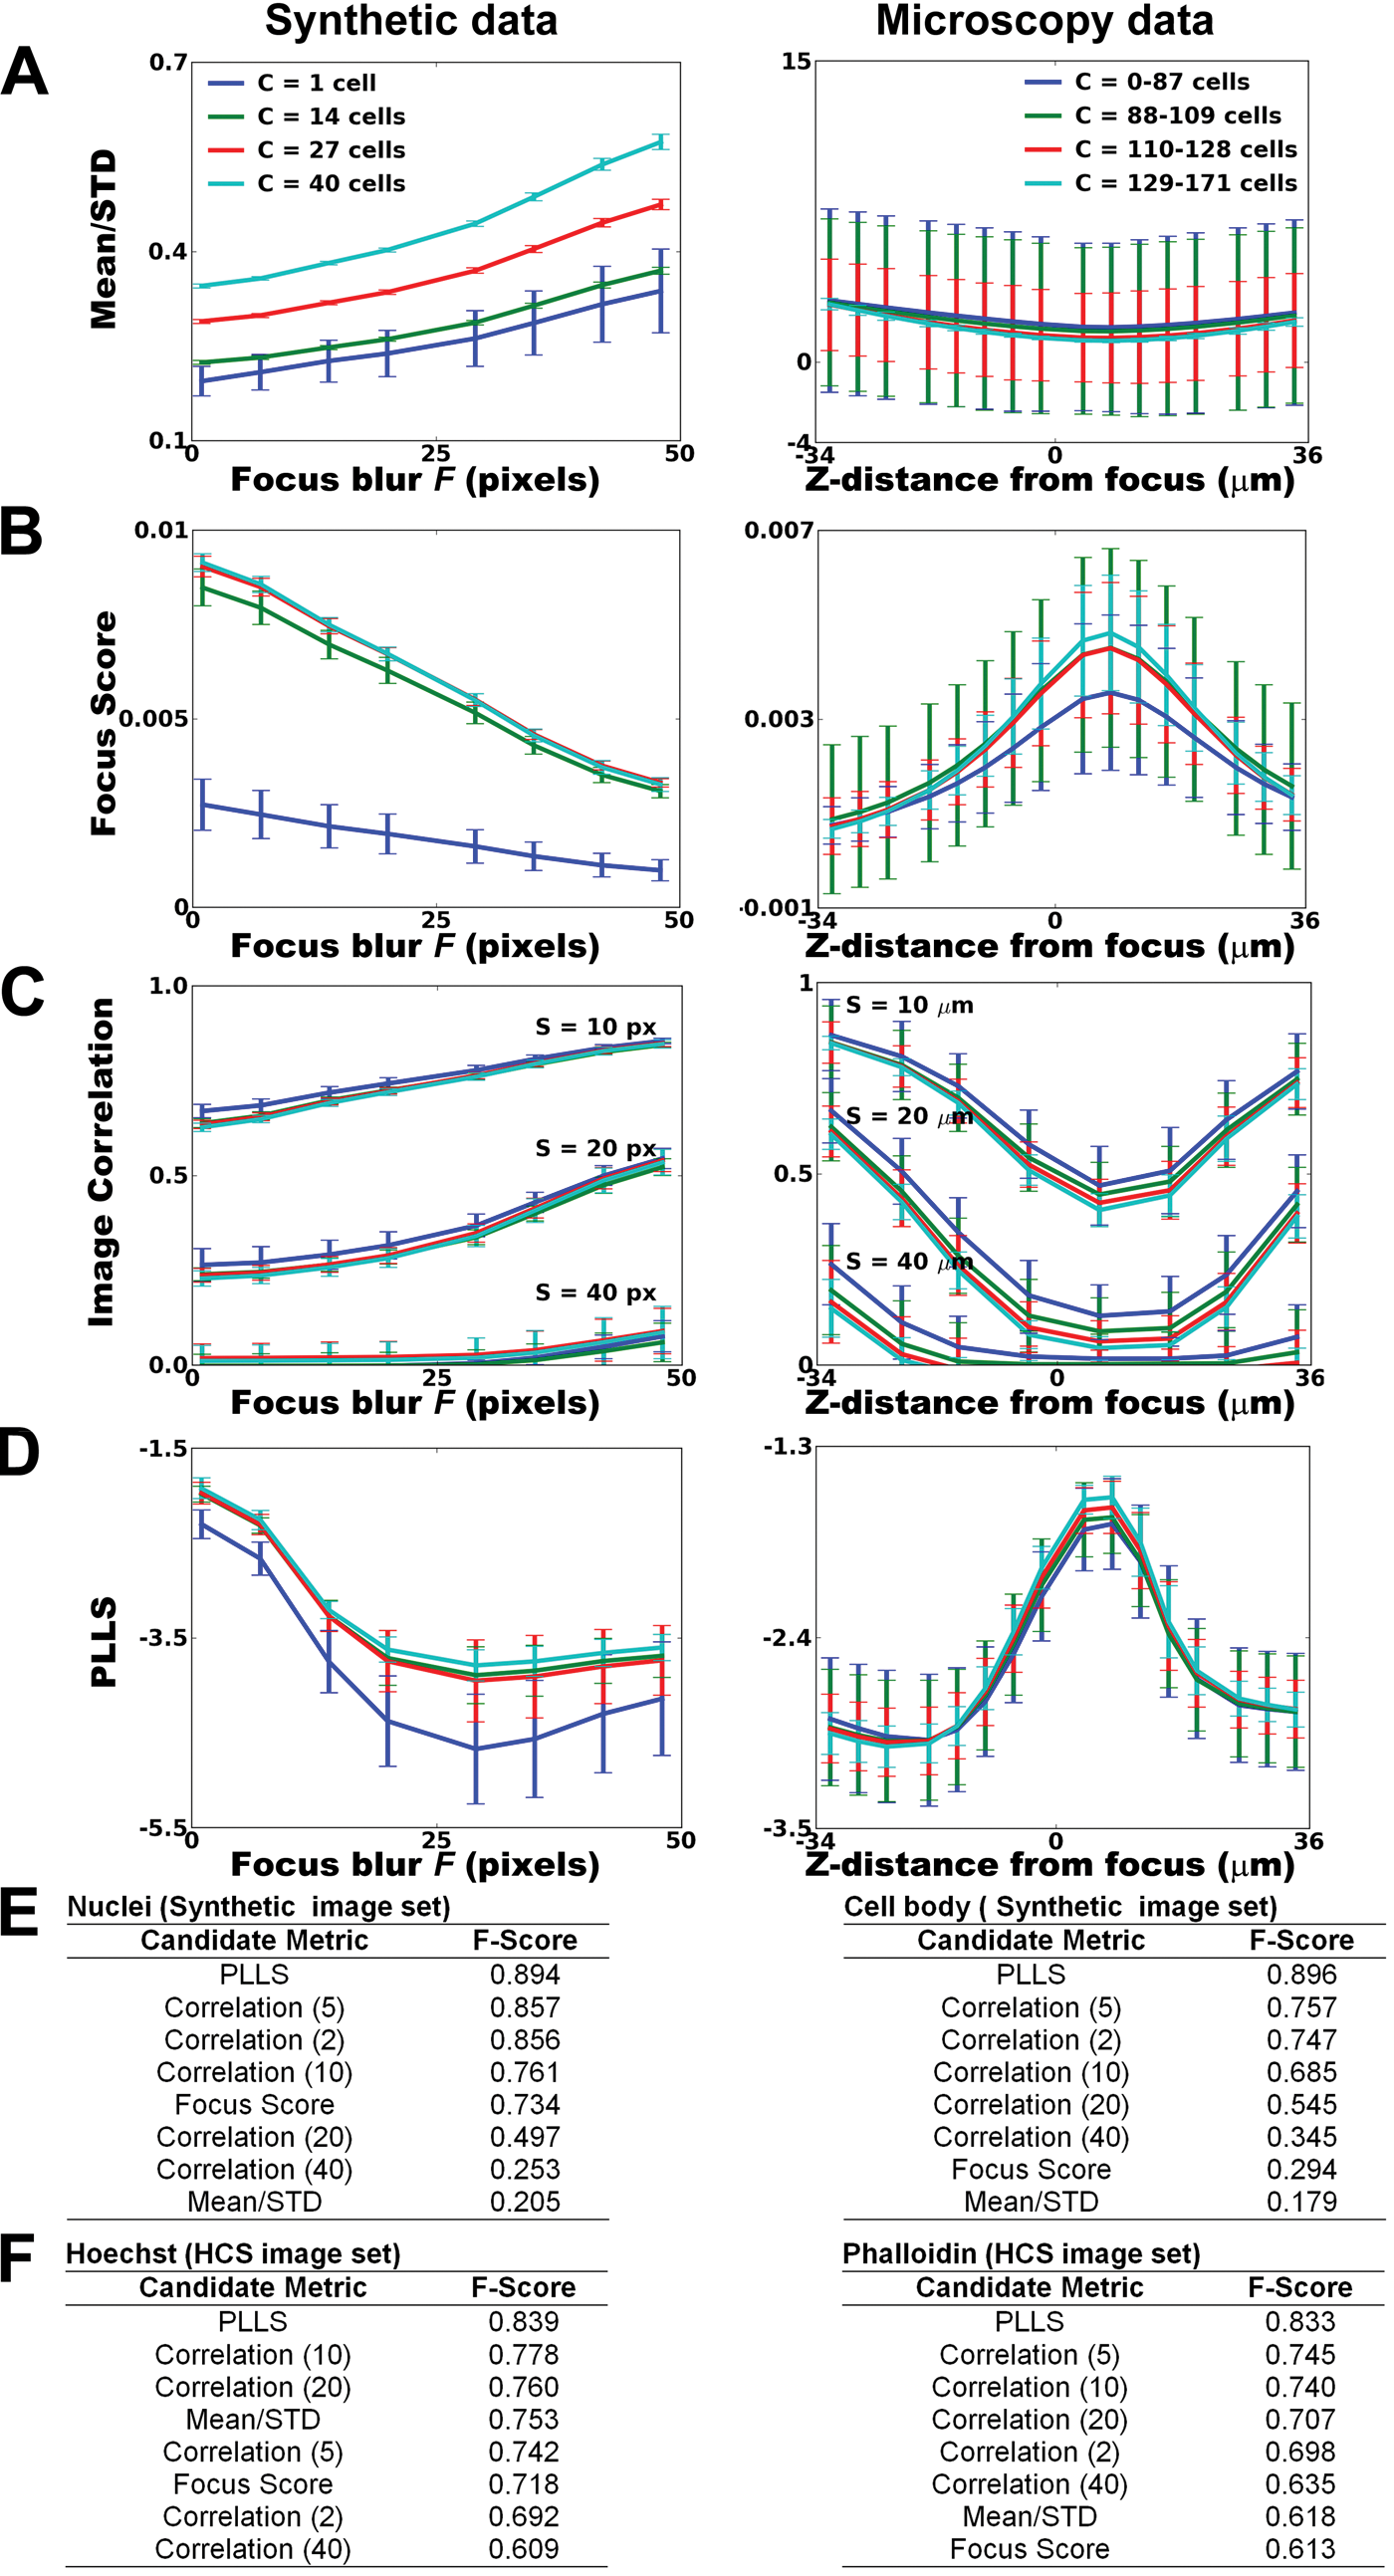
We assessed the performance of four previously proposed metrics with respect to variations in focal blur F and cell count C. Our criteria for an optimal QC metric are (a) insensitivity to cell count C since C typically varies widely in HCS and (b) detection accuracy in the presence of focal blur F. The metrics are as follows:
The mean/STD is the ratio of the average image intensity to the standard deviation of the image intensity (or inverse coefficient of variation). It is provided as a QC measure in the commercial MetaXpress system (defined as the signal-to-noise ratio). The mean/STD value decreases as C decreases or F increases ( Fig. 2A ).
The focus score is a normalized measure of the intensity variance within an image 6 and has been recommended as the optimal method for autofocusing purposes. 4 Its value also decreases as C decreases or F increases ( Fig. 2B ).
The image correlation is a measure of the image spatial intensity distribution computed across subregions of an image, 7 and its value increases as F increases ( Fig. 2C ). For a given spatial scale, the image correlation is insensitive to C.
(
The power log-log slope (PLLS) evaluates the slope of the power spectrum density of the pixel intensities on a log-log scale. 8 The PLLS is relatively insensitive to C and decreases as F increases because high-frequency image components are lost as an image is blurred ( Fig. 2D ).
Using F-score as a measure of ability to accurately distinguish in-focus from out-of-focus images for the two stains in both synthetic and microscopy images ( Fig. 2E , F ), the highest performing metric is the PLLS, despite some sensitivity at very low C. The image correlation metric performs well in terms of moderate F-score and insensitivity to C. However, selecting an appropriate spatial scale is important for the metric’s performance because differences in the spatial scale capture various features: Moderate scales capture the blurring of intracellular features better than small scales, and larger scales are more likely to reflect intercellular confluence than focal blur. The mean/STD and focus score metrics both have a dependence on C, and their large variance for a given amount of focal blur makes them unreliable for HCS QC focus assessment.
QC metrics for saturation artifacts
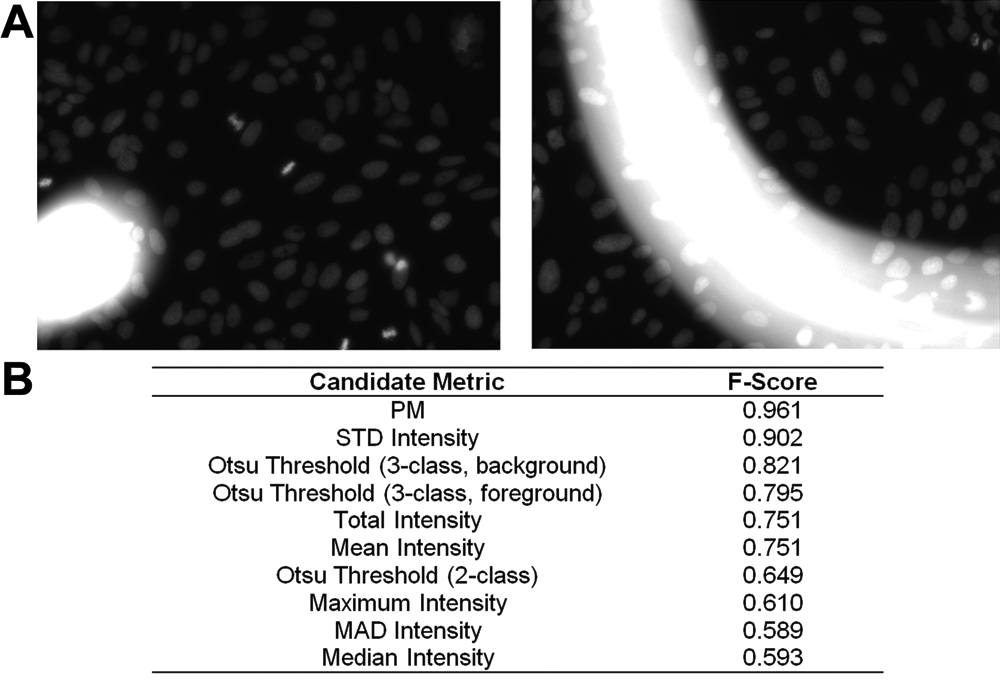
Another screening irregularity often encountered relates to saturation artifacts: inappropriately bright regions of images that can be caused by debris contamination, reagents aggregates, or inappropriate exposure/gain settings ( Fig. 3A ). Saturated regions preclude accurate intensity measurements and can confuse cell identification even in unaffected image regions in extreme cases.
(
To assess saturation artifacts, we typically use the percent maximal (PM) metric to compute the percentage of pixels at the maximum image intensity value; high PM values can identify saturated images as candidates for exclusion. 9 Other statistical measures related to image intensity have also been used for detecting saturation artifacts in microarray image data. 10
Because saturation artifacts do not fall into well-defined archetypes and vary greatly in appearance, we relied on our informal experience in dozens of HCS experiments as well as a data set of artifacts (40 images) that occurred by chance in five HCS plates. We quantified the artifact detection accuracy using the F-score to compare eight metrics: PM, the total, mean, median, standard deviation, maximum and median absolute deviation (MAD) of the image intensity, and the Otsu image threshold. Three forms of Otsu thresholding were evaluated: the standard two-class method and the three-class method, with the middle class assigned to either the foreground or background. Our analysis indicates that PM detects saturation artifacts more robustly than the other candidate metrics ( Fig. 3B ).
Design of the QC workflow
Optimal software tailored to QC for image-based experiments requires linking numerical data back to the raw image data, flexible statistical analyses, and the ability to operate within the hierarchical data structure inherent in image-based data (i.e., an experiment is composed of samples, a sample is tested in replicate wells, the wells contain a number of images, and each image contains hundreds of cells, each with hundreds of features measured).
A QC workflow should perform, at minimum, the following tasks:
Calculation of a suite of metrics that represent the variety of the artifact types that screeners are likely to encounter during an experiment
Provision of tools for analysis and exploration of calculated metrics, to assist researchers unfamiliar with a particular data analysis task
Interaction with the QC metric data using interactive visualization tools promoting the direct coupling of the metrics to the image data, allowing the researcher to examine images and identify acceptable QC thresholds (i.e., boundaries between acceptable and unacceptable images)
Gating of an image subset based on the selected QC thresholds, such that images within the gate are deemed acceptable for further analysis
Application of the gates to the images to obtain a list of acceptable images for export as input to a downstream preprocessing or analysis workflow
Saving the applicable plots and gates representing user decisions during a QC session for later use, either across multiple sessions for a single experiment or across multiple experiments
In the course of work with a wide variety of image-based assays, we have gradually developed a workflow to accomplish these tasks.
Calculation of QC metrics in CellProfiler
We implemented the metrics described above in CellProfiler, allowing analysis modules to be assembled into an automated pipeline. The Measure Image Quality module includes the PLLS, focus score, and PM; the Measure Texture module measures the image correlation at multiple spatial scales; and the Measure Image Intensity module evaluates the mean, median, standard deviation, and minimum and maximum image intensities. As described above, we recommend PLLS to detect blur and PM to detect saturation artifacts. For a small number of images, the measurements extracted by the QC pipeline may be viewed in Excel or a similar spreadsheet program. However, for the large number of images typically generated by an HCS experiment, measurements are best deposited into a database using the Export to Database module. In either case, the QC pipeline with the selected metrics can be saved for reuse in a later experiment. We have provided an example QC pipeline as supplementary material, for use with a set of HCS images available for download at http://www.cellprofiler.org/published_pipelines.shtml.
In most cases, we run a CellProfiler QC pipeline to process all channels of all images in an experiment, followed by an illumination correction pipeline and finally an analysis pipeline to quantify the phenotype of interest. If artifacts are absent or negligible, the first two pipelines can be run simultaneously. If this is not the case, the results from the QC pipeline are used to assess which images should be omitted from the illumination correction and analysis pipelines.
Evaluation of QC metrics in CellProfiler Analyst
We use CellProfiler Analyst for the interactive exploration and analysis of the resulting multidimensional data. 11 In the following example, we describe an image quality workflow using CellProfiler Analyst where selected QC metrics are visualized and inspected and QC thresholds are applied to a subset of plates from an HCS phenotypic screen in which the image data contained extensive focusing artifacts.
When the screen involves less than a few dozen plates or the user wants to obtain a qualitative estimation of the imaging quality, the screener can select these plates for review using the Plate Viewer tool ( Fig. 4A , B ). This tool requires that the database of measurements contains plate, row, and column identifiers, which can be extracted automatically in CellProfiler. The Plate Viewer may be used to visualize any of the computed metrics in a familiar plate layout, with each well color-coded to represent an aggregate per-well measurement. For example, examining the image PM reveals a well with a high mean per-well value (well N17; Fig. 4A ). The Plate Viewer can also display image thumbnails ( Fig. 4B ); viewing these thumbnails may be useful for directly visualizing obvious image artifacts. In addition, the images acquired for a selected well can be displayed as a montage; in this case, viewing the four images from well N17 shows that an image containing saturated debris is responsible for the aberrant QC measurement value.
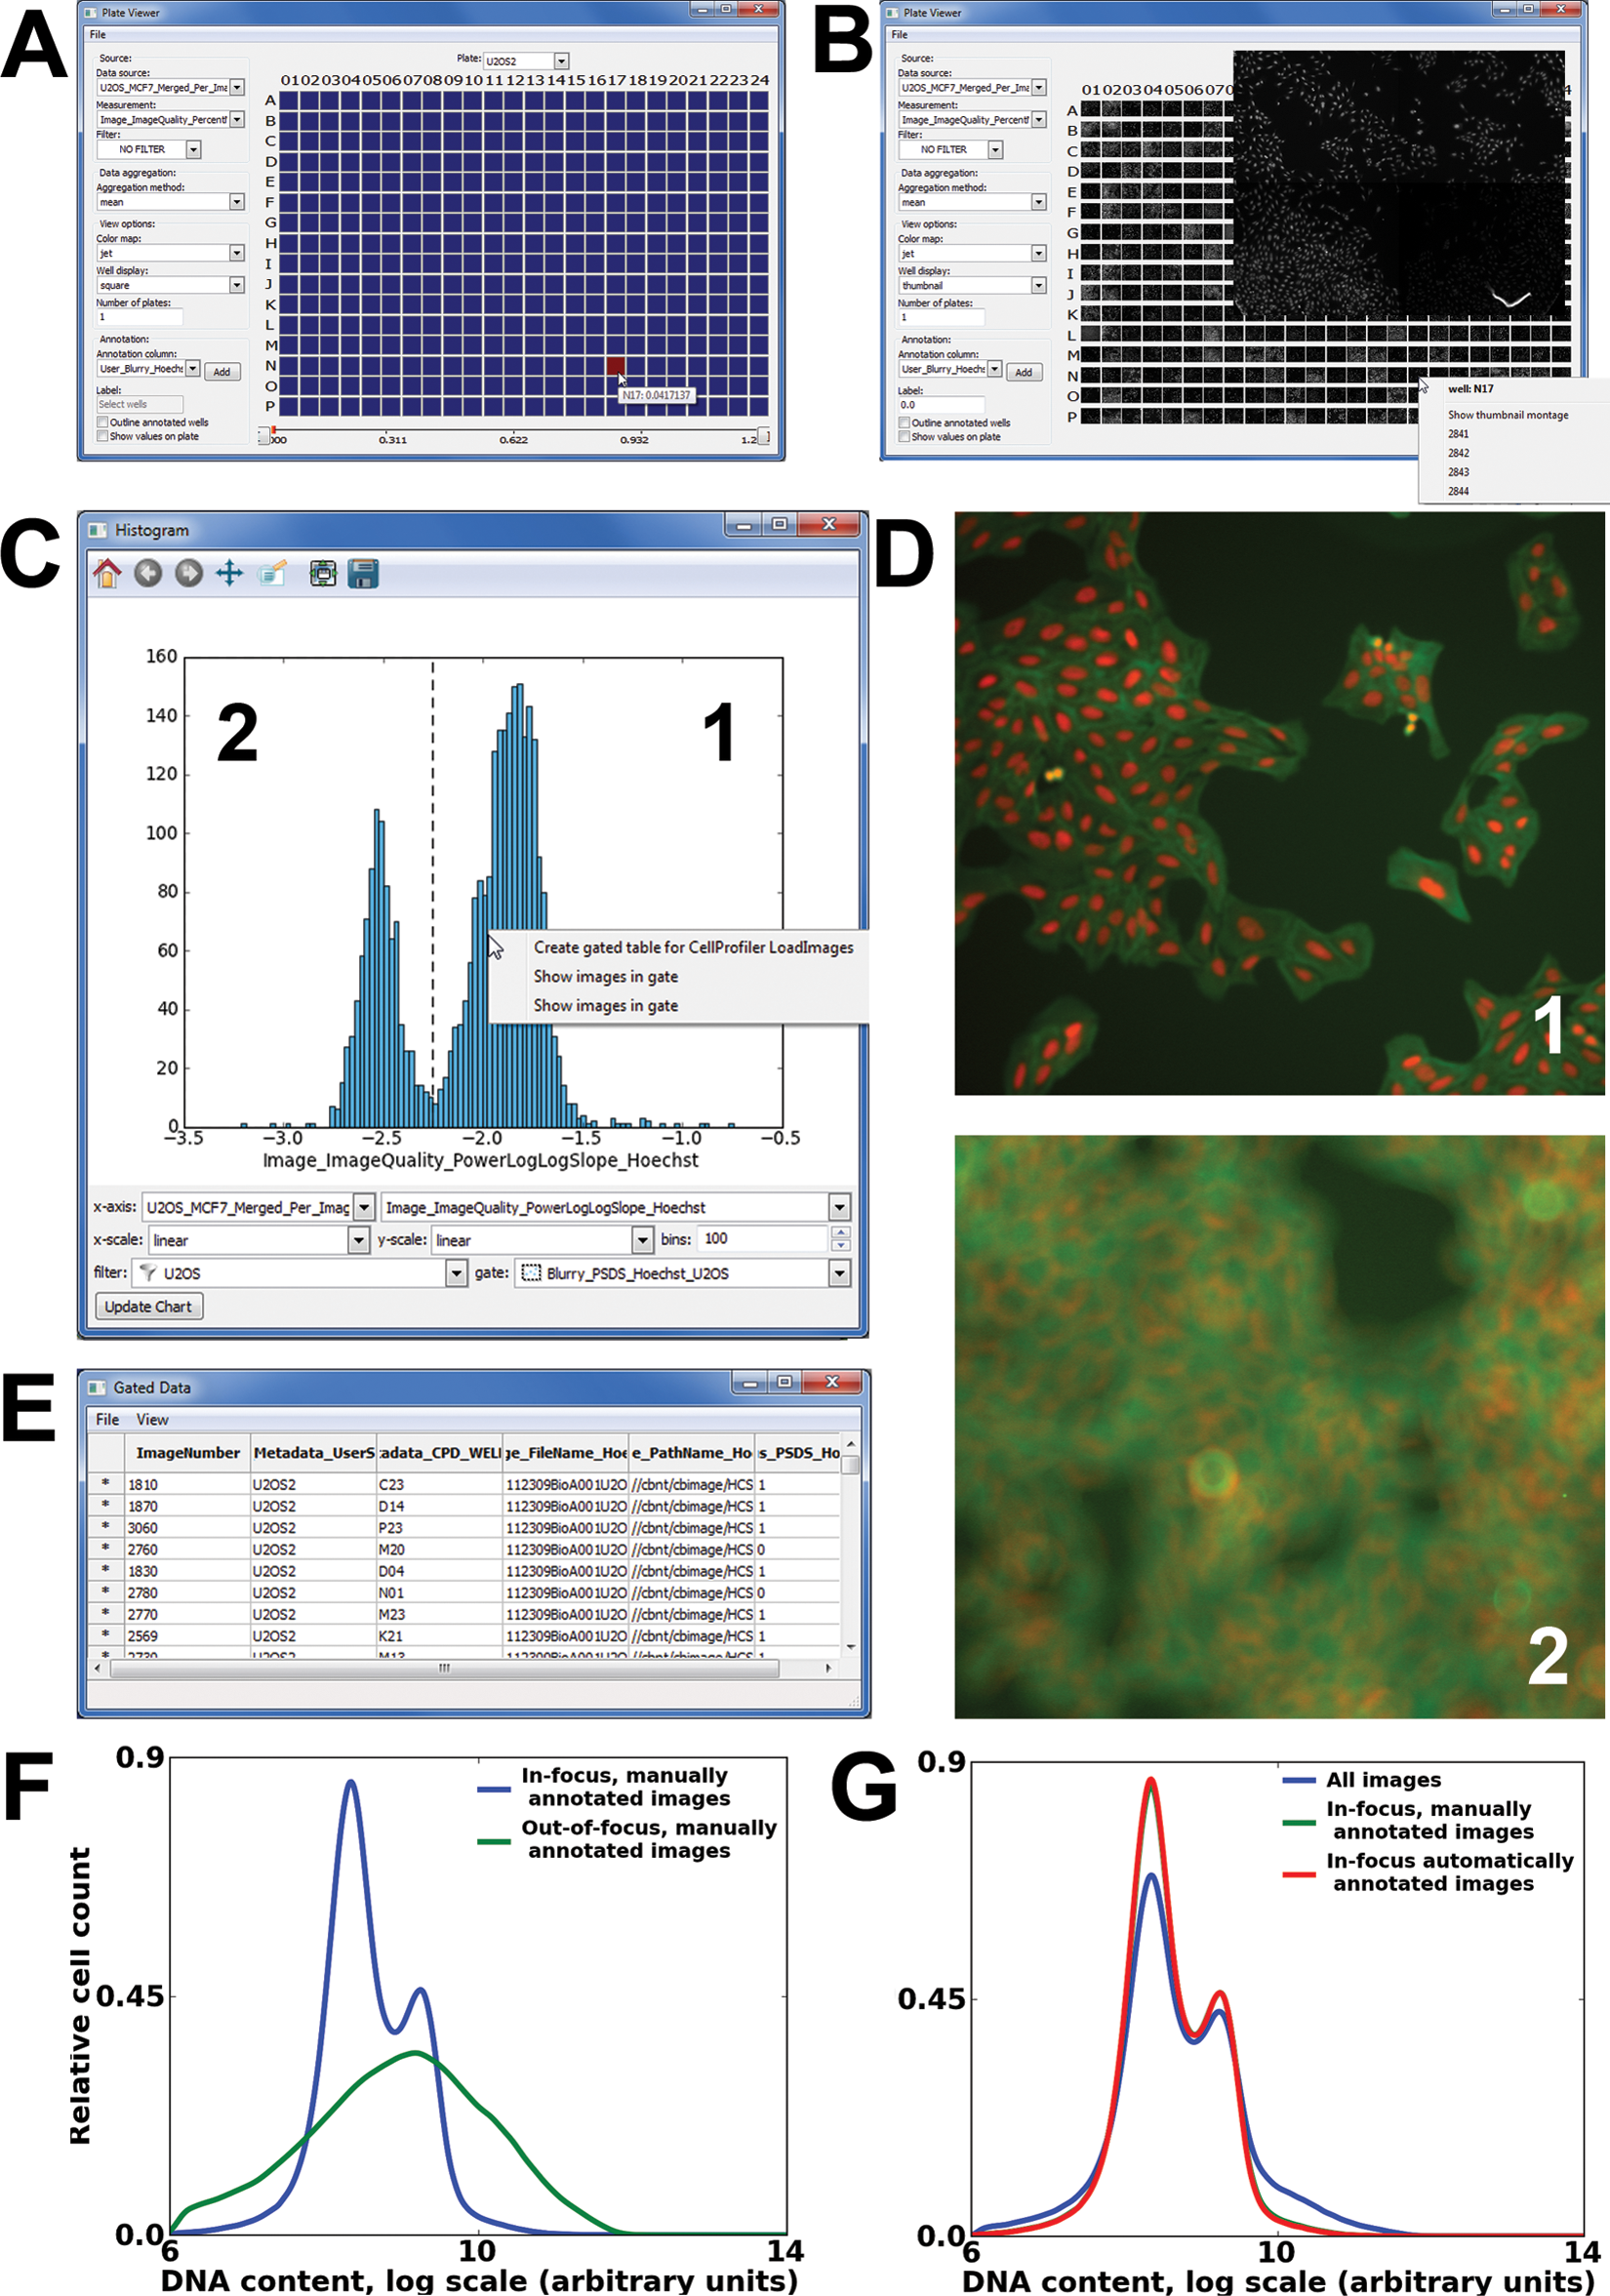
Screenshots of the Plate Viewer and Histogram tools in CellProfiler Analyst. (
For screens involving a large number of plates, visual inspection for QC assessment is not recommended, and a more quantitative approach is required. We typically begin our assessment using the Histogram or ScatterPlot tool for visualization of image-level measurements, proceeding to individual images for manual review as needed. The approach is to plot the metric appropriate to the specific QC problem and then identify QC thresholds that exclude unacceptable images. Figure 4C shows a histogram of Hoechst PLLS values, revealing a bimodal distribution, in contrast to the expected unimodal distribution if all images were in-focus. An example image from each peak is shown in Figure 4D , revealing marked differences in focus.
In some instances, an image may contain an unforeseen artifact not captured by the metrics described here, or the recommended QC metrics may be confounded by the phenotype of interest. In both cases, it is not straightforward to select a single QC threshold for a given metric. Machine learning provides a powerful means to allow the computer to identify unusable images based on a few examples. 12 CellProfiler Analyst contains a machine learning tool that has been validated for phenotypic scoring at the per-cell level. 13 This same framework can be extended for per-image machine learning–based QC scoring by referring CellProfiler Analyst to a table of image measurements.
Applying QC thresholds to exclude images
The final workflow task is to apply the desired QC metrics and thresholds to exclude unacceptable images from further analysis. For example, in Figure 4C , a screener using the Histogram tool would notice a distinct clustering between in- and out-of-focus images and would like to remove the out-of-focus images from further analysis. This can be accomplished in CellProfiler Analyst by manually delineating a horizontal subsection of the plot containing the subpopulation of acceptable images (a procedure known as “gating”). Because the more positive PLLS values correspond to in-focus images, we manually select a threshold that falls at the trough between the two peaks ( Fig. 4C ). CellProfiler Analyst allows for the creation of multiple gates, which is useful if a combination of metrics is needed to produce the final QC result. The screener may label a new gate with a descriptive name (e.g., “InFocus”) for future reference. The same can be done using the ScatterPlot and Density Plot visualization tools. Once a gate is defined, it may be used to filter any of the measurements visualized by the tools in CellProfiler Analyst. Using the automatic assessment of blurriness, we found that the chosen PLLS threshold of −2.27 resulted in the exclusion of 910 (29.7%) of 3064 images as blurry, whereas 2154 images (70.3%) were deemed in-focus. Comparing this result to the manual annotations of this same image set, 81 (8.9%) of the 910 “blurry” images were false positives and in fact in-focus, and 28 (1.3%) of the 2154 “in-focus” images were false negatives and in fact were manually annotated as blurry. This yielded an F-score of 0.975. By excluding blurry images based on the automated QC analysis, we can see improvement in a quantitative measure heavily affected by blurring such as DNA content ( Fig. 4F , G ).
It is often sufficient to mark acceptable images with a new “flag” column in the experiment’s database to assist in downstream data analysis. For illumination correction calculations, however, aberrant images must be excluded and the illumination correction pipeline must be rerun because illumination correction is not robust against poor image quality. 14 Typically, it is also desirable to exclude the images from the phenotypic analysis pipeline. To assist in these goals, one can produce a list of images filtered by any or all of the gates in CellProfiler Analyst; this list consists of the file and path names of the accepted images along with links to the original images for inspection ( Fig. 4E ). This list can then be exported as a file of comma-separated values (CSV) for use in a CellProfiler (re-)analysis pipeline; this pipeline would contain the Load Data module, which loads the contents of the CSV file. Alternately, the full list of images can be exported but with binary QC flags for each image. In this case, the analysis pipeline should contain a Flag Image module to filter images based on the flags.
Saving QC gates and workspaces
The choice of suitable QC metrics and their appropriate thresholds is typically determined empirically, depending on the context of the assay and taking into account the expected variation between experiments. Once a set of measures and thresholds has been found to be reliable, the user may save the gates as part of a configuration file that can later be loaded by CellProfiler Analyst and/or as a workflow file to apply the same tools, metrics, and gates to a new experiment. The workflow file saves the information necessary to re-create all the display tools and settings that were open during a prior QC review session. In this way, a user can easily reproduce and display a set of consistently used measurements for each new screen. We have provided an example configuration (or “properties”) file and a workflow file as supplementary material; these files will load and display some of the more commonly used metrics from a database of measurements and the image set mentioned above, available from http://www.cellprofiler.org/published_pipelines.shtml.
Conclusions
We characterized several QC metrics to exclude low-quality images in an HCS experiment. Our goal in this work was to provide a suite of recommended HCS QC metrics to remove aberrant images from consideration, all in the context of an open-source workflow.
All candidate QC measures are computed as part of a QC pipeline in CellProfiler. Once the QC measures have been made, CellProfiler Analyst is used to interact with the data using a variety of visualization tools. Gating is used to create custom thresholds for each QC metric of interest, and the gates are combined to yield the final list of acceptable images for downstream processing. All pipelines, workflows, and gates can be saved for use in later experiments. By integrating these data metrics and visualizations in a user-friendly software tool, biologists can automatically detect image aberrations that would otherwise corrupt the data and diminish the quality of their experimental results.
Footnotes
Acknowledgements
We thank Dr. Carolina Wählby for her input on statistical analysis and Dr. Sigrun Gustafsdottir for preparing cells for the microscopy image set. This study was funded by the National Institutes of Health (R01 GM089652 to AEC, U54 HG005032 to Stuart Schreiber, and RL1 HG004671 to Todd Golub, administratively linked to RL1 CA133834, RL1 GM084437, and UL1 RR024924).