
Abstract
Cell Painting is a high-throughput phenotypic profiling assay that uses fluorescent cytochemistry to visualize a variety of organelles and high-content imaging to derive a large number of morphological features at the single-cell level. Most Cell Painting studies have used the U-2 OS cell line for chemical or functional genomics screening. The Cell Painting assay can be used with many other human-derived cell types, given that the assay is based on the use of fluoroprobes that label organelles that are present in most (if not all) human cells. Questions remain, however, regarding the optimization steps required and overall ease of deployment of the Cell Painting assay to novel cell types. Here, we used the Cell Painting assay to characterize the phenotypic effects of 14 phenotypic reference chemicals in concentration–response screening mode across six biologically diverse human-derived cell lines (U-2 OS, MCF7, HepG2, A549, HTB-9 and ARPE-19). All cell lines were labeled using the same cytochemistry protocol, and the same set of phenotypic features was calculated. We found it necessary to optimize image acquisition settings and cell segmentation parameters for each cell type, but did not adjust the cytochemistry protocol. For some reference chemicals, similar subsets of phenotypic features corresponding to a particular organelle were associated with the highest-effect magnitudes in each affected cell type. Overall, for certain chemicals, the Cell Painting assay yielded qualitatively similar biological activity profiles among a group of diverse, morphologically distinct human-derived cell lines without the requirement for cell type–specific optimization of cytochemistry protocols.
Introduction
The next-generation blueprint of computational toxicology at the U.S. Environmental Protection Agency (EPA), (i.e. US EPA CompTox Blueprint), 1 advocates the use of nontargeted, high-throughput profiling assays for initial characterization of the biological activity of environmental chemicals. Ideally, such profiling assays should (1) be capable of being deployed in a high-throughput, concentration–response screening format; and (2) provide high-content data that can be used to identify potency thresholds for perturbation of cellular biology and provide information on putative mechanisms of toxicity. To date, two high-throughput profiling assays have been identified that meet these criteria: high-throughput transcriptomics (HTTr) using whole-transcriptome targeted RNA sequencing (RNA-Seq), 2 and imaging-based, high-throughput phenotypic profiling (HTPP) using Cell Painting. 3 Both of these assays are currently being operationalized at the EPA for use in a tiered toxicity-testing framework based on New Approach Methodologies (NAMs): technologies, methodologies, approaches, or combinations thereof that can be used to provide information on chemical hazard and risk assessment that avoids the use of intact animals. 4
A third criterion that is desirable for high-throughput profiling assays is compatibility for use among a wide variety of human-derived cell types. Different cell types express different complements of genes and proteins both in vivo and when cultured in vitro. As such, it is widely recognized in the field of toxicology that no single cell type or cell-based in vitro test system can capture the diversity of human biology that may be perturbed by the diverse universe of chemicals that may be present in the environment. Therefore, the EPA’s CompTox Blueprint recommends using high-throughput profiling assays to screen environmental chemicals across multiple biologically diverse cell types that represent different aspects of human biology. 1 During the next several years, it is anticipated that the HTTr and HTPP approaches will be applied to multiple human-derived cell types, thereby providing broad, complementary coverage of molecular and phenotypic responses throughout a much larger swath of biological space than the existing Toxicology Forecaster (ToxCast) and Toxicity Testing in the 21st Century (Tox21) assay portfolios. 5 The compatibility of targeted RNA-Seq with multiple human-derived cell types has been demonstrated in the scientific literature.6–9 Many questions remain, however, regarding the general compatibility and portability of the Cell Painting assay among different cell types, as well as what optimization steps are needed for adapting the assay to novel cell models. These topics were briefly discussed at a recent colloquium entitled “Cell Painting in Drug Discovery” at the annual Society for Biomolecular Imaging and Informatics (SBI 2 ) conference in 2019. These topics remain an open research question because, to date, published examples of the compatibility of the Cell Painting assay with multiple human-derived cell types are scarce.
In one of the first Cell Painting publications, Gustafsdottir et al. presented a qualitative comparison of fluorophore labeling patterns in a collection of morphologically distinct human-derived cell types (U-2 OS, MCF7, HTB-9, A549, and 3T3). 10 This qualitative comparison indicated that the fluoroprobe labeling and imaging procedures used in the Cell Painting assay are compatible with multiple cell types. Likewise, Bray et al. noted that their research group and collaborators have successfully applied the Cell Painting assay to a variety of different cell types, and provided qualitative images of labeling patterns in three human-derived cell types (U-2 OS, A549, and human umbilical vein endothelial cells). 3 Absent from these reports, however, were quantitative data, information on cell type–specific optimization steps, information on feature extraction or comparison among cell lines of phenotypic responses due to treatment. More recently, Warchal et al. have used the Cell Painting assay to screen libraries of pharmacological compounds in a set of biologically and morphologically distinct breast cancer cell lines, and have developed computational approaches to quantify and visualize the degree of dissimilarity in phenotypic response profiles throughout this cell line panel.11–13 These studies were conducted in the context of personalized medicine: that is, the identification of drugs that produce distinct phenotypes in cell lines with a particular clinical subtype. Each cell line in the breast cancer cell line panel responded similarly to a majority of active chemicals tested, whereas a smaller subset of chemicals produced a dissimilar phenotype in at least one of the cell lines within the panel. 11 Chemicals that produced a dissimilar phenotype in a particular cell line were identified as the most interesting for potential personalized medicine applications. In contrast, chemicals that reliably produce similar phenotypes among diverse cell lines would be of interest to researchers aiming to identify sets of Cell Painting reference treatments (i.e., assay controls) for incorporation into high-throughput screening (HTS) of biologically diverse cell line panels and for tracking of Cell Painting assay performance.
In pursuit of this objective, we used the Cell Painting assay to quantitatively characterize the phenotypic effects of 14 reference chemicals in concentration–response screening mode (n = 7 test concentrations per chemical) throughout six biologically diverse and morphologically distinct human-derived cell lines (U-2 OS, MCF7, HepG2, A549, HTB-9, and ARPE-19) grown in monolayer. To assess general compatibility and ease of portability across cell lines, the same cytochemistry protocol was used and the same set of phenotypic features were extracted for each cell line. Image acquisition parameters, including Z-offsets, laser power, and acquisition times for confocal imaging, as well as cell segmentation were optimized for each cell line. In addition to qualitative and quantitative comparisons of phenotypic response profiles, concentration–response modeling of the data was performed to assess variation in potencies associated with changes in cellular morphology across the cell line panel. Overall, for certain chemicals, the Cell Painting assay yielded similar biological activity profiles across the cell line panel without the requirement for cell type–specific optimization of cytochemistry protocols. For a majority of chemicals tested, potency thresholds associated with changes in cellular morphology did not vary by more than one order of magnitude. Chemicals that produce similar phenotypic profiles at similar potencies throughout the diverse cell line space are the most promising candidates for selection as plate-based assay controls for screening of biologically diverse cell line panels using the Cell Painting assay.
Materials and Methods
Materials and Test Chemicals
A549 human lung carcinoma cells (cat. no. CCL-185), ARPE-19 human retinal pigmented epithelial cells (cat. no. CRL-2302), HepG2 human hepatocellular carcinoma cells (cat. no. HB-8065), 5637 human urinary bladder carcinoma cells (cat. no. HTB-9), MCF7 human breast adenocarcinoma cells (cat. no. HTB-22), and U-2 OS human osteosarcoma cells (cat. no. HTB-96) were purchased from ATCC (Manassas, VA). Dulbecco’s modified Eagle’s medium (DMEM; cat. no. 10-013-CV), conical tubes, and culture flasks of various sizes (T25, T75, and T225) were purchased from Corning (Corning, NY). Heat-inactivated fetal bovine serum (HI-FBS) was purchased from Sigma-Aldrich (St. Louis, MO). CellEvent Caspase 3/7, 10× Gibco penicillin–streptomycin–glutamine (PSG; cat. no. 10378-016), TrypLE Select (cat. no. 125663-011), 0.4% trypan blue solution, Countess cell-counting chamber slides, and MicroAmp optical adhesive film were purchased from ThermoFisher Scientific (Waltham, MA). Solutions of 16% paraformaldehyde (PFA) were purchased from Electron Microscopy Sciences (Hatfield, PA). CellCarrier-384 Ultra microplates were purchased from PerkinElmer (Waltham, MA). Echo Qualified 384-well polypropylene (384PP) and 384-well low-dead-volume (384LDV) plates were purchased from LabCyte (San Jose, CA). Alexa Fluor 568 Phalloidin (cat. no. A12380), Concanavalin A (cat. no. C11252), Hoechst-33342 (cat. no. H3570), MitoTracker DeepRed (cat. no. M22426), propidium iodide (cat. no. P3566), SYTO14 (cat. no. S7576), and Wheat Germ Agglutinin Alexa Fluor 555 Conjugate (cat. no. W32464) were purchased from ThermoFisher.
Concentration–response screening was performed using a set of 14 phenotypic reference chemicals found to produce morphological phenotypes in U-2 OS cells using the Cell Painting assay. 10 Four additional chemicals were also screened, two of which were not expected to elicit phenotypic responses in any of the six cell lines at or below 100 µM (saccharin and sorbitol). Two cytotoxic chemicals (staurosporine and ionomycin) were also included at a single concentration as cell viability positive controls. All 14 reference chemicals, negative controls, and cytotoxic chemicals can be found in Nyffeler et al. 14 and the EPA chemical dashboard (https://comptox.epa.gov/dashboard/chemical_lists/HTPP2019_REFSET).
Cell Culture
Once acquired from ATCC, each of the six cell lines was stored in vapor phase liquid nitrogen, thawed one at a time, and cultured in the same growth medium (DMEM + 10% HI-FBS + 1× PSG). Cell lines were detached from the flask via incubation with 1× TrypLE Select for 7 min (ARPE-19), 8 min (A549, HepG2, MCF7, and U-2 OS), or 10 min (HTB-9). Passaging and maintenance proceeded for each cell line as described in Nyffeler et al. 14 Appropriate seeding densities for use during the expansion phase were determined for each cell line to keep a consistent passaging schedule [4 days in vitro (DIV4)] among all cell types. Each cell line was passaged and expanded individually with cryopreservation occurring at P4 (HepG2 and HTB-9), P5 (A549), P6 (MCF7 and U-2 OS), and P11 (ARPE-19) using the manufacturer’s recommended cryopreservation media.
For concentration–response screening experiments, a single vial of each cell line was thawed, cultured in growth medium, and expanded up to three consecutive passages for each experimental replicate to achieve enough cell mass for 384-well plating. Cell yields and viabilities were determined using a Countess II automated cell counter (ThermoFisher Scientific) via the manufacturer’s protocol prior to seeding in CellCarrier-384 Ultra microplates. Cell-seeding densities for 384-well plating were optimized for each cell type to allow analysis of at least 300 cells/well across fewer than nine individual fields-of-view and not exceeding 50% confluency at the time of sampling. Each cell line was seeding at the following densities and passage numbers: A549 (P7–P9) and ARPE-19 (P13–P15) at 500 cells/well, HepG2 (P6–P8) and HTB-9 (P5–P7) at 1000 cells/well, MCF7 (P8–P10) at 2500 cells/well, and U-2 OS (P8–P10) at 400 cells/well. Total culture volume for each cell type was 40 µL per well. Each test plate was placed into a 37 °C humidified incubator with 5% CO2 atmosphere for a 24 h recovery period prior to dosing.
Chemical Treatment
All 14 phenotypic reference chemicals, along with the two negative controls and two cell viability positive controls, were solubilized in DMSO at concentrations ranging from 4 to 20 mM to create chemical stock solutions and stored at −20 °C. These chemical stocks were pipetted into an Echo Qualified 384PP plate and were used in dose plate preparation to make dilution series as described in Nyffeler et al. 14 The resulting Echo Qualified 384LDV plates containing reference chemicals at 200× testing concentration were sealed with an adhesive aluminum film and stored at −80 °C until needed. At 24 h post plating, a LabCyte Echo 550 acoustic dispenser was used to dispense 200 nL of 200× concentrated chemical treatment into randomized test wells.
The 14 reference chemicals and two negative controls were tested at seven concentrations (approximate half-log spacing) with three technical replicates per plate. Concentration ranges are listed in Table 1 . The two cell viability positive controls were tested at a single concentration (30 µM ionomycin, 1 µM staurosporine) with six technical replicates per plate. Each cell line used in this experiment had a total of three independent biological replicates with cultures established on different days. Cells were exposed to chemicals 24 h after initial plating and sampled 48 h after chemical treatment.
Chemical Identifiers and Test Concentration Ranges.
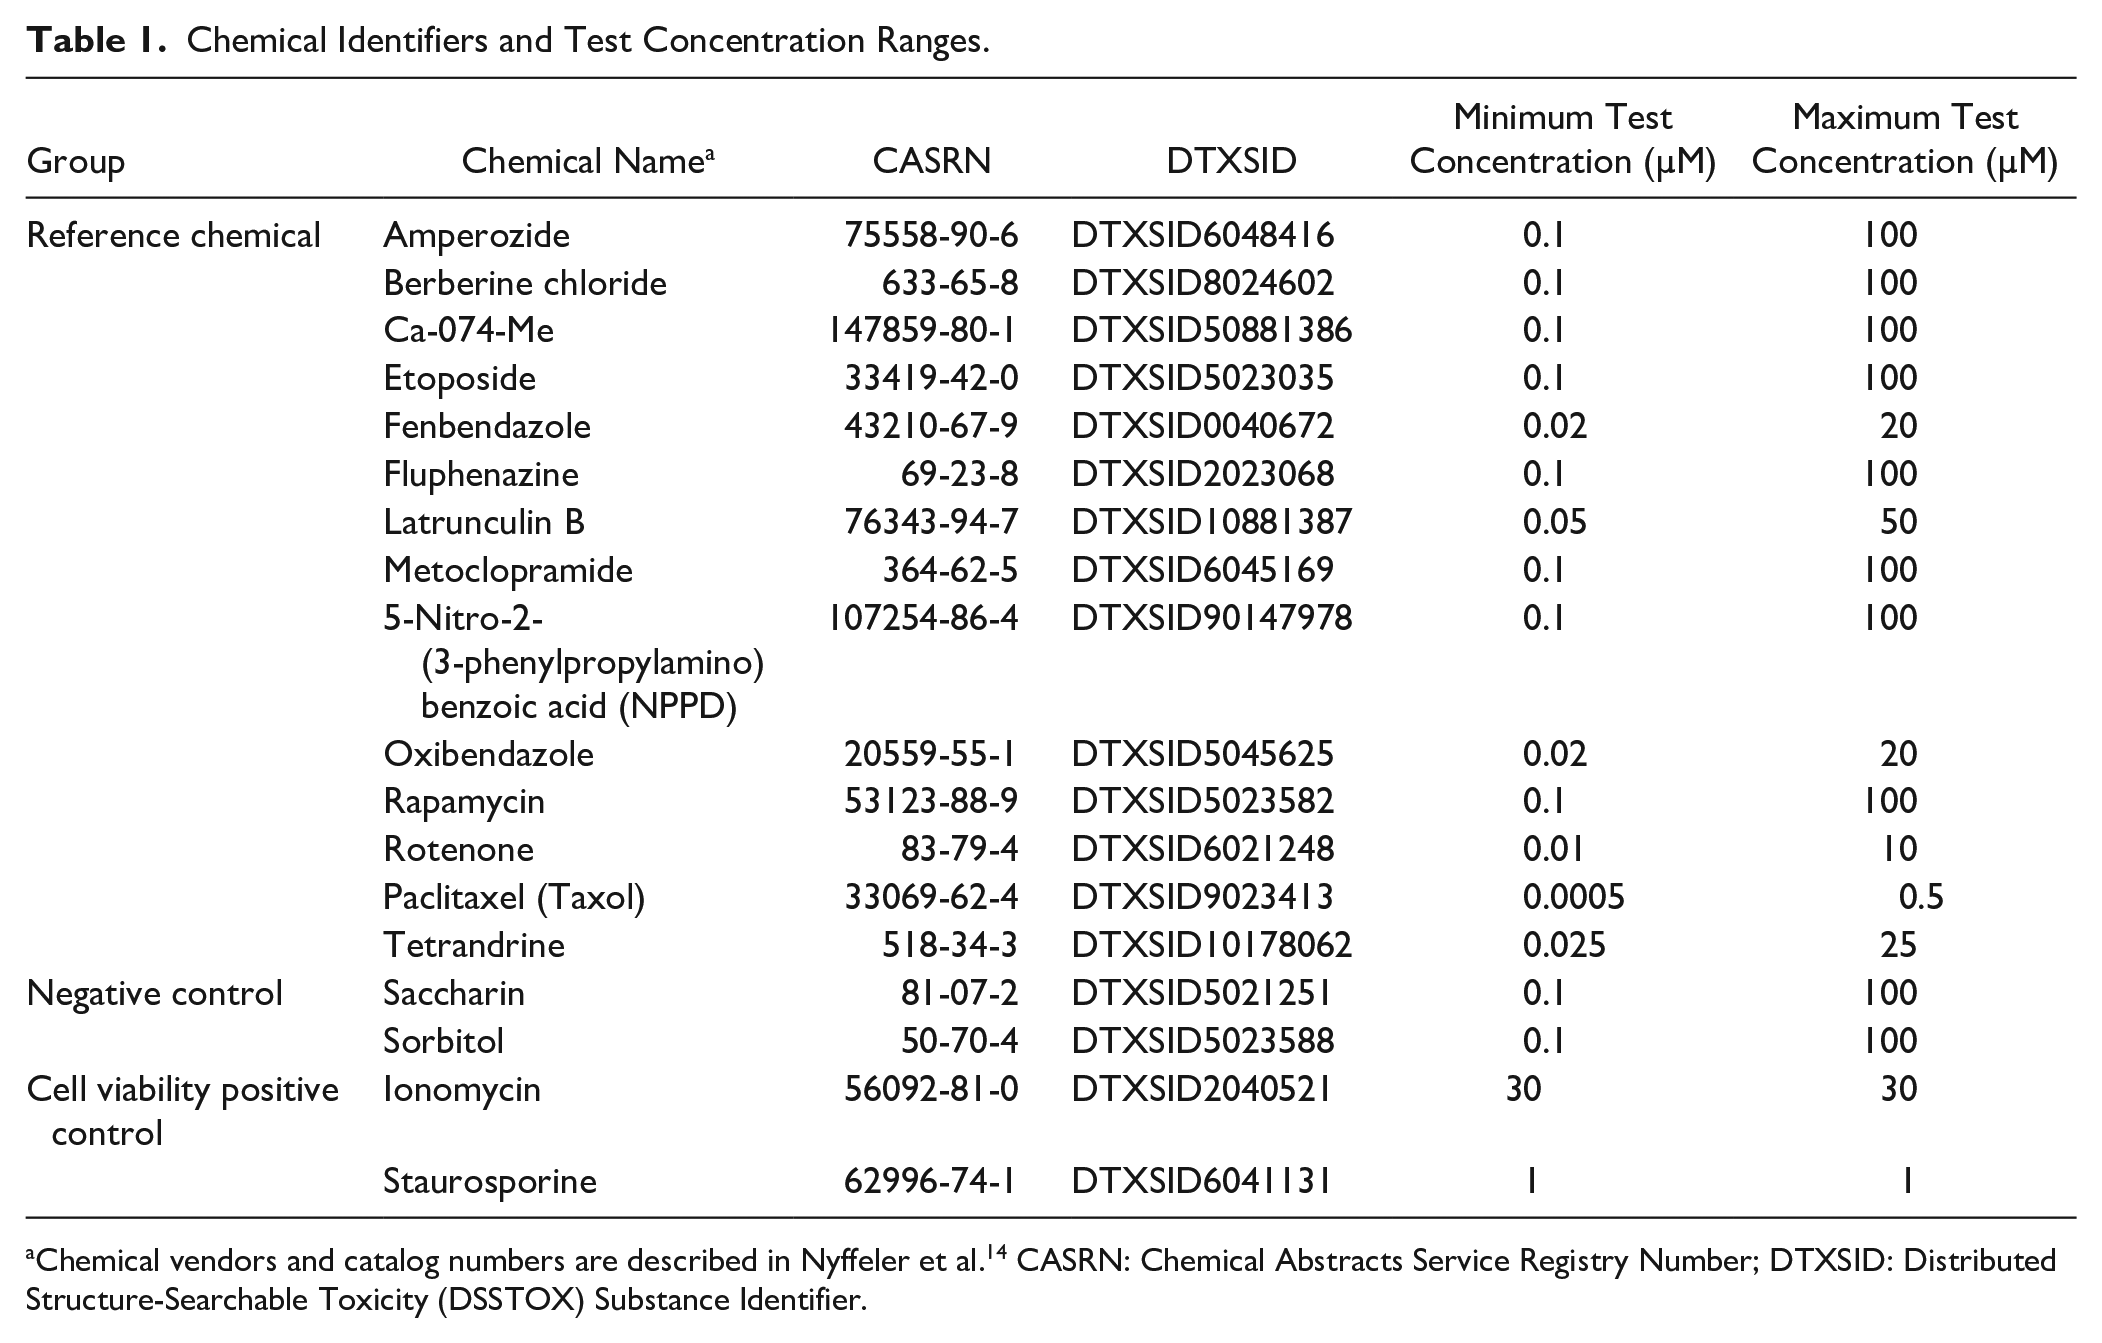
Chemical vendors and catalog numbers are described in Nyffeler et al. 14 CASRN: Chemical Abstracts Service Registry Number; DTXSID: Distributed Structure-Searchable Toxicity (DSSTOX) Substance Identifier.
Cell Viability (CV) Assay and Image Processing
Assay plates were live-labeled with a solution of Hoechst-33342 (H-33342), CellEvent Caspase 3/7 (Casp), and propidium iodide (PI) in growth medium to assess cytostatic and cytotoxic chemical effects. A Certus FLEX microdispenser equipped with a 0.10/0.03 Gyger microvalve was used to dispense 2 µL of staining solution into each assay well. Final concentrations of each fluorescent label per well were 8.1 µM of H-33342, 5 µM of Casp, and 3.75 µM of PI. Plates were incubated at 37 °C for 30 min prior to being fixed with 12 µL of 16% PFA using a MultiFlo FX Microplate Dispenser with a 1 µL peri-pump cassette. Fixation was followed by a 10 min incubation period at room temperature protected from light. Plates were washed four times with 1× phosphate-buffered saline (PBS) using the same MultiFlo FX Microplate Dispenser, with the final wash remaining in the wells as a storage buffer. Plates were sealed with optical adhesive tape and stored at 4 °C. Plates were removed from 4 °C storage at least an hour prior to image acquisition to give each plate time to equilibrate to room temperature.
Fluorescent images were captured and processed using an Opera Phenix High Content Screening System (PerkinElmer) and Harmony software (version 4.8; PerkinElmer). Images were acquired using a 5× objective and one field per well (2536 µm × 2536 µm). Excitation and emission pairings for imaging of H-33342, Casp, and PI were, respectively, 405 nm and 435–480 nm, 488 nm and 500–550 nm, and 561 nm and 570–630 nm. Images were prefiltered via the H-33342 channel to exclude regions containing debris and/or staining irregularities. This same channel was used for segmentation of the nuclei, and valid nuclei were selected based on intensity and size. The mean intensity of each valid nuclei was measured for both the Casp and PI channels. Cell-level data for each plate were exported for downstream analysis using R statistical software (version 3.4.1). This process is described in further detail in Nyffeler et al., 14 with both the Casp and PI channels being analyzed using the same methodology. Within each plate, cells with labeling intensity exceeding the 95th percentile of vehicle control cells in either the Casp or PI channel were scored as nonviable cells (i.e., responders). For both Casp and PI, the percentage of responders was then calculated for each well by dividing the total number of responders by the total number of all cells. A benchmark concentration (BMC) was then determined for Casp and PI, and the cytotoxic BMC was identified as the minimum of the Casp and PI BMCs. Cytostatic effects were determined via the EC50 of the normalized cell count. The in vitro point of departure (POD) for the cell viability assay (CV POD) was calculated using the minimum of the cytostatic EC50 and cytotoxic BMC values. The no observable effect concentration (NOEC) and lowest observable effect concentration (LOEC) were determined as the highest tested concentration lower than and lowest tested concentration higher than the CV POD, respectively.
Cell Painting (CP) Assay and Image Processing
Assay plates were fluorescently labeled using the adapted Cell Painting procedure as described in Nyffeler et al. 14 Phenotypic profiling of cellular organelles [nucleus, nucleoli, endoplasmic reticulum (ER), actin cytoskeleton, golgi, plasma membrane (actin cytoskeleton, golgi, plasma membrane, or AGP), and mitochondria] was performed to examine morphological responses to chemical treatments across a variety of human-derived cell lines (A549, ARPE-19, HepG2, HTB-9, MCF7, and U-2 OS). Each plate was first live-cell-labeled with MitoTracker Deep Red, followed by a fixation and washing step using a MultiFlo FX Microplate Dispenser. Cells were permeabilized with 0.1% Triton X-100 and washed prior to staining with 1% bovine serum albumin in 1× PBS solution containing the remaining labeling reagents (Alexa Fluor 568 Phalloidin, Concanavalin A Alexa Fluor 488 Conjugate, Hoechst-33342, SYTO14, and Wheat Germ Agglutinin Alexa Fluor 555 Conjugate). In the final wash step, 80 µL 1× PBS was dispensed into each well as a storage buffer. Plates were then sealed with optical adhesive tape and stored at 4 °C until image acquisition. Each plate was removed from 4 °C and allowed to equilibrate to room temperature for at least 1 h prior to image acquisition.
An Opera Phenix High Content Screening System was used to acquire images of fluorescently labeled cells that were subsequently analyzed with Harmony software. Images for each cell line were obtained using a 20× water immersion objective in confocal mode using 2×2 pixel binning. Channel-specific Z-offsets, exposure times, and laser power settings were optimized for each individual cell line ( Suppl. Table 1 ) using a combination of randomly selected wells and vehicle-treated wells. These settings remained constant for each cell line throughout experiments. Images for each cell line were acquired with eight or nine unique fields per well, covering an area up to 1908 µm × 1908 µm per well.
Image processing was performed via Harmony software using a combination of cell segmentation and defining of cellular compartments (nucleus, membrane, cytoplasm, perinuclear space). Nuclear and cell segmentation was optimized for each cell line, with the Hoechst-33342 channel (nuclei) acting as a seed. A total of 1300 features (texture, intensity, etc.) were measured for each individual cell. The approximate number of cells analyzed for each cell line is listed in Supplementary Table 1 . Images were screened for wells containing <50 cells to exclude these from downstream analysis. Cell-level data corresponding to each plate were exported, and data reduction was performed using R statistical software. Median absolute deviation (MAD) was used to normalize cell-level data to vehicle controls within each plate for each endpoint. 3 The median of the normalized data was calculated for each well to derive well-level aggregate values. Well-level median data were then Z-transformed and used as input for concentration–response modeling with the open-source BMDExpress software package. 15 Highly cytotoxic treatments were excluded from BMC modeling of CP data by removing tested concentrations higher than the CV LOEC. Standardization and BMC modeling of the well-level data are as described in Nyffeler et al. 14 Features considered responsive to chemical treatment were those with a BMC lower than the highest tested concentration. Each of the 1300 features was grouped using channel, module, and compartment into 49 different categories as described in Nyffeler et al. 14 BMC values for each feature were used to calculate a median BMC for each category, and categories with ≥30% responsive features were ranked in ascending order by median BMC. The CP POD was defined as the category with the lowest potency values.
Comparison of Phenotypic Profiles
Well-level data corresponding to DMSO controls and the cell viability NOEC for each chemical by chemical by cell type combination were analyzed using a variation of the Theta Comparative Cell Scoring (TCCS) method described by Warchal et al.11,13 In instances when a cell viability NOEC could not be determined, the highest tested concentration was retained in the analysis. A total of n = 9 treatment wells per chemical by cell type combination and n = 72 DMSO control wells per cell line were included in the TCCS analysis. In brief, features with a Z-transformed well level value lower than 1.5 were imputed with a value of 0. Principal components analysis (PCA) was then performed using the prcomp function of the R stats package. The results from the first 10 principal components (PCs) for each sample (capturing >75% of the total variance in data) were retained and centered to DMSO controls (regardless of cell type). The Euclidean norm of a vector containing values for PC1 through PC10 was calculated as a metric of “distance” (i.e., magnitude of phenotypic change) from control, and the angular degree of each vector in comparison to a reference vector (i.e., theta) was calculated as a metric of similarity of phenotypic response profiles.
Results
Morphological Heterogeneity of Human-Derived Cell Lines
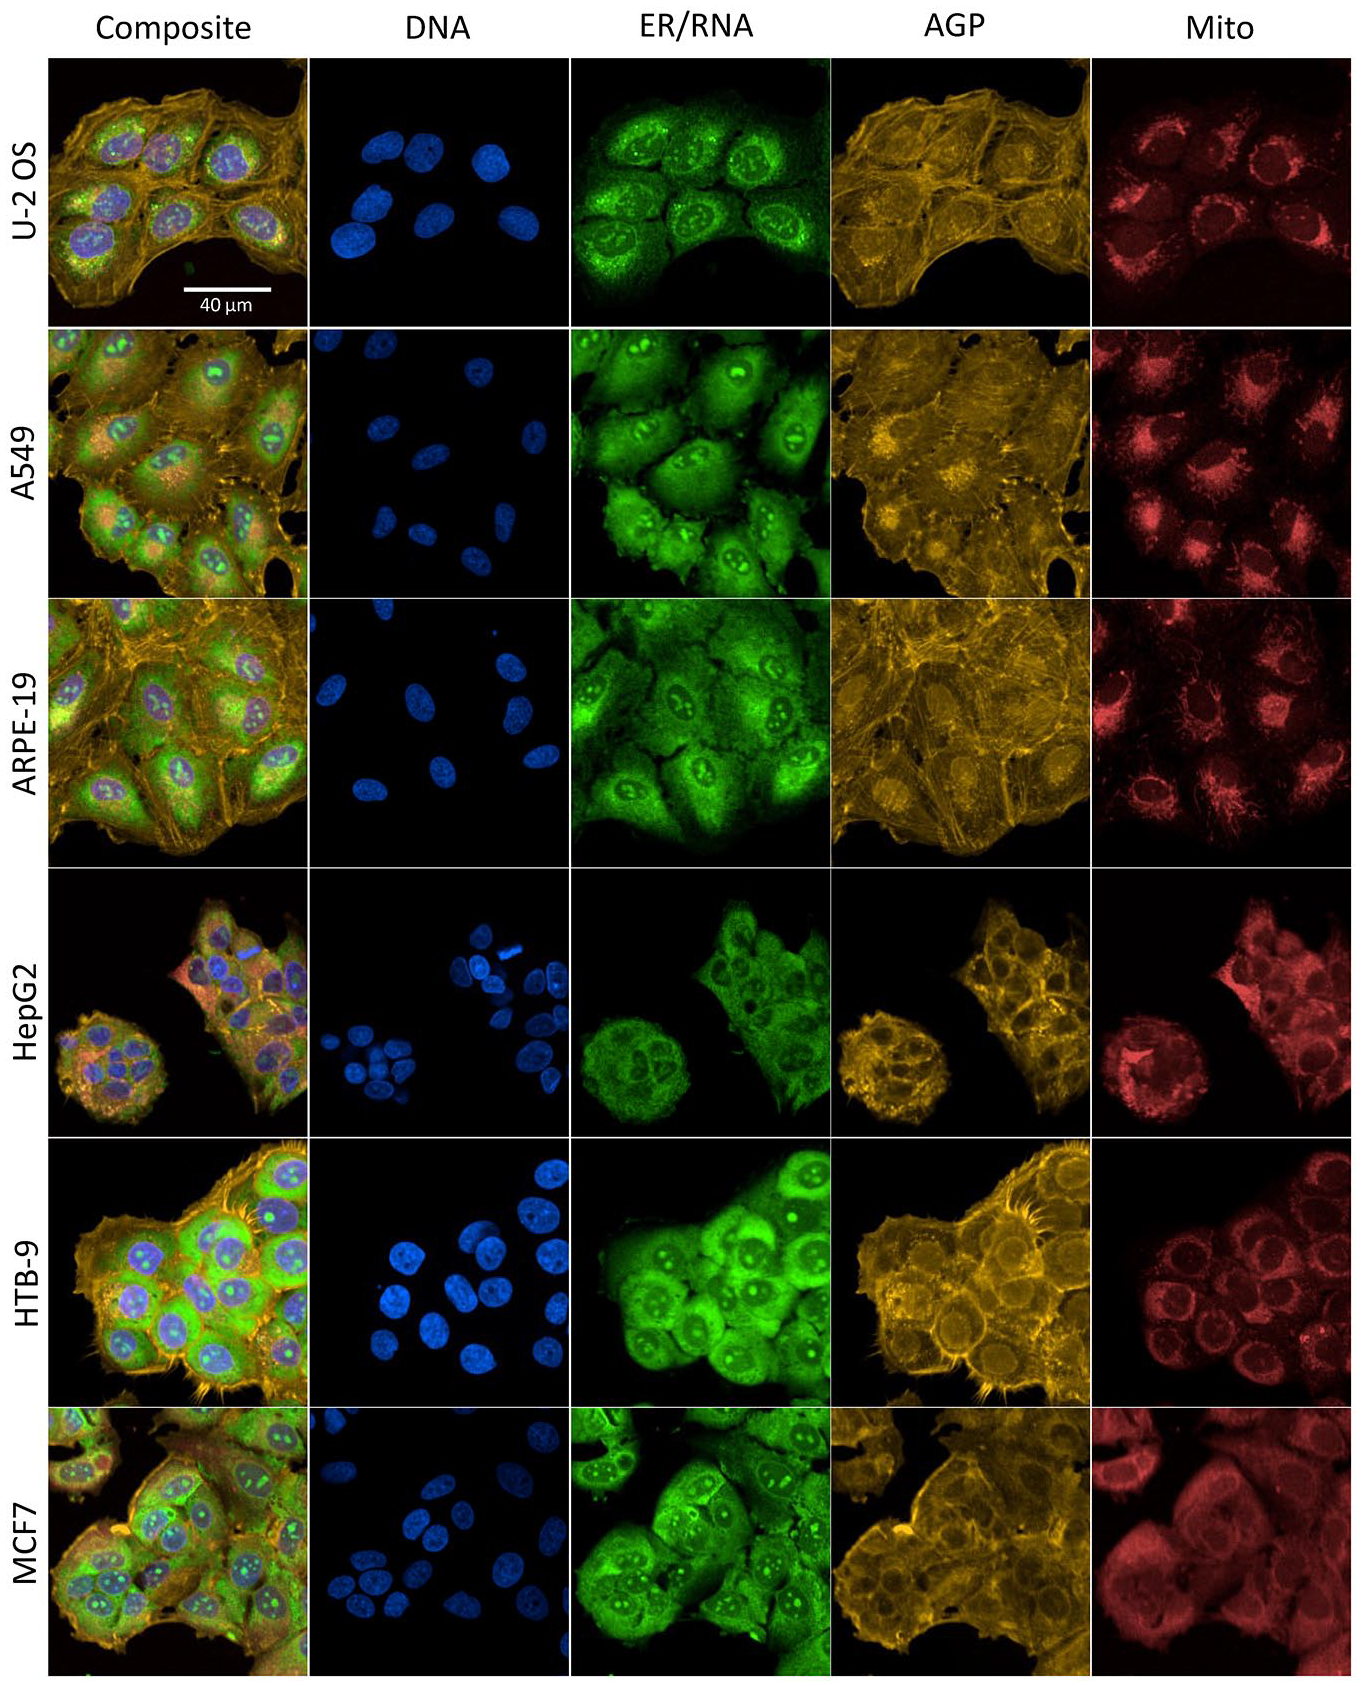
For this study, the Cell Painting assay as implemented in Nyffeler et al. 14 was used to evaluate chemical effects across six biologically diverse and morphologically distinct human-derived cell lines. In a first step, the morphology of the different cell lines was investigated in the absence of chemical treatment to qualitatively assess whether the fluorescent probes labeled organelles in a similar pattern to those characteristically observed in U-2 OS cells. Fluorescent labeling of the organelles of interest was apparent in all six cell lines and was generally consistent with the subcellular localization patterns previously observed in U-2 OS cells ( Fig. 1 ).10,14 Qualitative differences in cell size, compactness, and organelle symmetry were apparent when examining fluorescent channels, independently, across cell lines. U-2 OS, A549, and ARPE-19 cells tended to be larger in total area and to have higher granularity in the perinuclear region within the ER/RNA channel compared to other cell lines. In U-2 OS, A549, and ARPE-19 cells, ER/RNA fluorescent intensity diminished with increasing distance from the center of the cell. This pattern was less prominent in cell lines with more compact cytoplasm (i.e., HepG2, HTB-9, and MCF7). Nucleoli were prominently labeled in the nucleus region of each cell type. Labeling patterns in the actin cytoskeleton–Golgi–plasma membrane (AGP) channel had the highest degree of qualitative dissimilarity among cell lines. Prominent labeling of the cytoskeleton (visualized as striations) was observable in U-2 OS, A549, and ARPE-19 cells. In contrast, AGP labeling in the cytoplasm of more compact cell lines (HepG2, HTB-9, and MCF7) appeared more diffuse. The prominence of perinuclear AGP labeling varied both among cell lines and from cell to cell within a cell line. HTB-9 cells had the most prominent labeling of the plasma membrane among all cell types. Asymmetric perinuclear localization of mitochondria was apparent in U-2 OS, A549, and ARPE-19 cells, while more symmetric and diffuse mitochondrial labeling was apparent in HepG2, HTB-9, and MCF7 cells. Overall, organelles of interest appear to be reliably labeled in each of the respective cell types using a uniform staining protocol.
Comparison of Chemical-Induced Phenotypic Profiles among Cell Lines
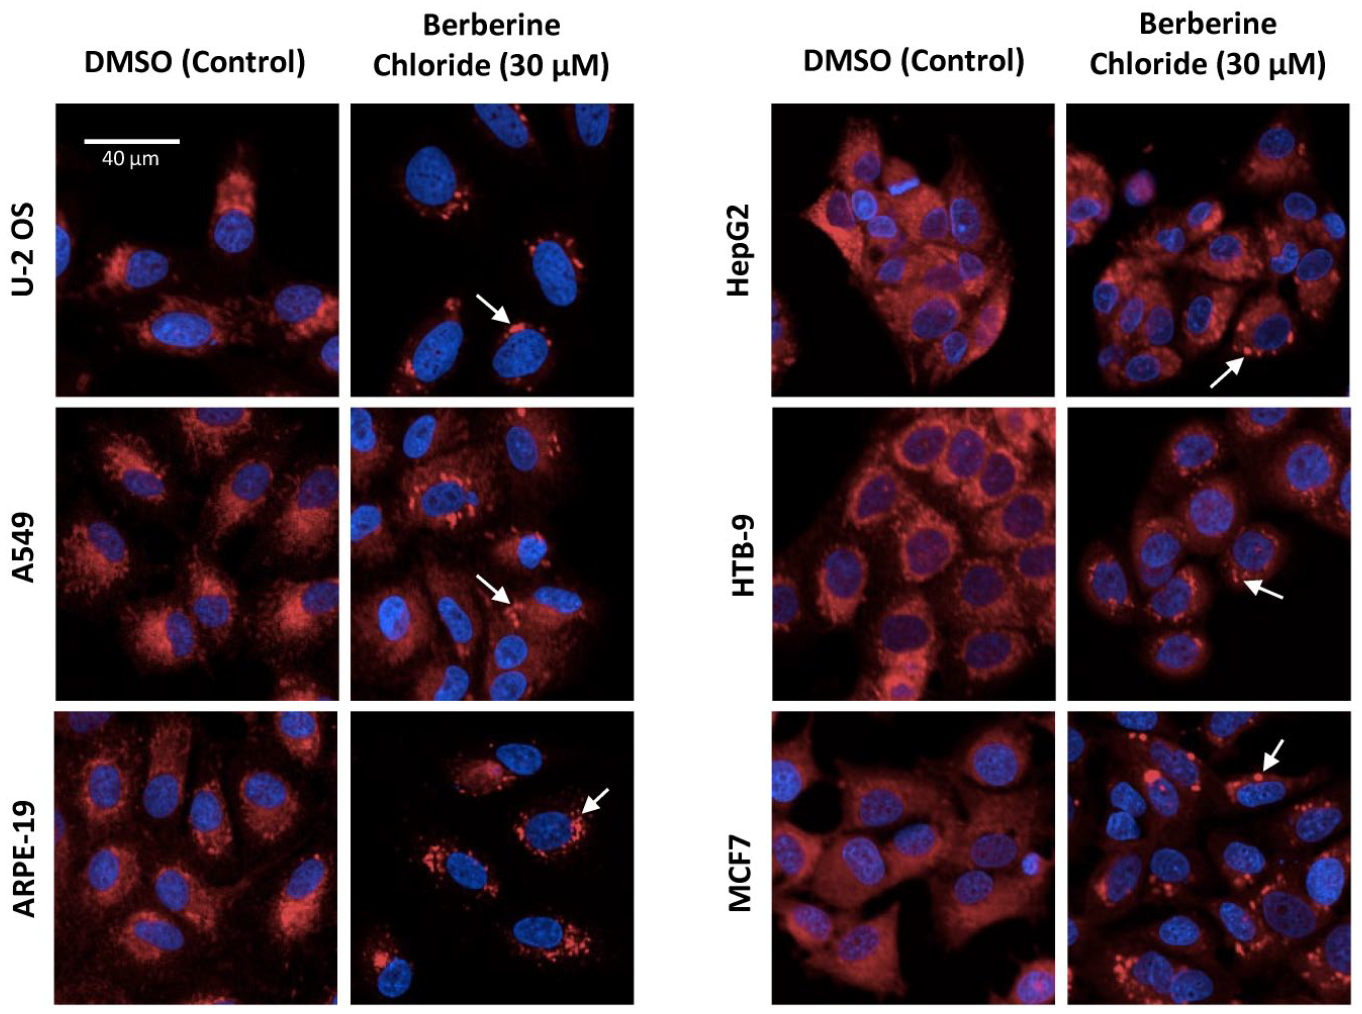
Next, a set of 14 reference chemicals along with two chemicals not expected to produce phenotypic changes in any of the cell lines up to 100 µM (saccharin and sorbitol) were screened in concentration–response mode. The chemicals were tested in seven-point concentration–response throughout all cell lines with an exposure duration of 48 h, as described in previous studies.10,14 For several of the tested chemicals, visual changes in cellular morphology were obvious in multiple cell lines, were qualitatively similar among affected cell lines, and were consistent with findings from previous studies in U-2 OS cells.10,14 For example, Figure 2 illustrates the effects of treatment with 30 µM berberine chloride among the various cell types. Effects on mitochondria morphology were observed in each cell line ( Fig. 2 ). The effects manifested as an increase in mitochondrial compactness. In addition, treatment with 3 µM Ca-074-Me produced changes in AGP-labeling patterns in each cell line, with the most prominent increases in intensity perinuclear labeling observed in cell lines with comparatively larger cytoplasmic area (i.e., U-2 OS, A549, and ARPE-19) ( Suppl. Fig. S1 ). Lastly, 0.3 µM etoposide treatment resulted in increases in overall cell size in most cell lines (U-2 OS, A549, ARPE-19, HepG2, and MCF7, but not HTB-9). The increase in cell size corresponded to effects in a variety of organelles and phenotypic features.
Concentration–response modeling of phenotypic profiling data was performed on all six cell lines. Results were visualized using potency–magnitude and accumulation plots as described.
14
Representative results for berberine chloride are shown in
Figure 3
, and results for the other 15 chemicals in the study are shown in
Supplementary Figure 2
. Each point on the potency–magnitude plots (
Fig. 3
, left two columns) is a phenotypic feature represented by the potency (i.e., the BMC) and maximum effect size (i.e., normalized magnitude) from the concentration–response modeling results, coded by fluorescent channel, cellular compartment, and feature type. Each point on the accumulation plots (
Fig. 3
, right two columns) represents the median feature-level potency for phenotypic categories in which ≥30 % of constituent features were affected by chemical treatment and are also coded by fluorescent channel, cellular compartment, and feature type. Gray and red vertical dotted lines represent the cytostatic EC50 and cell viability BMC, respectively. For all 14 reference chemicals, phenotypic effects occurred at concentrations lower than the threshold for cytostatic effects or cytotoxicity in each of the six cell lines (
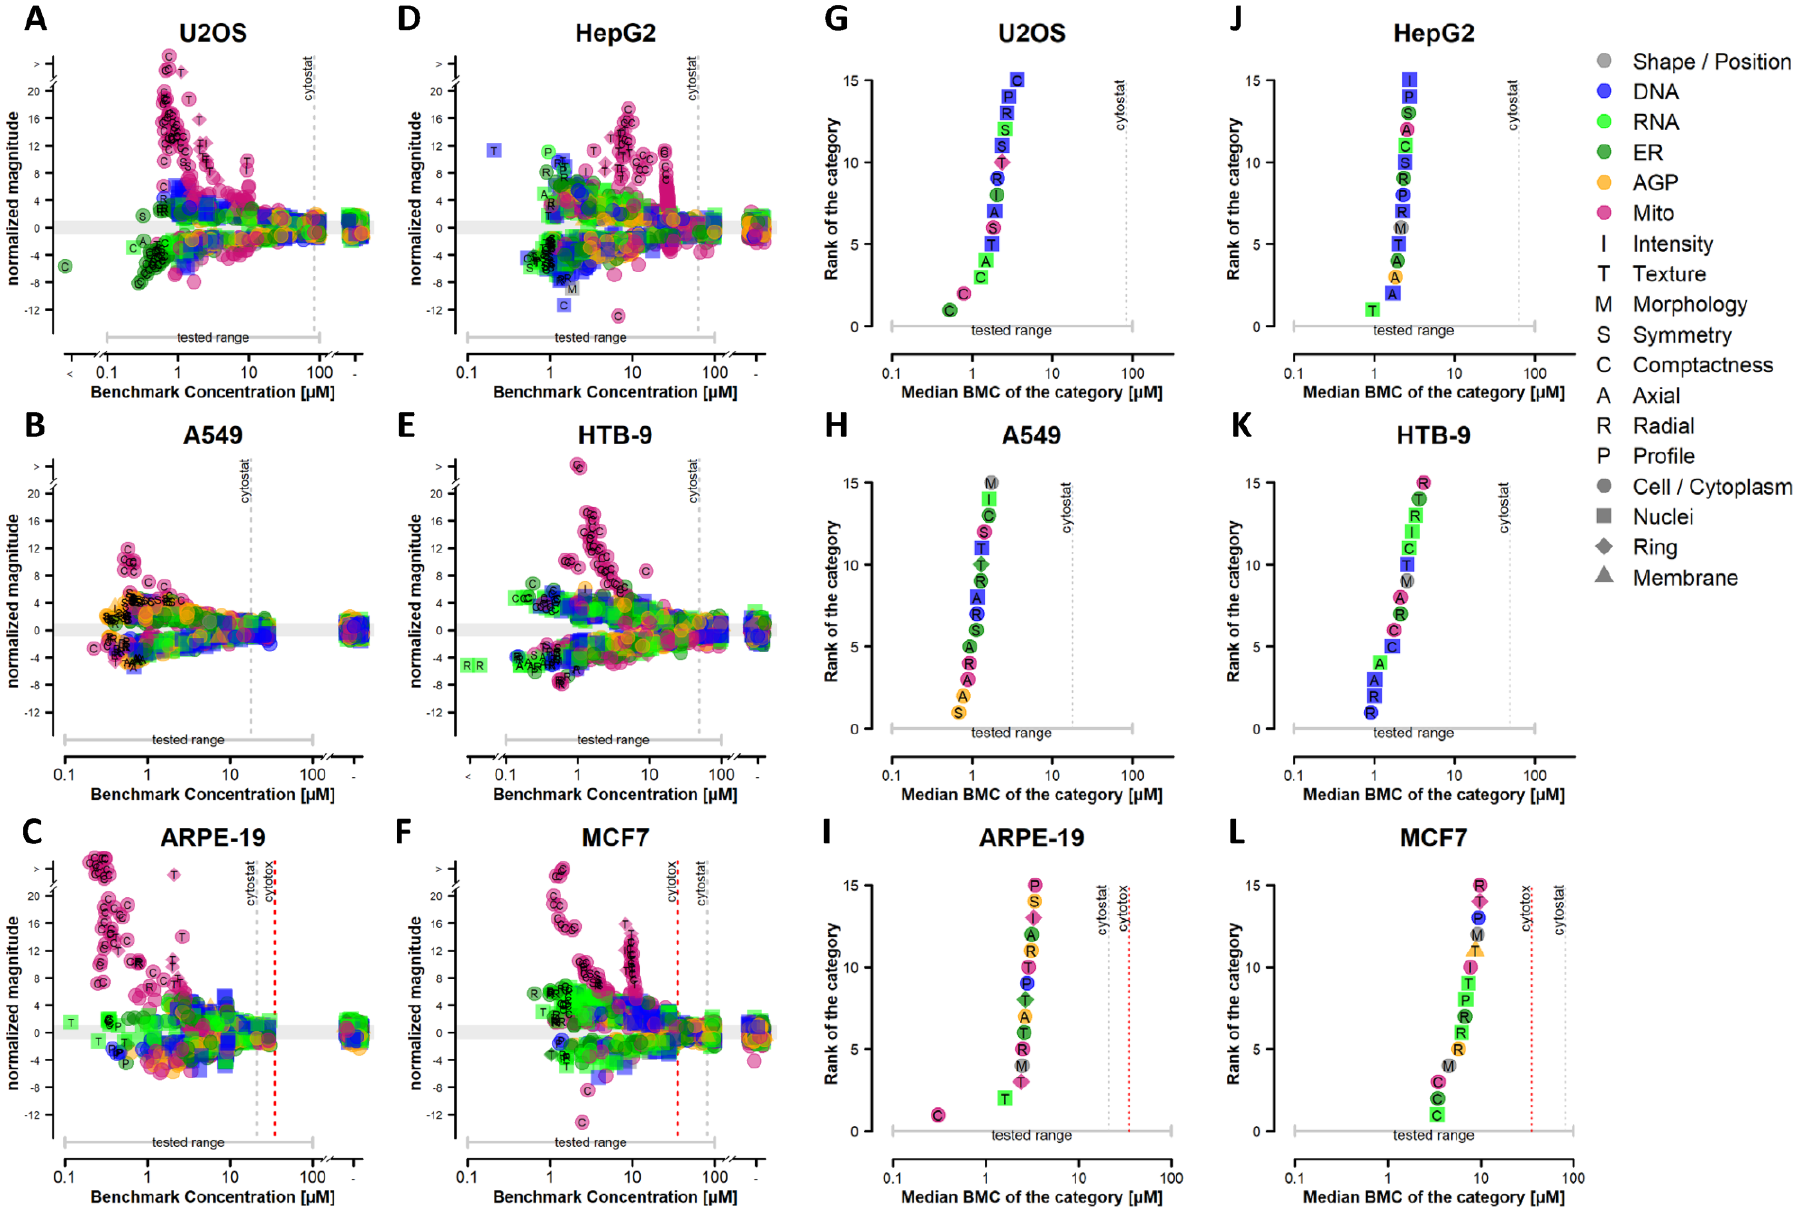
Comparison of potency–magnitude plots for the exemplar chemical berberine chloride demonstrated that phenotypic features associated with mitochondrial texture, compactness, and intensity were associated with the largest response magnitudes in each cell line ( Fig. 3A–3F ). This is consistent with the qualitative observations in Figure 2 . Of note, the most sensitive features and the most sensitive phenotypic category (i.e., those having the highest potency) for berberine chloride were not always associated with changes in mitochondrial morphology throughout the cell line panel. For instance, in each cell type, individual features associated with DNA, ER/RNA, or AGP morphology were affected at lower concentrations than features associated with mitochondrial morphology ( Fig. 3A–3F ), albeit with much lower response magnitudes. Furthermore, the most sensitive category (i.e., lowest median BMC) corresponded to a different channel/compartment/feature type for each cell type. For ARPE-19 cells, the most sensitive phenotypic category was mitochondrial compactness, and the potency value for this category was left-shifted compared with the next most sensitive categories ( Fig. 3I ). For other cell lines, the potency of the first mitochondria-associated category was within one half-log unit of the most sensitive phenotypic category. Additional comparisons of phenotypic effects among cell lines based on a review of concentration–response modeling results can be found in Supplementary Figure 2 .
To more easily identify patterns of phenotypic effects in the profiling data across the large variety of cell types and chemicals tested, a heatmap was constructed that illustrated normalized effect magnitudes of the highest non-cytotoxic test concentration for each chemical by cell type combination ( Fig. 4A ). If a chemical did not produce cytotoxicity, the highest tested concentration was retained. In addition, an analysis using a modification of the TCCS 11 was performed to quantify and compare the robustness and similarity of phenotypic response profiles among chemicals and cell types. Results are presented as a series of radial plots ( Fig. 4B ). Points relatively further from the origin indicate relatively more robust phenotypic effects, and points positioned along similar angular degrees are indicative of similarity in response profiles.
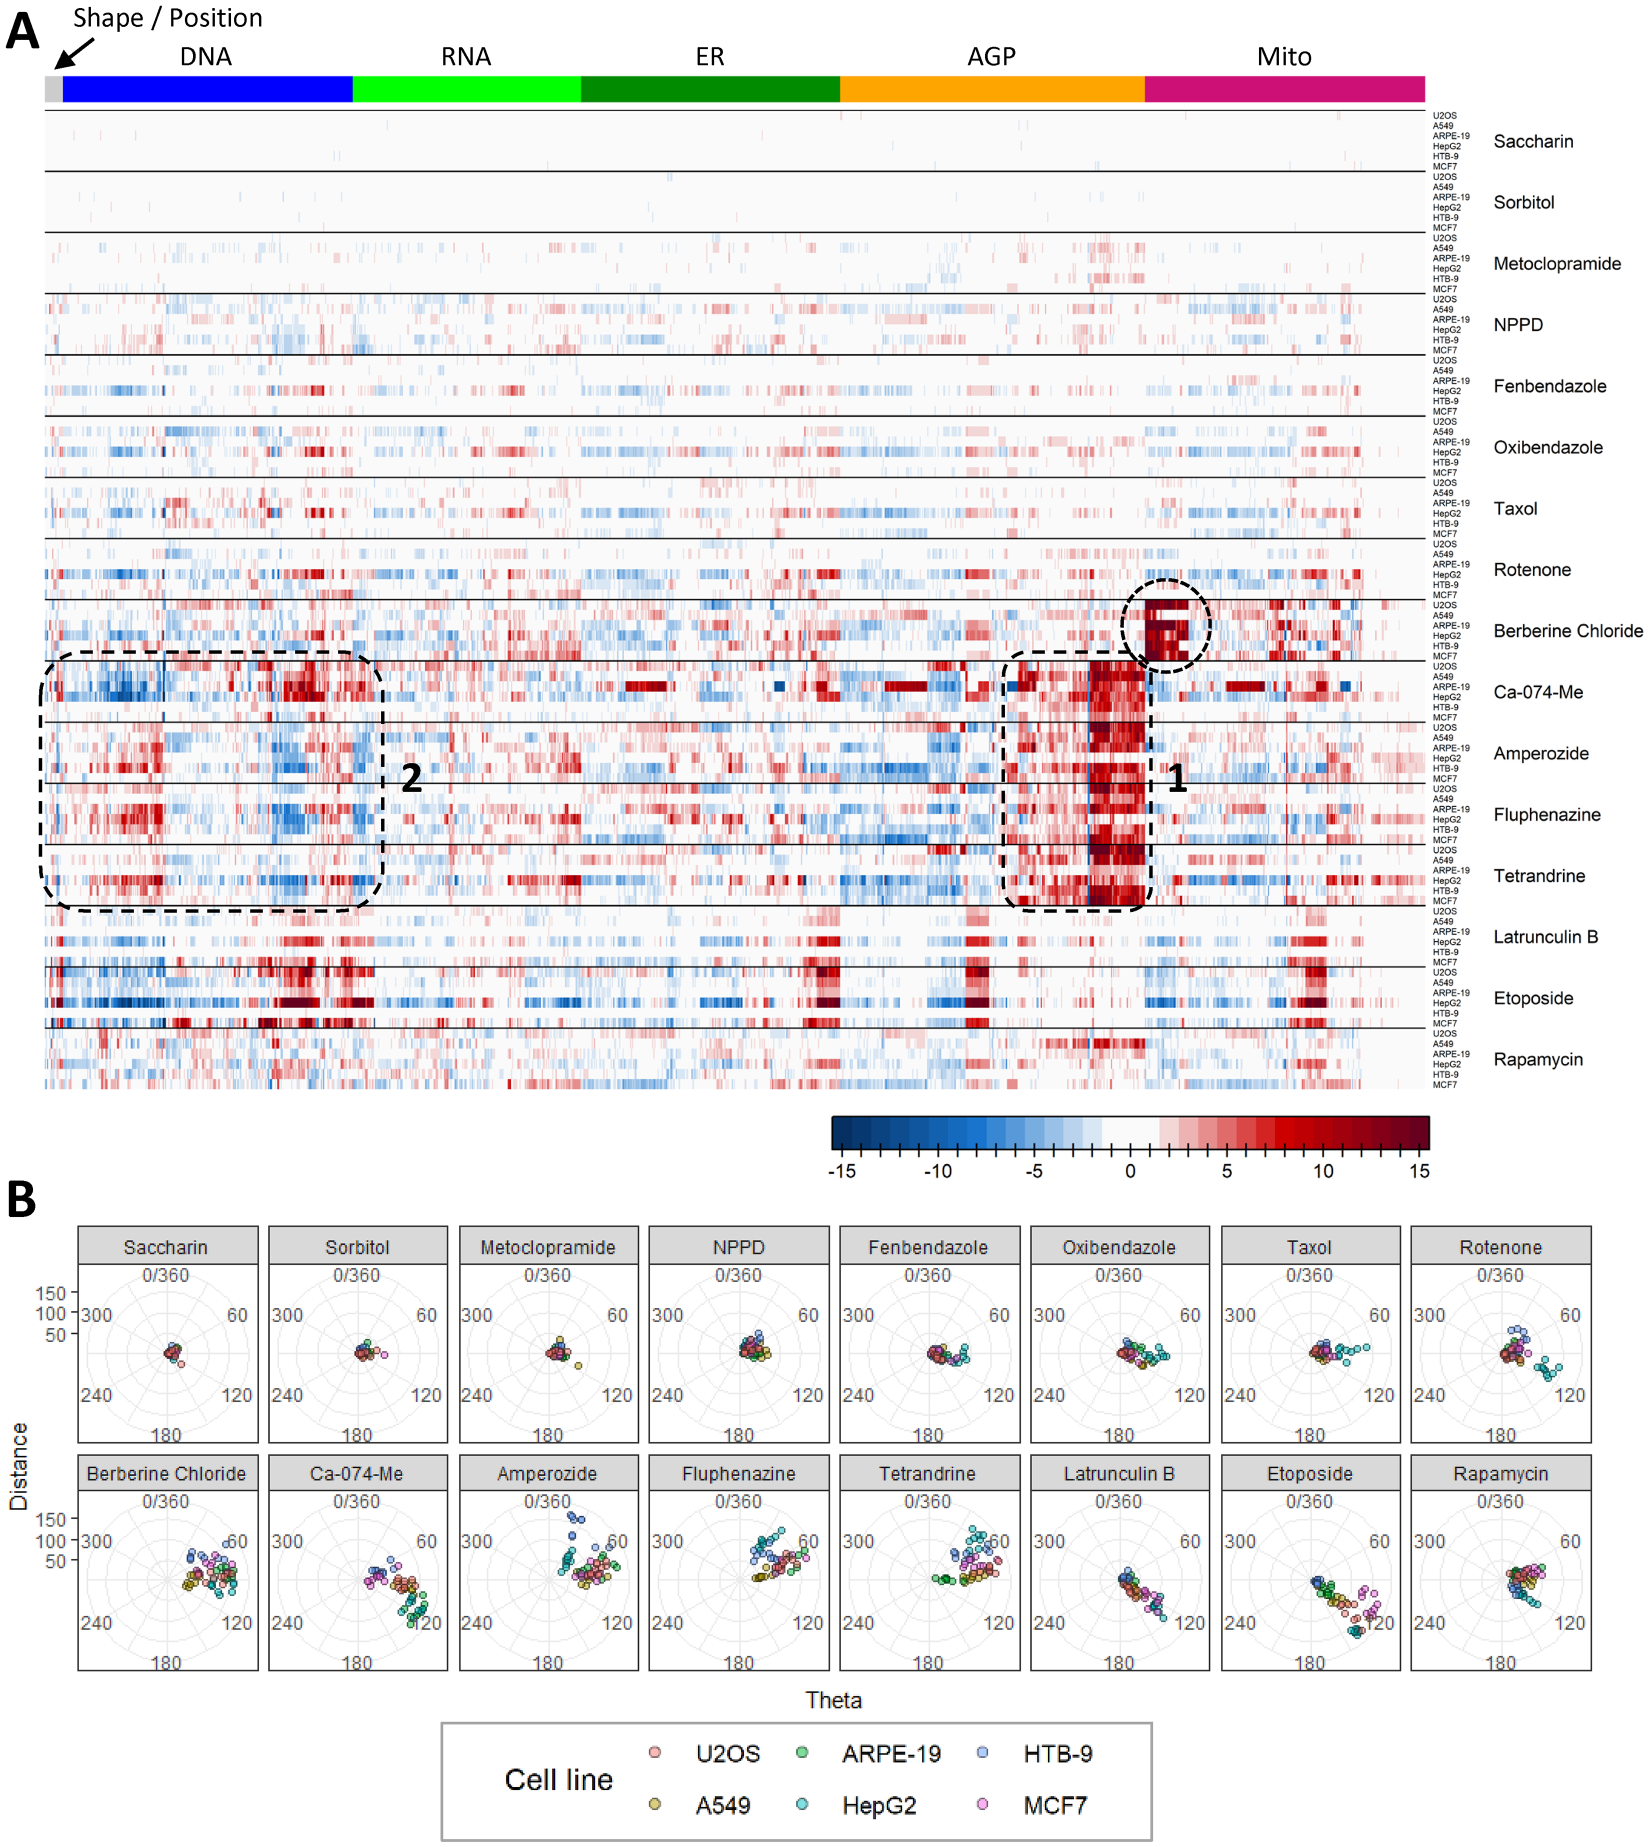
The highest tested concentrations of saccharin, sorbitol, and metoclopramide affected none or very few of the phenotypic features throughout the different cell types ( Fig. 4A ). Therefore, points on the TCCS plots are tightly packed around the origin ( Fig. 4B ). NPPD affected a variety of different phenotypic features throughout different cell types, albeit with low magnitudes of effect ( Fig. 4A ). Points on the TCCS plot are slightly more spread from the origin as compared to the three aforementioned chemicals; however, no discernable similarity in response profiles among cell types is apparent for NPPD ( Fig. 4B ). Fenbendazole, oxibendazole, Taxol, and rotenone affected a variety of different phenotypic features among different cell types, albeit with low magnitudes of effect ( Fig. 4A ). Of note, for each of these chemicals, many more features were affected in HepG2 cells as compared to the other cell types tested. This observation is manifest in the TCCS plots, because points corresponding to HepG2 samples are shifted away from the origin (along a similar angular degree) as compared to points associated with the other cell types ( Fig. 4B ). Rotenone also produced a response in HTB-9 cells that was dissimilar to that observed in HepG2 cells.
As shown in Figure 2 and Figure 3 , berberine chloride produced changes in mitochondrial morphology in each cell type. Those effects were clearly visible and consistent in the heatmap ( Fig. 4A , circle) with the exception of A549 cells, in which a smaller number of affected mitochondrial features was observed in comparison to other cell types. In the TCCS plot, all points were shifted away from the origin, with A549 cells located closest to the origin.
The test chemicals Ca-074-Me, amperozide, fluphenazine, and tetrandrine produced pronounced changes in AGP labeling ( Fig. 4A , rounded box 1) and produced a variety of effects in other channels and feature types, the identity of which varied among cell types. In general, the pattern of changes in many features within the DNA channel is in opposite directions when comparing Ca-074-Me and amperozide, fluphenazine, or tetrandrine, respectively ( Fig. 4A , rounded box 2). The differential characteristics of the phenotypic responses of these chemicals are apparent during comparison of individual TCCS plots ( Fig. 4B ). Cells treated with Ca-074-Me tend to be off-shifted from center in the lower-right direction, while cells treated with amperozide, fluphenazine, or tetrandrine tend be off-shifted from center in the upper-right direction. The similar angular degree among amperozide, fluphenazine, and tetrandrine is indicative of quantitative similarity in phenotypic profiles among cell types, with tetrandrine covering the narrowest range of angular degrees among these three chemicals.
Latrunculin B produced effects in a subset of ER, AGP, and mitochondrial features that are consistent in terms of identity and directionality throughout the U-2 OS, A549, HepG2, and MCF7 cell lines ( Fig. 4A ). Many additional features were affected in HepG2 and MCF7 cells, but not the other two cell types. Samples associated with all four cell types were markedly off-shifted from center along a narrow range of angular degrees in TCCS analysis ( Fig. 4B ), indicating some quantitative similarity in the responses of these cell types. Responses to latrunculin B in the remaining two cell types (ARPE-19 and HTB-9) were not robust. Etoposide also produced effects in a subset of features from each channel except RNA that are consistent in terms of identity and directionality among all cell lines except HTB-9 ( Fig. 4A ). Samples associated with all cell types except HTB-9 were markedly off-shifted from the origin along a narrow range of angular degrees in TCCS analysis, indicating some quantitative similarity in the responses of these cell types. Lastly, rapamycin affected a variety of different phenotypic features throughout the various cell types with little consistency in identity, magnitude, or direction of effects ( Fig. 4A ). No discernable similarity in response profiles among cell types is apparent for rapamycin using these approaches ( Fig. 4B ).
In summary, some degree of quantitative similarity in phenotypic response profiles among biologically diverse cell types was observed with berberine chloride, Ca-074-Me, amperozide, fluphenazine, tetrandrine, latrunculin B, and etoposide. In some instances, chemicals that produce robust responses in a particular cell type did not produce robust responses in others. This underscores the need to identify and rigorously characterize putative reference chemicals prior to use as plate-based controls for the Cell Painting assay in novel cell types.
Comparison of Potencies for Chemical Bioactivity among Cell Lines
In addition to evaluating the similarity and dissimilarity of chemical-induced phenotypic profiles among cell types, we also compared potencies for chemical bioactivity using concentration–response modeling. The PODs corresponding to the Cell Painting assay (i.e., the CP POD), cytotoxicity BMC, and cytostatic BMC EC50 were plotted for comparison of each chemical treatment and cell type ( Fig. 5 ). Concentration–response curves for normalized cell count (nCC), cell viability, and apoptosis for each chemical by cell type combination are shown in Supplementary Figure 3 . No response in cell viability, cytostatic (i.e., nCC), or Cell Painting assays was observed for sorbitol in any cell type. No response in cell viability or cytostatic assays was observed for saccharin. Saccharin was active in the Cell Painting assay in ARPE-19 cells only, and this finding was associated with effects in a single phenotypic category ( Fig. S2B ).
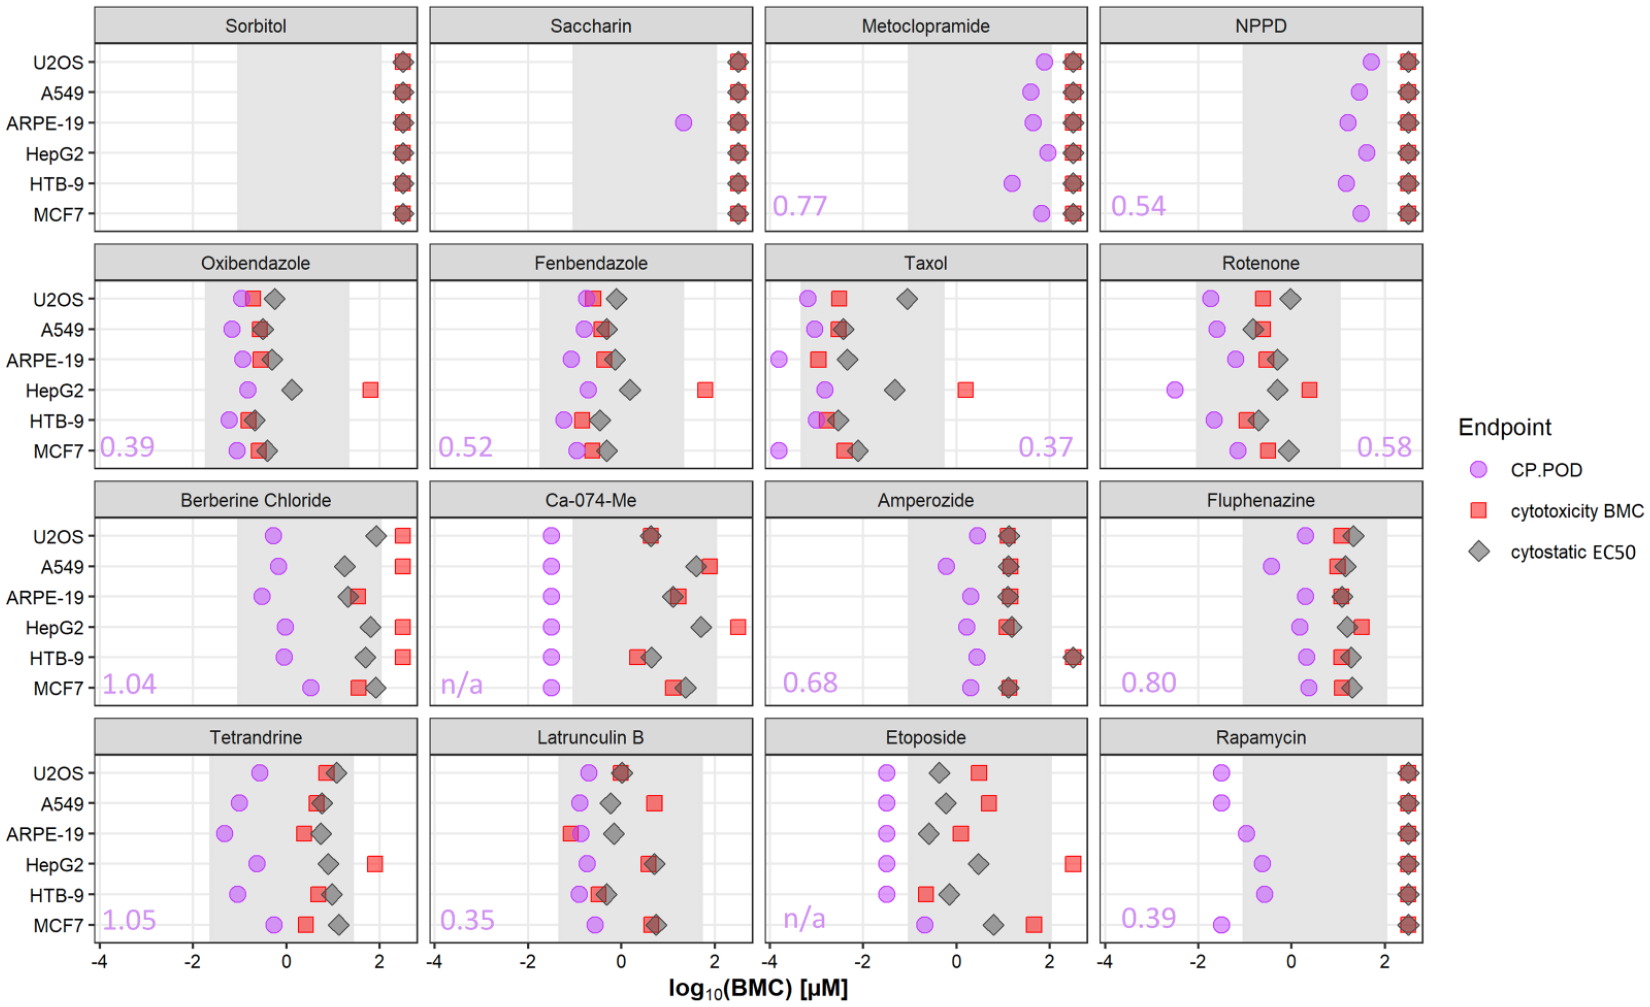
All 14 reference chemicals were active in the Cell Painting assay in each of the cell lines tested, often at concentrations markedly lower than the threshold for cytotoxicity or cytostatic effects. Chemicals with the largest difference between the threshold for bioactivity as determined by the Cell Painting assay and thresholds for cytotoxicity or cytostatic effects were Ca-074-Me, berberine chloride, and rapamycin. Of note, accurate CP PODs for Taxol in ARPE-19 and MCF7 cells, rotenone in HepG2 cells, Ca-074-Me in all cell types, etoposide in all cell types except MCF7, and rapamycin in U-2 OS, A549, and MCF7 cells could not be determined. This was due to changes in cellular phenotypes occurring at the lowest concentration tested in each of these instances. These instances are illustrated in Figure 5 as purple points to the left of the gray-shaded regions that represent the concentration range tested for each chemical.
For the remaining instances when a CP POD could be reliably determined within the tested concentration range, the difference in CP PODs among the cell lines varied by less than approximately one order of magnitude (i.e., log10 unit). The largest ranges of CP PODs among cell types was observed with tetrandrine and berberine chloride (1.04 and 1.05 log10 units, respectively). The smallest ranges of CP PODs among cell types was observed with latrunculin B and taxol (0.35 and 0.37 log10 units, respectively). This consistency in CP PODs was apparent despite the observation that the most sensitive phenotypic features or phenotypic categories varied throughout cell types for any given chemical (except Ca-074-Me, in which effects in the AGP channel were always the most sensitive) ( Fig. S2 ). Overall, these data indicate that for the chemical set tested in the present study, bioactivity estimates (i.e., potency) are generally consistent among cell lines even when dissimilarity in phenotypic profiles is observed. It is unclear if this observation is applicable to other or larger chemical sets.
Discussion
The Cell Painting assay can be used as a nontargeted high-throughput profiling assay for characterizing the biological activity of environmental chemicals. 1 Questions remain, however, regarding the general compatibility and portability of the Cell Painting assay throughout different human-derived cell types and what optimization steps may be required for deploying the assay in a novel cell model. To investigate this topic, we established Cell Painting sample preparation, image acquisition, feature extraction, and data analysis workflows (described in Nyffeler et al. 14 ) and applied these workflows to concentration–response screening of 14 phenotypic reference chemicals (and two negative control chemicals) across six human-derived cell types (U-2 OS, A549, ARPE-19, HepG2, HTB-9, and MCF7). A uniform cytochemistry protocol with no cell type–specific optimization steps was used to prepare samples of each cell type for high-content imaging. In contrast, we found it necessary to optimize parameters associated with image acquisition (i.e., z-offset, laser power, and exposure duration), as well as those associated with nucleus and cell segmentation on a per cell type basis. A second objective of this study was to compare phenotypic profiles and potency estimates for perturbation of cellular biology among the biologically diverse cell lines to inform strategies for selection of reference chemicals (i.e., assay controls) for HTS. For several of the chemicals tested, similar subsets of phenotypic features corresponding to a particular organelle were associated with the highest-effect magnitudes in each affected cell type. For other chemicals, more pronounced effects were observed in one particular cell type in comparison to other cell types in the panel. Lastly, potencies for biological activity of the tested chemicals were comparable (i.e., less than or approximating one log10 unit of potency) among cell types, even though the identity of the most sensitive phenotypic feature categories or most highly affected phenotypic features tended to vary among cell types. Variations in the response of different cell types to chemicals underscore the need to identify and rigorously characterize reference chemicals for the Cell Painting assay on a per cell type basis, because active chemicals do not always produce similar phenotypes in different cellular contexts.
The U-2 OS cell line was included in the present study given that this was the cell type used for initial development of Cell Painting and is widely considered the gold standard for this assay.3,10,14,16,17 Three of the other cell lines included in the present study (MCF7, HTB-9, and A549) were used in the qualitative comparison of fluorophore labeling patterns presented in the initial Cell Painting publication. 10 The remaining two cell lines (HepG2 and ARPE-19) were selected based on previous use at the EPA in various toxicological research areas.18,19 Overall, this panel of cell lines is derived from a diverse set of human tissues, has diverse baseline gene expression patterns,20,21 and is morphologically heterogeneous with regard to cellular size, nucleus-to-cytoplasm ratios, and tightly packed versus dispersed growth patterns when cultured in 2D monolayers. Despite this morphological heterogeneity, the uniform cytochemistry protocol used in the present study labeled organelles of interest within each cell line with patterns characteristic of what is observed in U-2 OS cells. This was to be expected given that the fluorescent probes used in the Cell Painting assay bind to molecular target sites that are present in most (if not all) human-derived cell types. The characteristic patterns we observed did not indicate to us a need to optimize the cytochemistry protocol for each individual cell type before proceeding to development of image acquisition and analysis workflows. It should not be concluded, however, that deployment of the Cell Painting assay to novel human-derived cell types will never require optimization of cytochemistry protocols. For example, Warchal et al. 11 noted a sensitivity of the MDA-MB-231 cell line to live cell staining with MitoTracker in the context of the Cell Painting assay. On addition of the live cell label, MDA-MB-231 cells assumed a rounded appearance (N. Carragher, personal communication) that may have been indicative of an adverse effect on the overall health of these cells. This finding prompted the authors to change the sequential addition of “live-cell” (i.e., MitoTracker) and “fixed-cell” (i.e., all other probes) reagents recommended in previous studies3,10 to a single addition after cells had been fixed with PFA. This eliminated the artefactual effect observed in MDA-MB-231 cells. Of note (and similar to the present study), a uniform cytochemistry protocol was applied to all eight breast cancer cell types, not just the one in which the adverse response to the live cell labeling reagent was observed. These observations support the need to critically evaluate novel cell lines for compatibility with Cell Painting sample preparation protocols before proceeding to downstream studies and adjust when necessary to maintain consistency within a study. In the case of the present study, further optimization of cytochemistry protocols beyond those described previously 14 was unnecessary, and portability of the sample preparation procedures throughout cell types was straightforward.
In the present study, we did find it necessary to optimize image acquisition parameters on a per cell type basis to account for differences in the size and three-dimensional (3D) shape of the respective cell types when cultured in monolayers. The present study uses single Z-plane confocal microscopy with lasers as light sources and a 16-bit, large-format scientific complementary metal–oxide–semiconductor (sCMOS) camera for image acquisition. During optimization, the focal height, laser power, and integration time for image acquisition were adjusted for each channel for each cell line based on inspection of randomly selected treatment wells and vehicle control wells. The goal in each case was to identify a focal plane in which the organelle(s) of interest were in sharp focus while keeping the maximal pixel intensities of the image within the lower quarter of the dynamic range of the 16-bit camera. Even in monolayer, different objects (i.e., organelles) of interest within a cell can be present at different heights in relation to the apical or basal surface of the cell,22,23 thereby necessitating different focal heights for obtaining the sharpest images when using single-plane confocal imaging. In the context of the Cell Painting assay, multiplexed labeling of ER with Alexa Fluor 488–conjugated concanavalin A and of nucleoli with SYTO-14 provide good examples of this phenomenon. Even though these stains are multiplexed within the same fluorescent channel in the Cell Painting assay, the optimal setting for imaging of nucleoli was consistently identified at a higher focal plane (relative to the default reference point determined by the Opera Phenix High Content Screening System using CellCarrier-384 Ultra microplates) as compared to the ER or any other organelle ( Supplementary Table 1 ). This necessitated use of two acquisitions with the 488 nm laser at different focal heights to obtain sharp images of the ER and nucleoli, respectively. Similarly, in most cell lines (except HepG2), the optimal setting for imaging of mitochondria was at a lower focal plane compared to that for any other organelle. The use of maximum projections from 3D confocal microscopy would eliminate the need for identifying an optimal focal height for imaging each channel, assuming an appropriate Z-range has been determined that spans the thickness of the cell of interest. This approach is more computationally intensive, however, and it would increase the overall duration of image acquisition but not eliminate the need to optimize laser power and image acquisition times for different fluorescent channels and different cell types. The focal offsets and image acquisition settings in Supplementary Table 1 are particular to the high-content screening system and the cell culture vessels that were used in the present study, and would need to be adjusted for other imaging platforms and/or plate types. Our conclusion was that the Cell Painting sample preparation protocol could be deployed throughout the cell types used in the present study with ease (i.e., without modification), while the image acquisition phase of experimentation required detailed, cell type–specific adjustments prior to screening chemicals.
Comparison of chemical-induced phenotypic profiles demonstrated that some chemicals can produce qualitatively similar effects in biologically diverse cell types. Similarities in response profiles were evaluated in several different ways, including representative images (
Fig. 2
), feature-level potency–magnitude plots of concentration–response modeling results (
There were also instances when chemicals produced a pronounced phenotypic effect in one cell line that was not recapitulated in other cell lines. This was most notable with the HepG2 cell model on treatment with a variety of chemicals whose typical uses are associated with biocidal activity.28–30 Fenbendazole, oxibendazole, and Taxol (i.e., paclitaxel) all bind β-tubulin and affect microtubule stability (albeit in different ways) to produce cytotoxicity in rapidly dividing cells.31,32 Rotenone is a mitochondrial toxicant with common use as a piscicide. 33 The identity and directionality of features affected in HepG2 cells by these chemicals are markedly similar, as evidenced by visual comparison of heatmap results ( Fig. 4A ) and the similar angular degree of HepG2 samples in TCCS analysis ( Fig. 4B ). Features in the DNA channel had the largest magnitude of effects in HepG2 cells for each of these chemicals ( Suppl. Fig. 2I–2L ). In addition, for each of these chemicals, the differences in potency between Cell Painting effects and the cytotoxicity and cytostatic effects were greater in HepG2 cells than in any other cell type, although CP PODs did not vary by a great extent among cell types. Comparison of the cytotoxicity BMC, cytostatic EC50 and CP PODs is indicative of a more gradual transition toward cytotoxicity in HepG2 cells as compared to other cell types for this group of chemicals. The reason for differing sensitivity of HepG2 cells as compared to other cell types is unknown, but it may be due to differences in basal metabolism, replication rate, expression of pharmacological targets, chemical transport, metabolism, or overall robustness across the cell line panel.
Another finding of this study is that for most chemicals, the threshold potency for phenotypic effects as determined by the Cell Painting assay did not vary by a substantial amount among cell lines. This was despite the fact that for any particular chemical (except Ca-074-Me), different phenotypic features or phenotypic categories were identified as the most sensitive throughout cell types. One interpretation of this finding is that even though the concentration at which chemicals begin to perturb cellular biology is consistent, the manner in which these effects initially manifest depends on the biological context of the cells. Of note, in many instances, the CP POD for phenotypic effects occurred at concentrations of test chemicals that did not affect cell counts, indicating that the most sensitive changes in phenotype were not associated with changes in cell density (
The results of the present study inform strategy for selection of reference chemicals in situations that involve the use of the Cell Painting assay throughout multiple cell types and when harmonization of reference chemicals among cell types is desired. In HTS, assay performance is assessed by the use of positive controls and/or reference chemicals that produce a predictable and reproducible response in the endpoint(s) of interest. 34 Confirmation that a culture or an assay plate responds to the reference chemical as predicted is indicative that the assay was conducted properly and increases confidence that data from test substances are of acceptable quality. As compared to traditional HTS assays, positive controls and reference chemicals are more difficult to identify for high-throughput profiling assays due to the multiplexed nature of the assay readout. 35 Previously, we used a set of four chemicals (i.e., berberine chloride, Ca-074-Me, etoposide, and rapamycin) as reference chemicals for the Cell Painting assay in the U-2 OS model. 14 These chemicals produced robust profiles of phenotypic effects that were dissimilar across the chemical set (spanning nearly every category measured in the Cell Painting assay) but highly reproducible for each chemical among the many assay plates used in the study. The reproducibility was observed in terms of the phenotypic signature these chemicals produced as well as the potency for which phenotypic effects occurred. These chemicals were evaluated and selected for use as reference chemicals specifically in the context of the U-2 OS cell model. Extensibility to other cell types was not evaluated at the time. Data from the present study indicate that it is possible to identify reference chemicals that produce similar (but not identical) phenotypes among multiple biologically diverse cell types and are complementary to one another in terms of producing robust effects in different fluorescent channels and organelles. The most robust phenotypic effects of three of the reference chemicals from Nyffeler et al. 14 (i.e., berberine chloride, Ca-074-Me, and etoposide) are consistent throughout the cell line panel, the lone exception being etoposide in HTB-9 cells. Using a “channel-centric“ approach, one could identify several chemicals, each of which produces robust effects in a different fluorescent channel or organelle throughout a collection of cell lines and use them in a complementary manner to track assay performance while providing coverage of the many features measured as part of the Cell Painting assay.
In summary, we conclude that the Cell Painting assay is capable of being deployed to novel human-derived cell types grown in monolayer in a straightforward manner, with minimal (or no) adjustment to sample preparation protocols. Cell type–specific optimization of image acquisition and feature extraction parameters is required. The degree of qualitative and quantitative similarity in phenotypic response profiles among biologically diverse cell types will vary from chemical to chemical, with some chemicals producing the most robust effects in the same organelle or fluorescent channel regardless of biological context.
Supplemental Material
SLASDiscovery_6CellLine_v12_SuppFigs – Supplemental material for Phenotypic Profiling of Reference Chemicals across Biologically Diverse Cell Types Using the Cell Painting Assay
Supplemental material, SLASDiscovery_6CellLine_v12_SuppFigs for Phenotypic Profiling of Reference Chemicals across Biologically Diverse Cell Types Using the Cell Painting Assay by Clinton Willis, Johanna Nyffeler and Joshua Harrill in SLAS Discovery
Footnotes
Acknowledgements
The author would like to thank Terri Fairley, Dan Hallinger, and Sandra Roberts for operations support activities during conduct of this research. The authors would also like to thank Drs. Keith Houck, Timothy Shafer, Brian Chorley, and Maureen Gwinn for their insightful comments during review of this manuscript.
Supplemental material is available online with this article.
Declaration of Conflicting Interests
The authors declared the following potential conflicts of interest with respect to the research, authorship, and/or publication of this article: The authors declare no conflict of interest regarding this manuscript. The U.S. Environmental Protection Agency has provided administrative review and has approved this manuscript for publication. The views expressed in this manuscript are those of the authors and do not necessarily reflect the view or policies of the U.S. Environmental Protection Agency. Reference to commercial products or services does not constitute endorsement.
Funding
The authors disclosed receipt of the following financial support for the research, authorship, and/or publication of this article: The U.S. Environmental Protection Agency through its Office of Research and Development provided funding for this research.
References
Supplementary Material
Please find the following supplemental material available below.
For Open Access articles published under a Creative Commons License, all supplemental material carries the same license as the article it is associated with.
For non-Open Access articles published, all supplemental material carries a non-exclusive license, and permission requests for re-use of supplemental material or any part of supplemental material shall be sent directly to the copyright owner as specified in the copyright notice associated with the article.