
Abstract
A large percentage of drugs fail in clinical studies due to cardiac toxicity; thus, development of sensitive in vitro assays that can evaluate potential adverse effects on cardiomyocytes is extremely important for drug development. Human cardiomyocytes derived from stem cell sources offer more clinically relevant cell-based models than those presently available. Human-induced pluripotent stem cell–derived cardiomyocytes are especially attractive because they express ion channels and demonstrate spontaneous mechanical and electrical activity similar to adult cardiomyocytes. Here we demonstrate techniques for measuring the impact of pharmacologic compounds on the beating rate of cardiomyocytes with ImageXpress Micro and FLIPR Tetra systems. The assays employ calcium-sensitive dyes to monitor changes in Ca2+ fluxes synchronous with cell beating, which allows monitoring of the beat rate, amplitude, and other parameters. We demonstrate here that the system is able to detect concentration-dependent atypical patterns caused by hERG inhibitors and other ion channel blockers. We also show that both positive and negative chronotropic effects on cardiac rate can be observed and IC50 values determined. This methodology is well suited for safety testing and can be used to estimate efficacy and dosing of drug candidates prior to clinical studies.
Keywords
Introduction
A primary cause of compound attrition in preclinical drug development is cardiotoxicity. 1 Early detection of cardiovascular side effects is critical to avoid late-stage preclinical termination, adverse cardiac-related events during clinical trials, or recall of a drug from the market. Therefore, development of sensitive in vitro assays suitable for safety and efficacy testing is extremely important for drug development. Currently, electrophysiology-based assays for interactions of compounds with hERG channels are the most widely used in vitro methods to assess potential adverse cardiac affects. These assays use patch clamp methodology and immortalized mammalian cell lines overexpressing hERG channels (ICH; S7B). Although these assays are predictive of ion channel block, they are typically low to medium throughput and are not suitable for assessing potential adverse interactions with biochemical or contractile processes, which are important to maintain proper cardiac function.
Human cardiomyocytes overcome the limitations of immortalized cell lines overexpressing single, or relatively few, proteins of interest. Human-induced pluripotent stem cell (iPSC)–derived cardiomyocytes are especially attractive as they recapitulate the expected genomic, biochemical, mechanical, and electrophysiological behaviors of human cardiomyocytes.2–5 Furthermore, human iPSC-derived cardiomyocytes are derived from a single, infinitely expandable iPSC source and can be reproducibly differentiated in large quantities at high purity and cryopreserved until use, thus making them especially useful for large-scale and longitudinal investigations. 6
As human iPSC-derived cardiomyocytes express full cardiomyocyte functionality, the need has arisen for more robust and higher-throughput assay platforms able to assess multiple endpoints during preclinical drug development and safety testing. To this end, we have developed automated cell-based assays for measuring the impact of pharmacologic compounds on cardiomyocyte beat rate, mechanical activity, and intracellular calcium handling. One method employs high-content imaging with automated, high-resolution image acquisition of fluorescently stained live cardiomyocytes to capture the dual endpoints of beat rate and mechanical movement while leaving the preparation in a relatively undisturbed state. A second method uses fast kinetic fluorescence imaging to monitor intracellular Ca2+ levels and simultaneously provide a direct assessment of Ca2+ handling with surrogate assessments of beat rate and sarcolemmal electrophysiological activity. The FLIPR Tetra system (Molecular Devices, Sunnyvale, CA) with whole-plate imaging allows this measurement to be accomplished in less than 2 min. When coupled with automated compound addition, the system is well suited for generating data in a quantitative high-throughput screening (HTS) mode. Both methods enable interrogation in 96- or 384-well formats with well-by-well or whole-plate analyses, video archiving of data, automated data analysis, and generation of concentration-response relations.
We have demonstrated how these newly developed assays can be applied in both safety testing and drug discovery applications. As mentioned previously, ion channel block can lead to drug-induced arrhythmias and must be assessed during preclinical development. Concentration-dependent changes in beating pattern were generated by application of a number of proarrhythmic cardiotoxic compounds known to block hERG channels as well as compounds affecting Na+ and Ca2+ channels. Positive and negative inotropes are used in clinics to treat heart failure, tachycardia, arrhythmia, and other cardiac diseases. Therefore, the beat rate provides the basis for phenotypic screens in drug discovery. Similar to its use in toxicity testing, the fluorescence-based applications described here detected concentration-dependent effects of several positive and negative inotropes and chronotropes on cardiac rates and determined EC50s at the expected ranges.
Development of new, more potent, and safer drugs requires an in vitro system in which functional outcomes can be quantitatively tested. The assays described here are ideal for that task and enable determination of efficacy and approximate dose ranges prior to clinical studies and hold the potential to accelerate the drug discovery process.
Methods
Human iPSC-Derived Cardiomyocytes and Cell Culture
The methods for reprogramming the source material into iPSCs and subsequent differentiation into human iPSC-derived cardiomyocytes (iCell Cardiomyocytes) have been described previously. 4 iCell Cardiomyocytes, plating medium, and maintenance medium were received frozen from Cellular Dynamics International. Cardiomyocytes were thawed and plated according to the User’s Guide. Briefly, cardiomyocytes were thawed and plated into gelatin-coated wells at 20K or 4K cardiomyocytes per well of 96 or 384 multiwell plates, respectively. Wells were overseeded with cardiomyocytes to account for the plating efficiency of the cardiomyocytes per the Certificate of Analysis. Cardiomyocytes were incubated in a humidified cell culture incubator and maintained at 37 °C in 5% CO2. Cell contractions were observed visually under a light microscope after ~3 days in culture. The presence of strong synchronous contractions of cells in the wells under the light microscope was confirmed prior to running experiments on the FLIPR Tetra system. With few exceptions, experiments were done after 5 to 7 days of cell culture.
High Content Imaging Data Acquisition and Analysis
For imaging of mechanical contractions, cells were incubated with Calcein AM (Invitrogen, Carlsbad, CA) for 10 min to provide a relatively homogenous cellular label and then treated with different concentrations of compounds. Image acquisition was performed on an environmentally controlled ImageXpress Micro system (Molecular Devices, Sunnyvale, CA) using time-lapse imaging with a 20× or 10× objective, FITC excitation and emission filter setup, and 40 images per field at up to 10 frames per second (fps). For imaging of calcium flux, acquisition was done on an environmentally controlled ImageXpress Micro XL system using time-lapse imaging with a 10× objective, FITC filter cube, and 500 images per field at up to 100 fps. Environmental control for both systems was 37 °C and 5% CO2.
For analysis of mechanical contractions, a time series of images was combined into a stack and then processed using a custom protocol, or journal. The journal consisted of opening the stack, subtracting each image from the previous one, and then thresholding the resulting differential image. The intensity values of pixels above the threshold were integrated, and the data were exported into a spreadsheet program (Microsoft Excel) as percentage of threshold (%Th) for each time point. A plot of %Th versus time provided a curve in which peaks in the %Th value corresponded to cell contractions or beats. The number of peaks was manually calculated and a beats per minute (beat/min) value determined.
FLIPR Tetra Data Acquisition
In the FLIPR Tetra instrument, the entire bottom of the plate is illuminated with excitation light and then fluorescence emission is imaged onto a fast CCD camera. The signal from individual wells is discerned by appropriate binning of pixels associated with each well, and the average intensity is recorded as a function of time. This allows kinetic measurements to be performed on a well-by-well basis with excellent signal to noise. Another feature of the system is on-board liquid handling for dispensing simultaneously into either 96- or 384-well plates. This allows dosing to be controlled very accurately from both a volume and timing perspective. Components of a FLIPR Calcium 5 Assay Kit (Molecular Devices, Sunnyvale, CA) were added to the plates according to standard protocol and incubated for 60 min in a cell culture incubator. Compound plates were prewarmed to 37 °C inside the FLIPR Tetra instrument, and compound addition was done simultaneously to all wells. Filter sets were appropriate for the FLIPR Calcium 5 assay kit (ex 485 nm, em 530 nm); data were acquired at 8 fps and up to 800 image frames. The stage of the instrument was kept at a constant temperature of 37 °C. Data were acquired before compound addition, during compound addition, and at prescribed times after compound addition. The total time for image acquisition and analysis was approximately 2 min per plate.
Peak Analysis
For automated microscopy measurements with an ImageXpress Micro system, beats were detected as peaks in the fluorescence intensity versus time plots, and beat frequency was determined from the ratio of the number of beats over the acquisition time (beats/min). For measurements using the FLIPR Tetra system, an automated algorithm in ScreenWorks Peak Pro software processes the data and provides the user-selectable outputs. In brief, the software detects the signal peaks within a data trace from a single well using a dynamic thresholding and derivative analysis. The peaks are then fit with a binomial function to calculate the peak amplitude, peak temporal position, peak count, and peak full width at half of maximum of amplitude (FWHM). The peak rise time (10% to 90% intensity), peak decay time (90% to 10% intensity), and peak width at 10% of the maximum intensity (peak width at 10% amplitude) are measured separately. The time points for these measurements are determined using a linear interpolation between the two closest data points. The beat frequency is determined by the inverse of the average temporal spacing between beats. Peaks located at the start or end of a trace that are less than half present are filtered by the algorithm and are not included in calculation of the results. The user can select as an output the average or standard deviation of those parameters on a well-by-well basis.
Results
Assessment of Mechanical Cell Movement Using Time-Lapse Imaging
A method was developed to allow analysis of cardiomyocyte contractions without using any indirect readouts. The mechanical movement of cells is captured through automated image analysis using a live cell stain that allows cell movement to be characterized without interference with cell metabolism. The beating rate of contracting cardiomyocytes was determined from a series of time-lapse images acquired on an ImageXpress Micro system followed by a derivate analysis. An outline of the analysis workflow is presented in Figure 1 . iPSC-derived cardiomyocytes were cultured in a monolayer in 96-well or 384-well plates for four days and then stained with Calcein AM for 10 min. Then media was replaced, cells were treated with compounds for 10 min, and images were acquired.
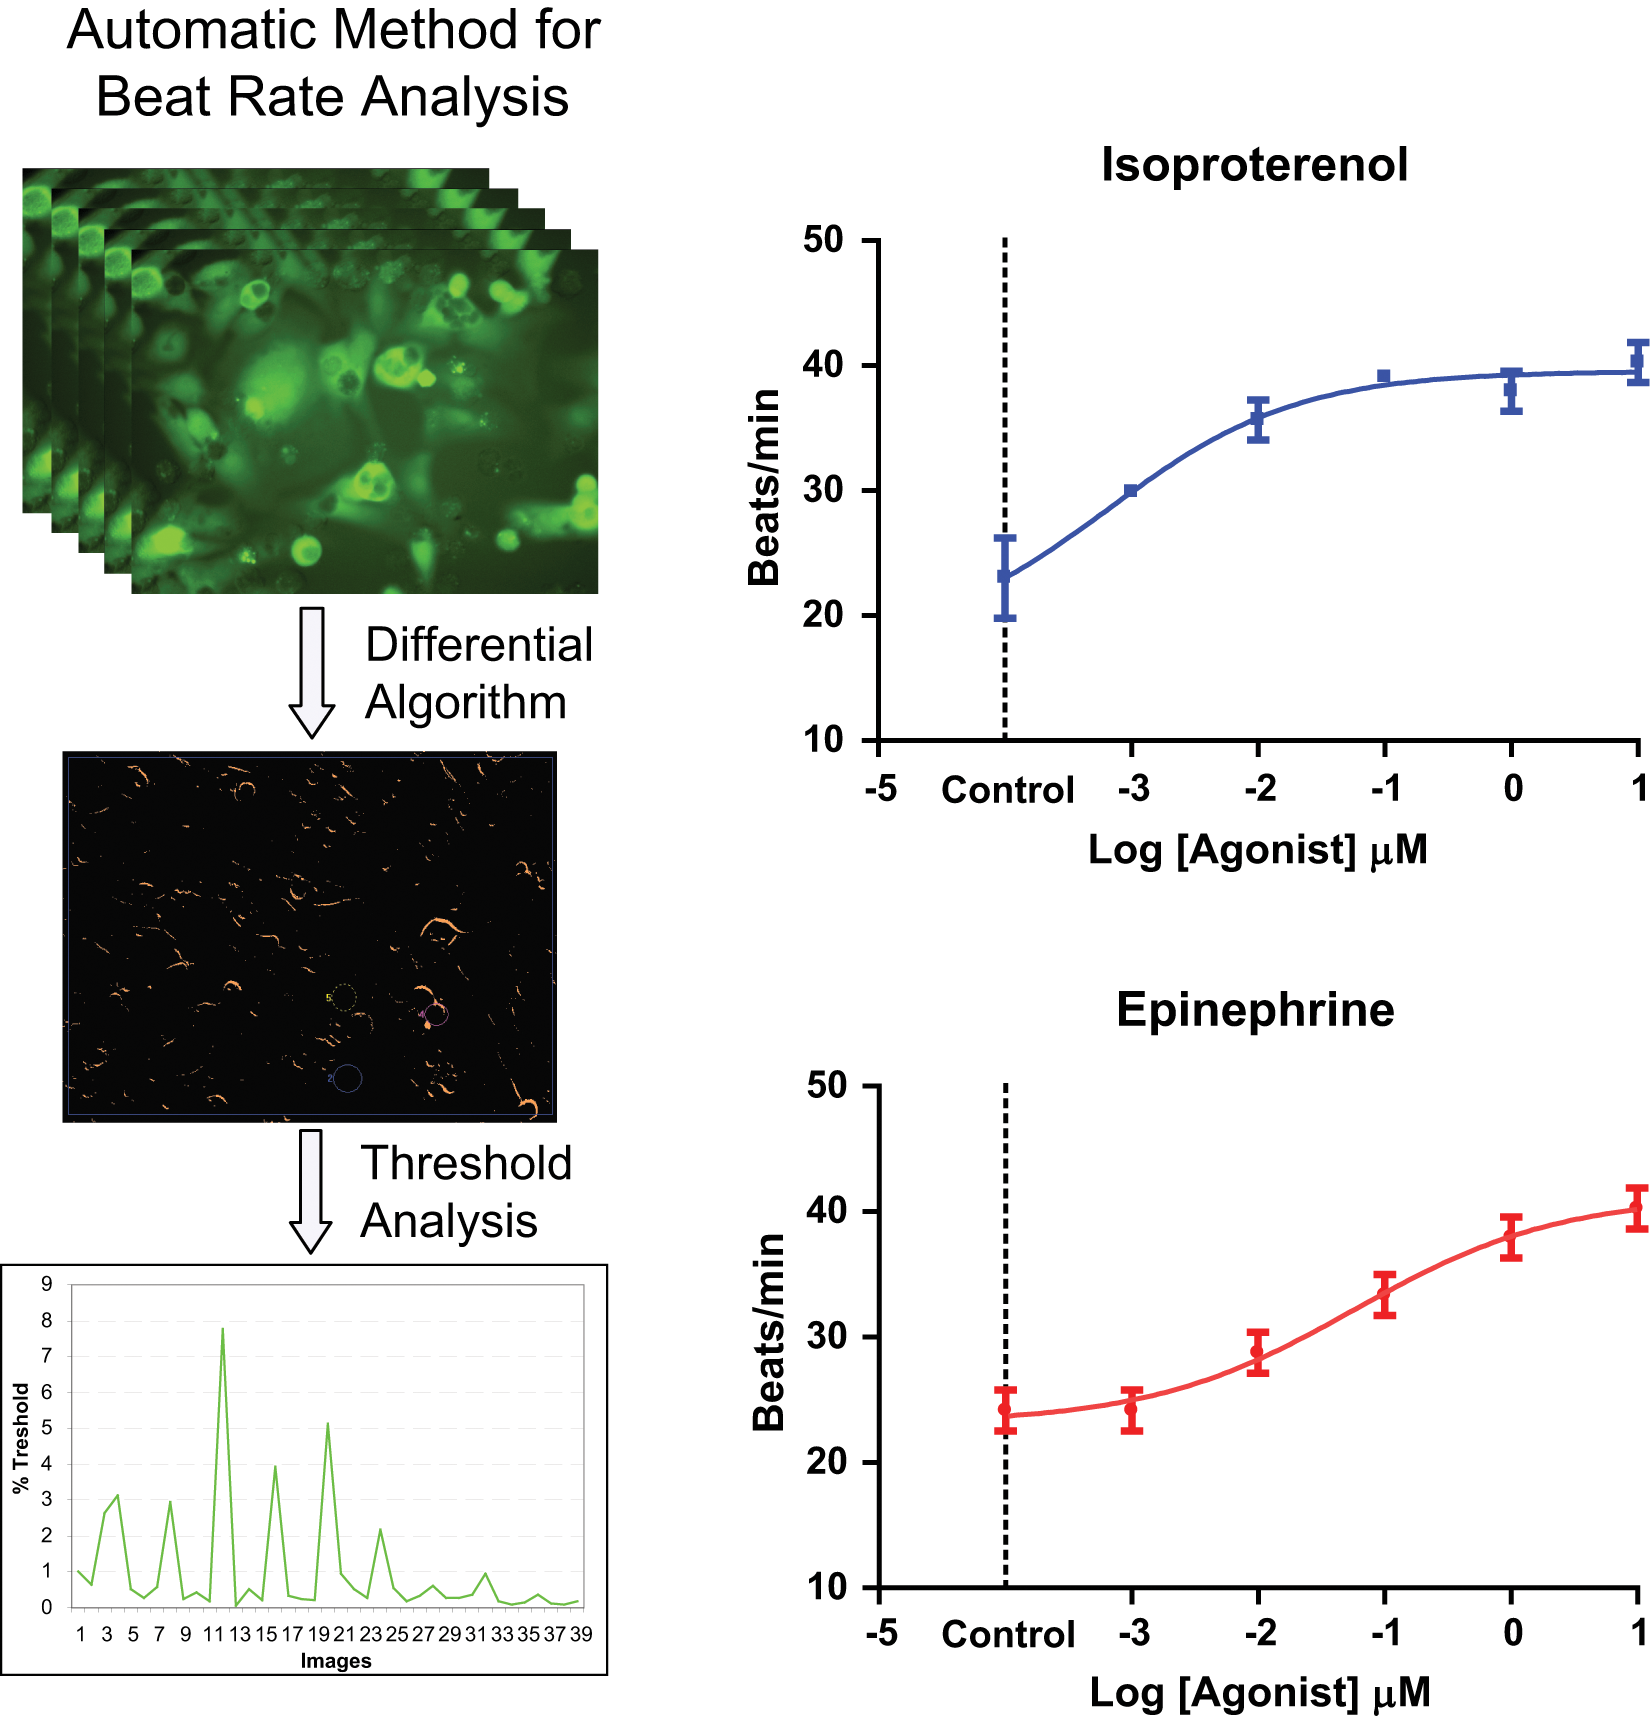
Method for determination of cardiomyocyte mechanical contractions from time-lapsed images and concentration-response curves for two positive chronotropes. Top left: Series of images acquired of beating cells. Center left: Differential image created by a MetaXpress software journal in which pixel intensity corresponds to %Threshold (%Th) value. Bottom left: Plot of integrated %Th versus image number for unstimulated cells. Right: Beat rate modulation of cardiac cells as a function of concentration of isoproterenol and epinephrine. Beat frequency was determined approximately 10 min after compound addition. Error bars represent ±1 standard deviation of the measurements.
The impact of several pharmacologic agents on the beat rate was tested using this method. Two of the agents, isoproterenol and epinephrine, are β-adrenergic receptor agonists and known stimulants of cardiac beat rate. Compounds were tested in duplicates in 96-well plates and characterized by measuring the number of contraction peaks in each well and then calculating the average beats/min for each concentration. Concentration-response curves for epinephrine and isoproterenol are shown in Figure 1 . The tested reagents modulated the frequency of beating in line with their mode of action showing the functionality of a- and β-adrenergic and acetylcholine receptors and demonstrating IC50s of compounds in the expected range (epinephrine ~50 nM, isoproterenol ~6 nM).
Monitoring Calcium Fluxes Using Time-Lapse Imaging
A second method was employed to measure cardiomyocyte contractions by using automated microscopy to monitor changes in concentration of Ca2+ synchronous with contractions. A time-lapse series of images of beating cardiomyocytes loaded with FLIPR Calcium 5 assay kit is shown in Figure 2 . The images were acquired using the ImageXpress Micro XL automated microscope using a 10× objective. A significant increase in intracellular intensity associated with synchronous contraction events can be observed. The signal from all cells in the images can be integrated and used as a monitor of the contraction event. Traces of integrated intensity from a time-lapse series of images acquired at 33 Hz for 5 s for different treatments are shown in Figure 2 .
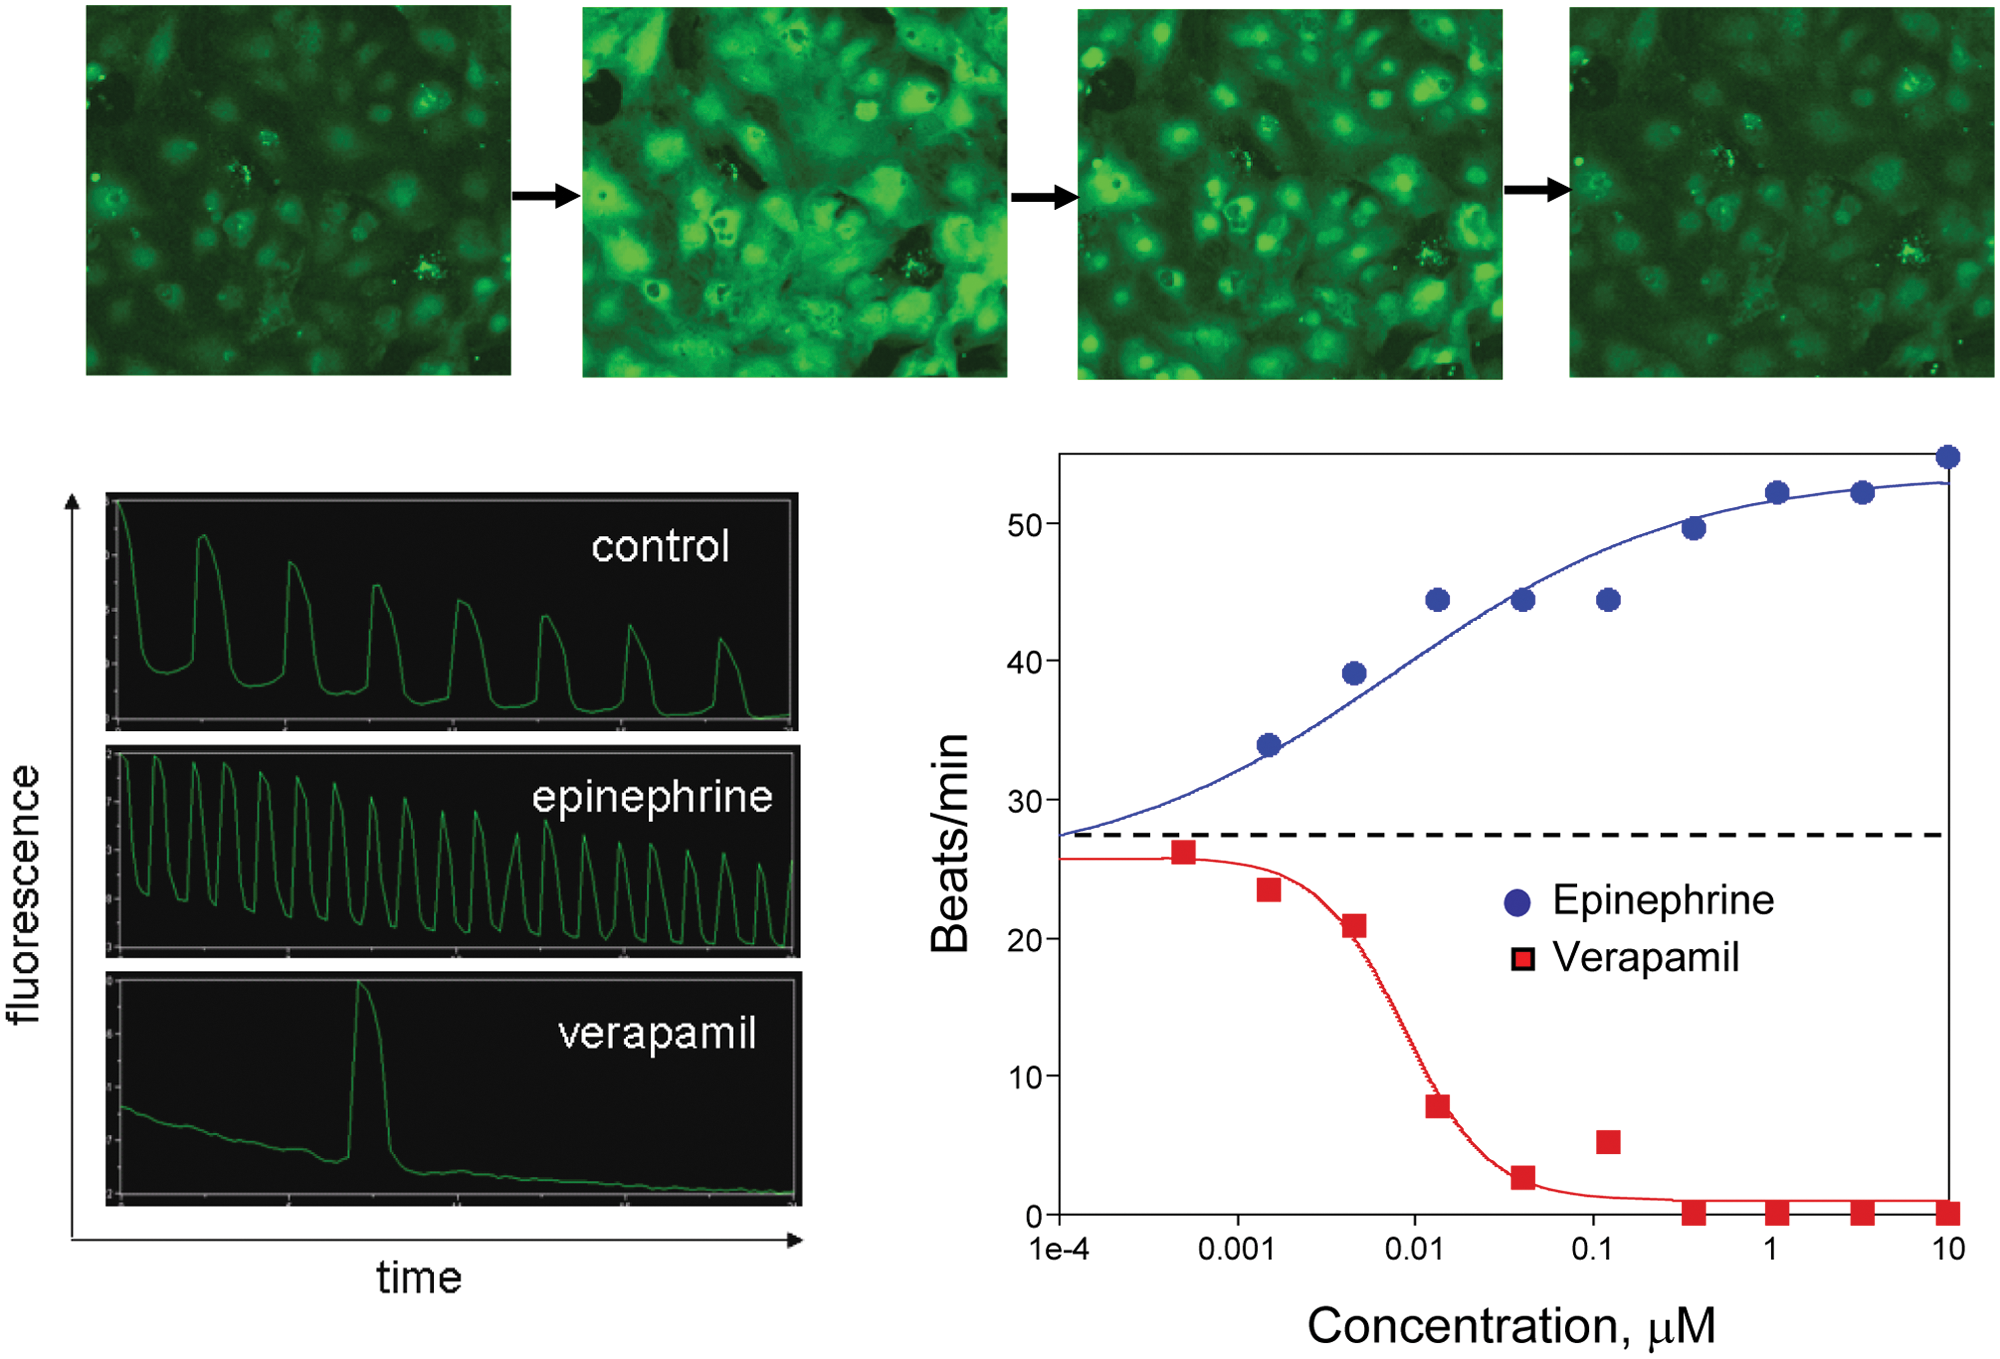
Top: Time-lapse series of images of spontaneously contracting cardiomyocytes loaded with FLIPR Calcium 5 dye. Bottom left: Integrated intensity from calcium-sensitive dye fluorescence as a function of time (20 s per trace) for beating cardiomyocytes under three conditions. Distinct peaks can be observed associated with each contraction event. Bottom right: Response of cardiomyocyte beat rate to increasing doses of epinephrine and verapamil. Beats per minute were determined by manual counting of peaks. IC50 values were determined to be 8 nm and 9 nm, respectively.
This method was used to evaluate the effects of two compounds: epinephrine and verapamil, a known negative chronotrope that is an L-type calcium channel blocker of the phenylalkylamine class.
7
Wells were analyzed on an individual basis over a ~10 min period beginning approximately 10 min after drug addition. Time-lapse images were acquired from each well for 23 s. The data were viewed as a plot of integrated fluorescence intensity versus time and manually analyzed. The number of peaks, or beats, per well were counted, and a plot of beat rate versus concentration is shown in
Figure 2
. The measured responses as well as IC50s were consistent with the expected behavior. Additional examples are presented in
HTS Cardiomyocyte Beating Assay on FLIPR Tetra System
There are several challenges associated with analyzing beating cardiomyocytes with a standard microscope-based system, including lower throughput and time difference between data acquisition from different wells. An improved method for this assay is to automatically collect kinetic fluorescence data from all wells simultaneously. A system that has that capability is the FLIPR Tetra instrument. 8 Intracellular transient Ca2+ fluxes underlying cardiomyocyte contractions were studied on this system. Time-dependent signals were measured on a well-by-well basis from both 96- and 384-multiwell plates with excellent signal to noise. Representative traces of a control well and wells dosed with epinephrine and verapamil as measured by this system are shown in Figure 3 (top). An expanded trace of a single contraction event is also shown in the same figure (bottom right). It has been found that the cell-beating pattern can be disrupted by compound addition and that the best stability of cell beating occurs approximately after 5 min after addition. An example trace of cell-beating disruption by addition of isoproterenol is also shown in Figure 3 (bottom left). Concentration responses were measured by adding compounds in half-log serial dilutions using on-board liquid handling. Results from a concentration-response study of eight different compounds are shown in Figure 4 .
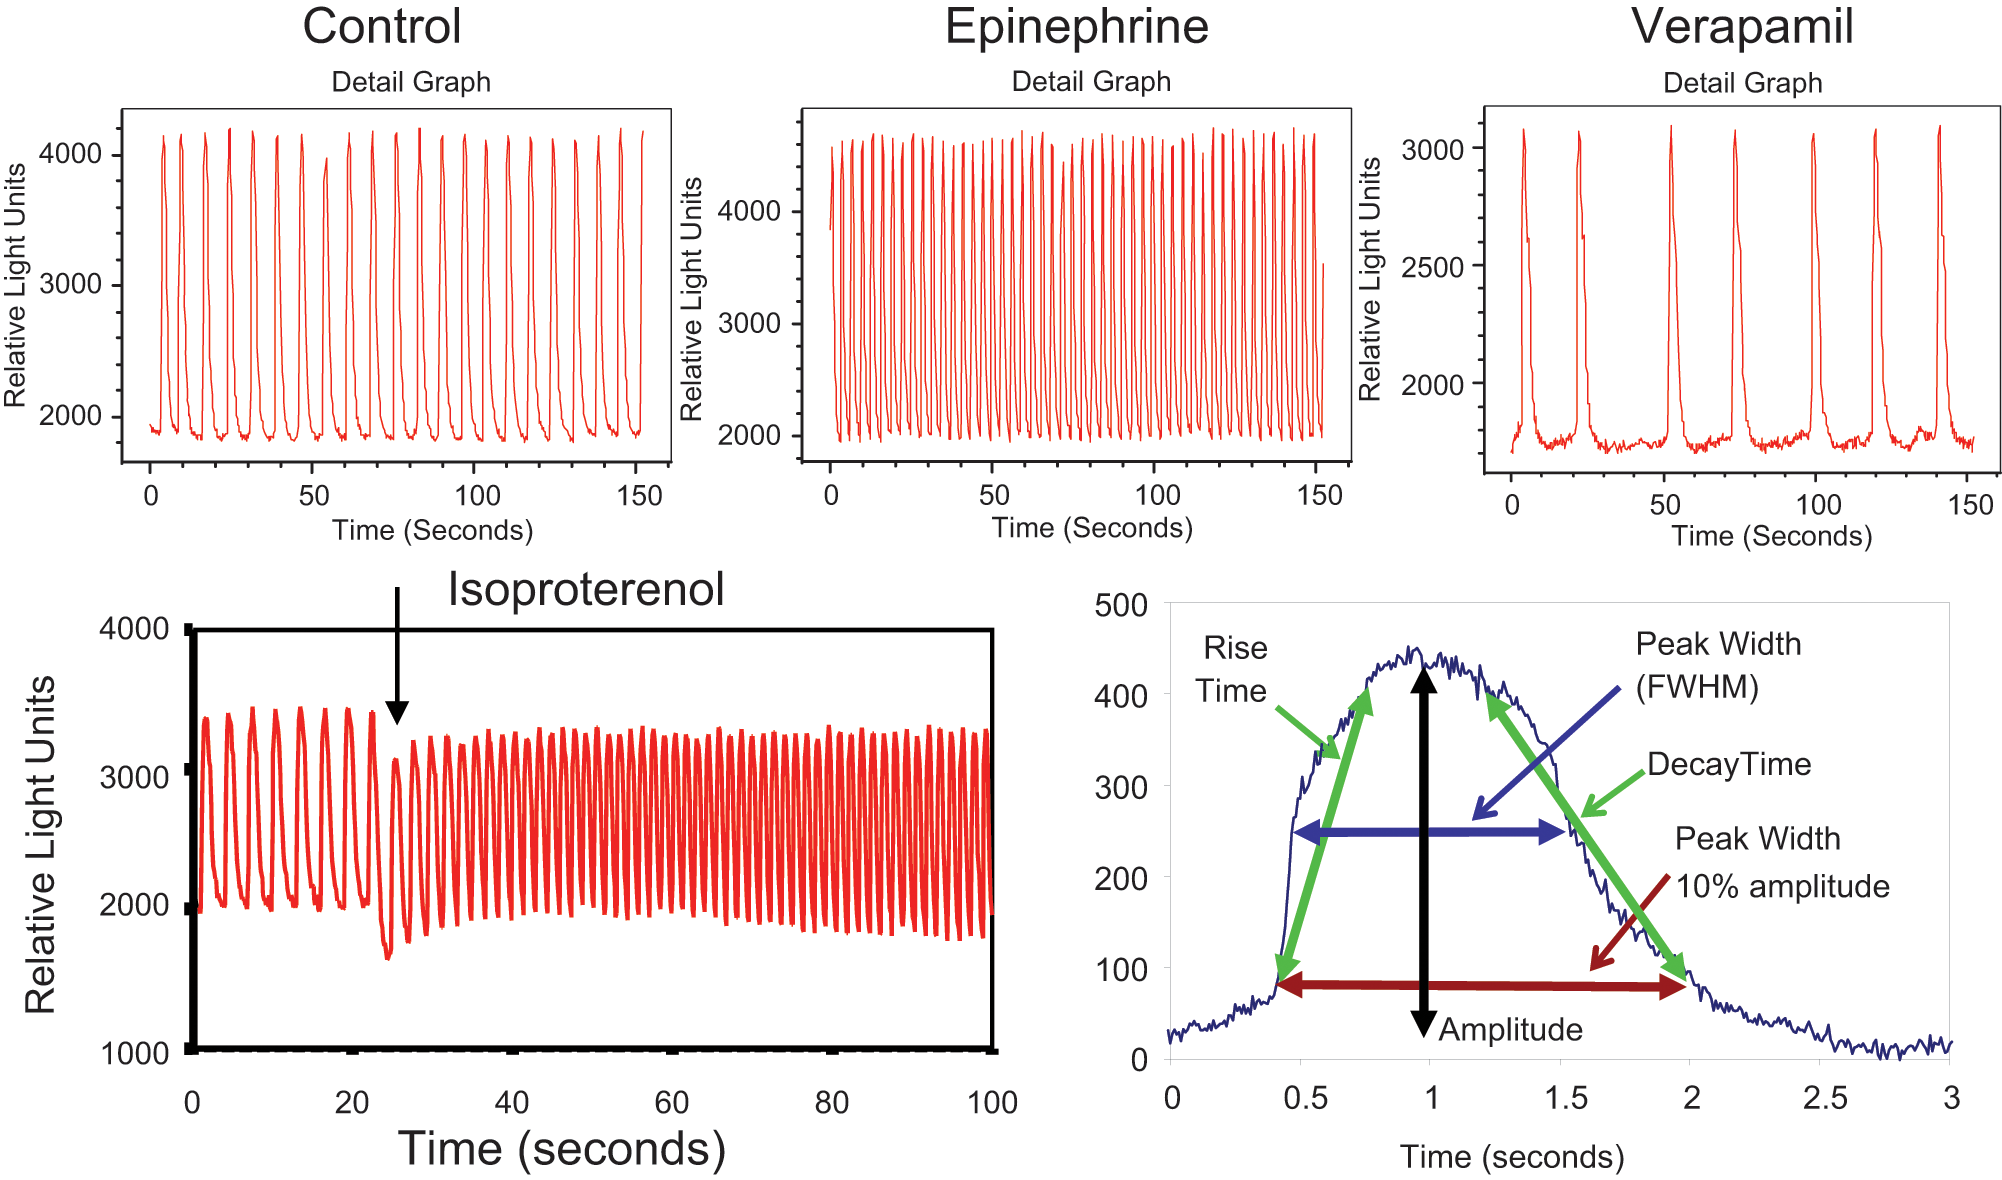
Top: Fluorescence intensity versus time for three representative wells of beating cardiomyocytes loaded with FLIPR Calcium 5 dye. Measurement was done on a FLIPR Tetra system. Bottom left: Fluorescence intensity versus time for a single control well of beating cardiomyocytes loaded with FLIPR Calcium 5 dye during addition of 0.1 µM isoproterenol. Bottom right: Fluorescence intensity profile of a single cardiomyocyte contraction event. Data for this trace were acquired at 120 frames per second. Calculated analysis parameters are shown on the profile.
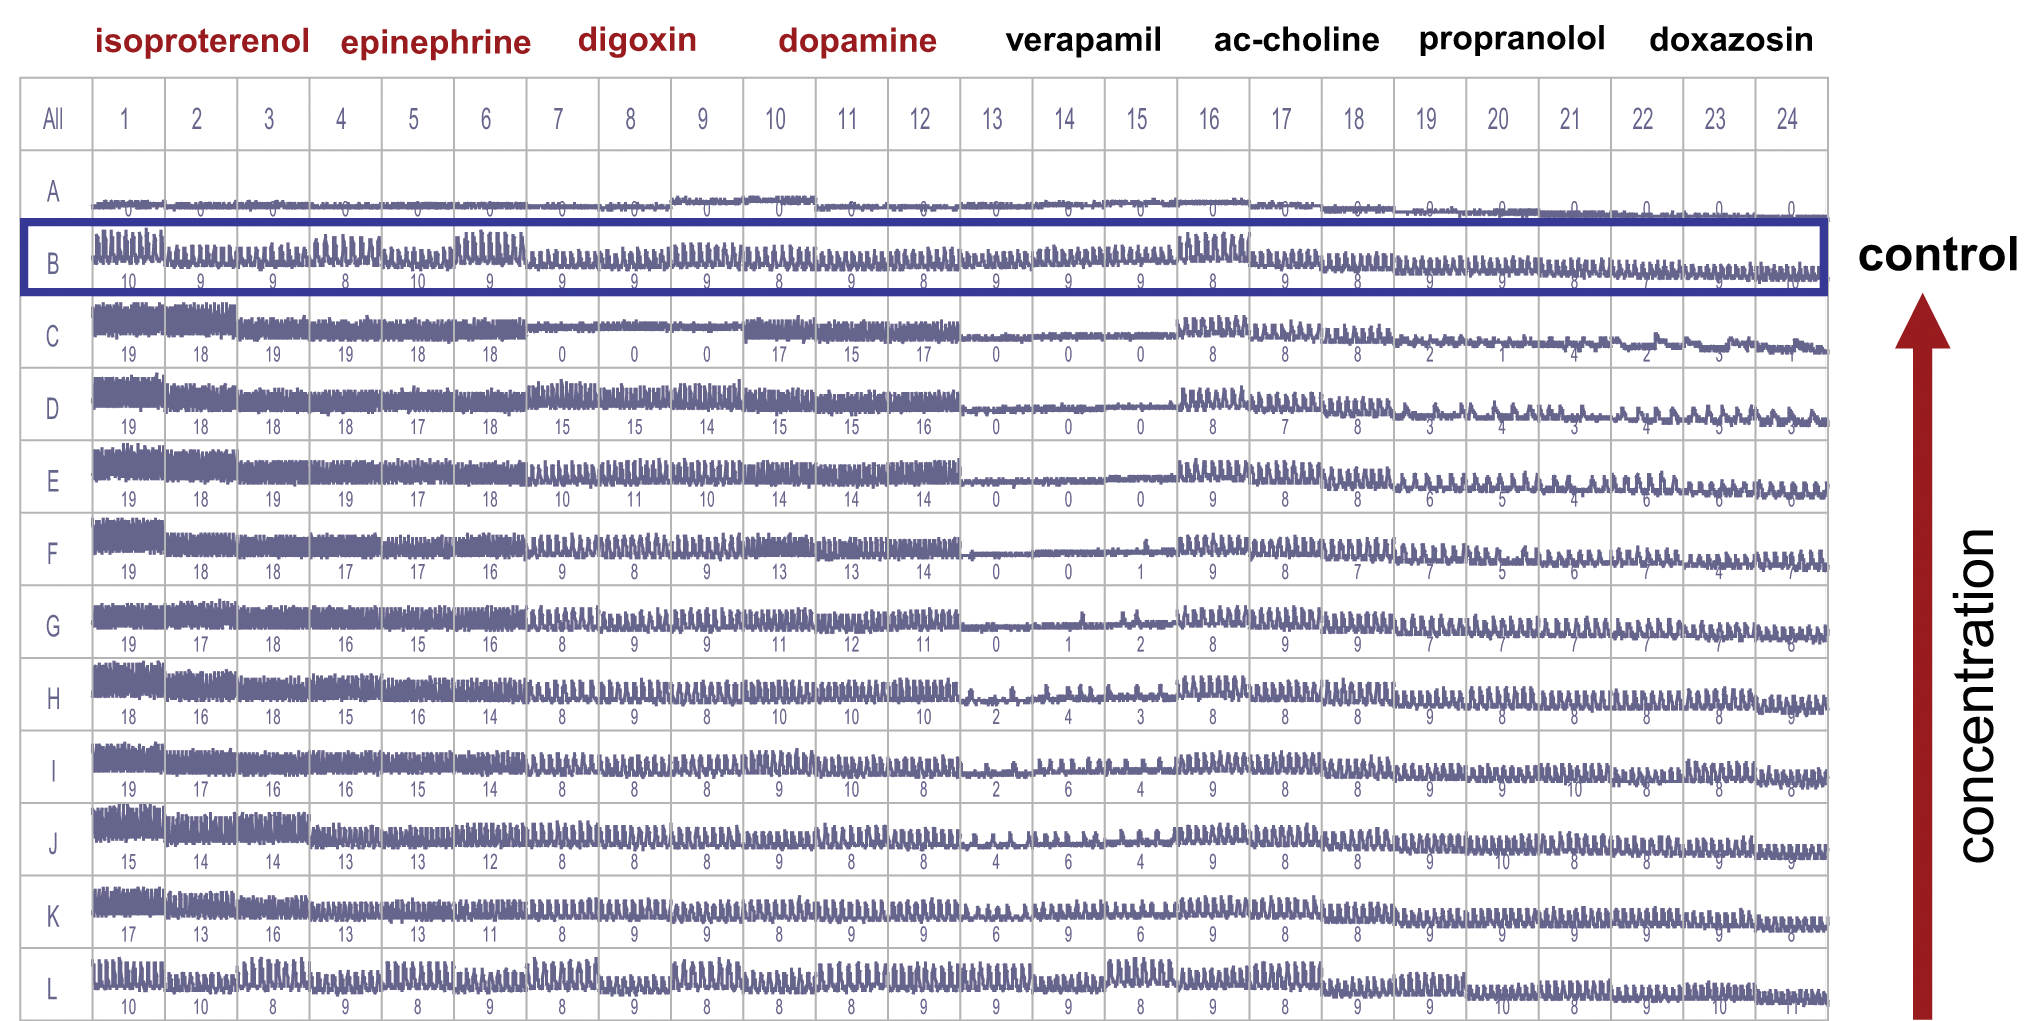
Screenshot from Screenworks Peak Pro software showing cardiomyocyte intensity fluctuation traces for positive and negative chronotropes. Control wells were located in rows B and L. Compounds were added in half-log serial dilutions from rows C through K in replicates of three. Numbers in each well indicate beat counts per recorded time (30 s). Note: Row A contained no cells.
Even though the assay optimization for HTS was not in the scope of present studies, assay variability was acceptable for most experiments. For example, the average and standard deviation of the controls wells in rows B and L for the experiment shown in Figure 4 were found to be 15.0 ± 1.0 and 15.0 ± 1.5 beats/min, respectively. Typical well-to-well coefficients of variation are 15% or less for most parameters. The baseline rate of beating was consistent between plates within a given experiment or between experiments using the same protocol. We have observed some dependence of initial beating rate on the time of cell culture (data not shown). Further assay optimization should increase reproducibility and precision of the assay.
Automated Data Analysis
Automated data analysis is required to make the system practical for running large-scale assays. The automated algorithm in ScreenWorks Peak Pro was used to analyze the data. A typical beat trace and measured parameters are shown in Figure 3 . The data analysis occurs in real time, and results are presented on a well-by-well basis to the user. The results can be exported to a standard comma-separated-variable (*.csv) file for further analysis.
The software was validated by comparing automated results to manual measurements. The number of peaks in each well were measured manually for three representative plates and compared with automated peak count values. Full concordance was observed for more than 96% of the wells. In addition, several representative wells were manually characterized by measuring shape parameters (widths, rise, and decay times) for each peak and then calculating average and standard deviation of those values for each well. In general, the manual shape values agreed to within 10% of the automated peak measurements. In some cases, the peak width, or peak FWHM values, showed greater discrepancy. This is attributed to the fact that the automated method uses a second-order polynomial fit to each peak and calculates a width based on that fit. This is less accurate for more complex peak shapes such as seen with cisapride (see Fig. 5 ). However, the peak width at 10% amplitude values, which are not based on the peak fit, showed much better agreement between the manual and automated methods. Therefore, this parameter is recommended for analysis of peaks with irregular shape.
(
Cardiomyocyte Beating Assay Results
Assessment of Positive and Negative Chronotrope Effects
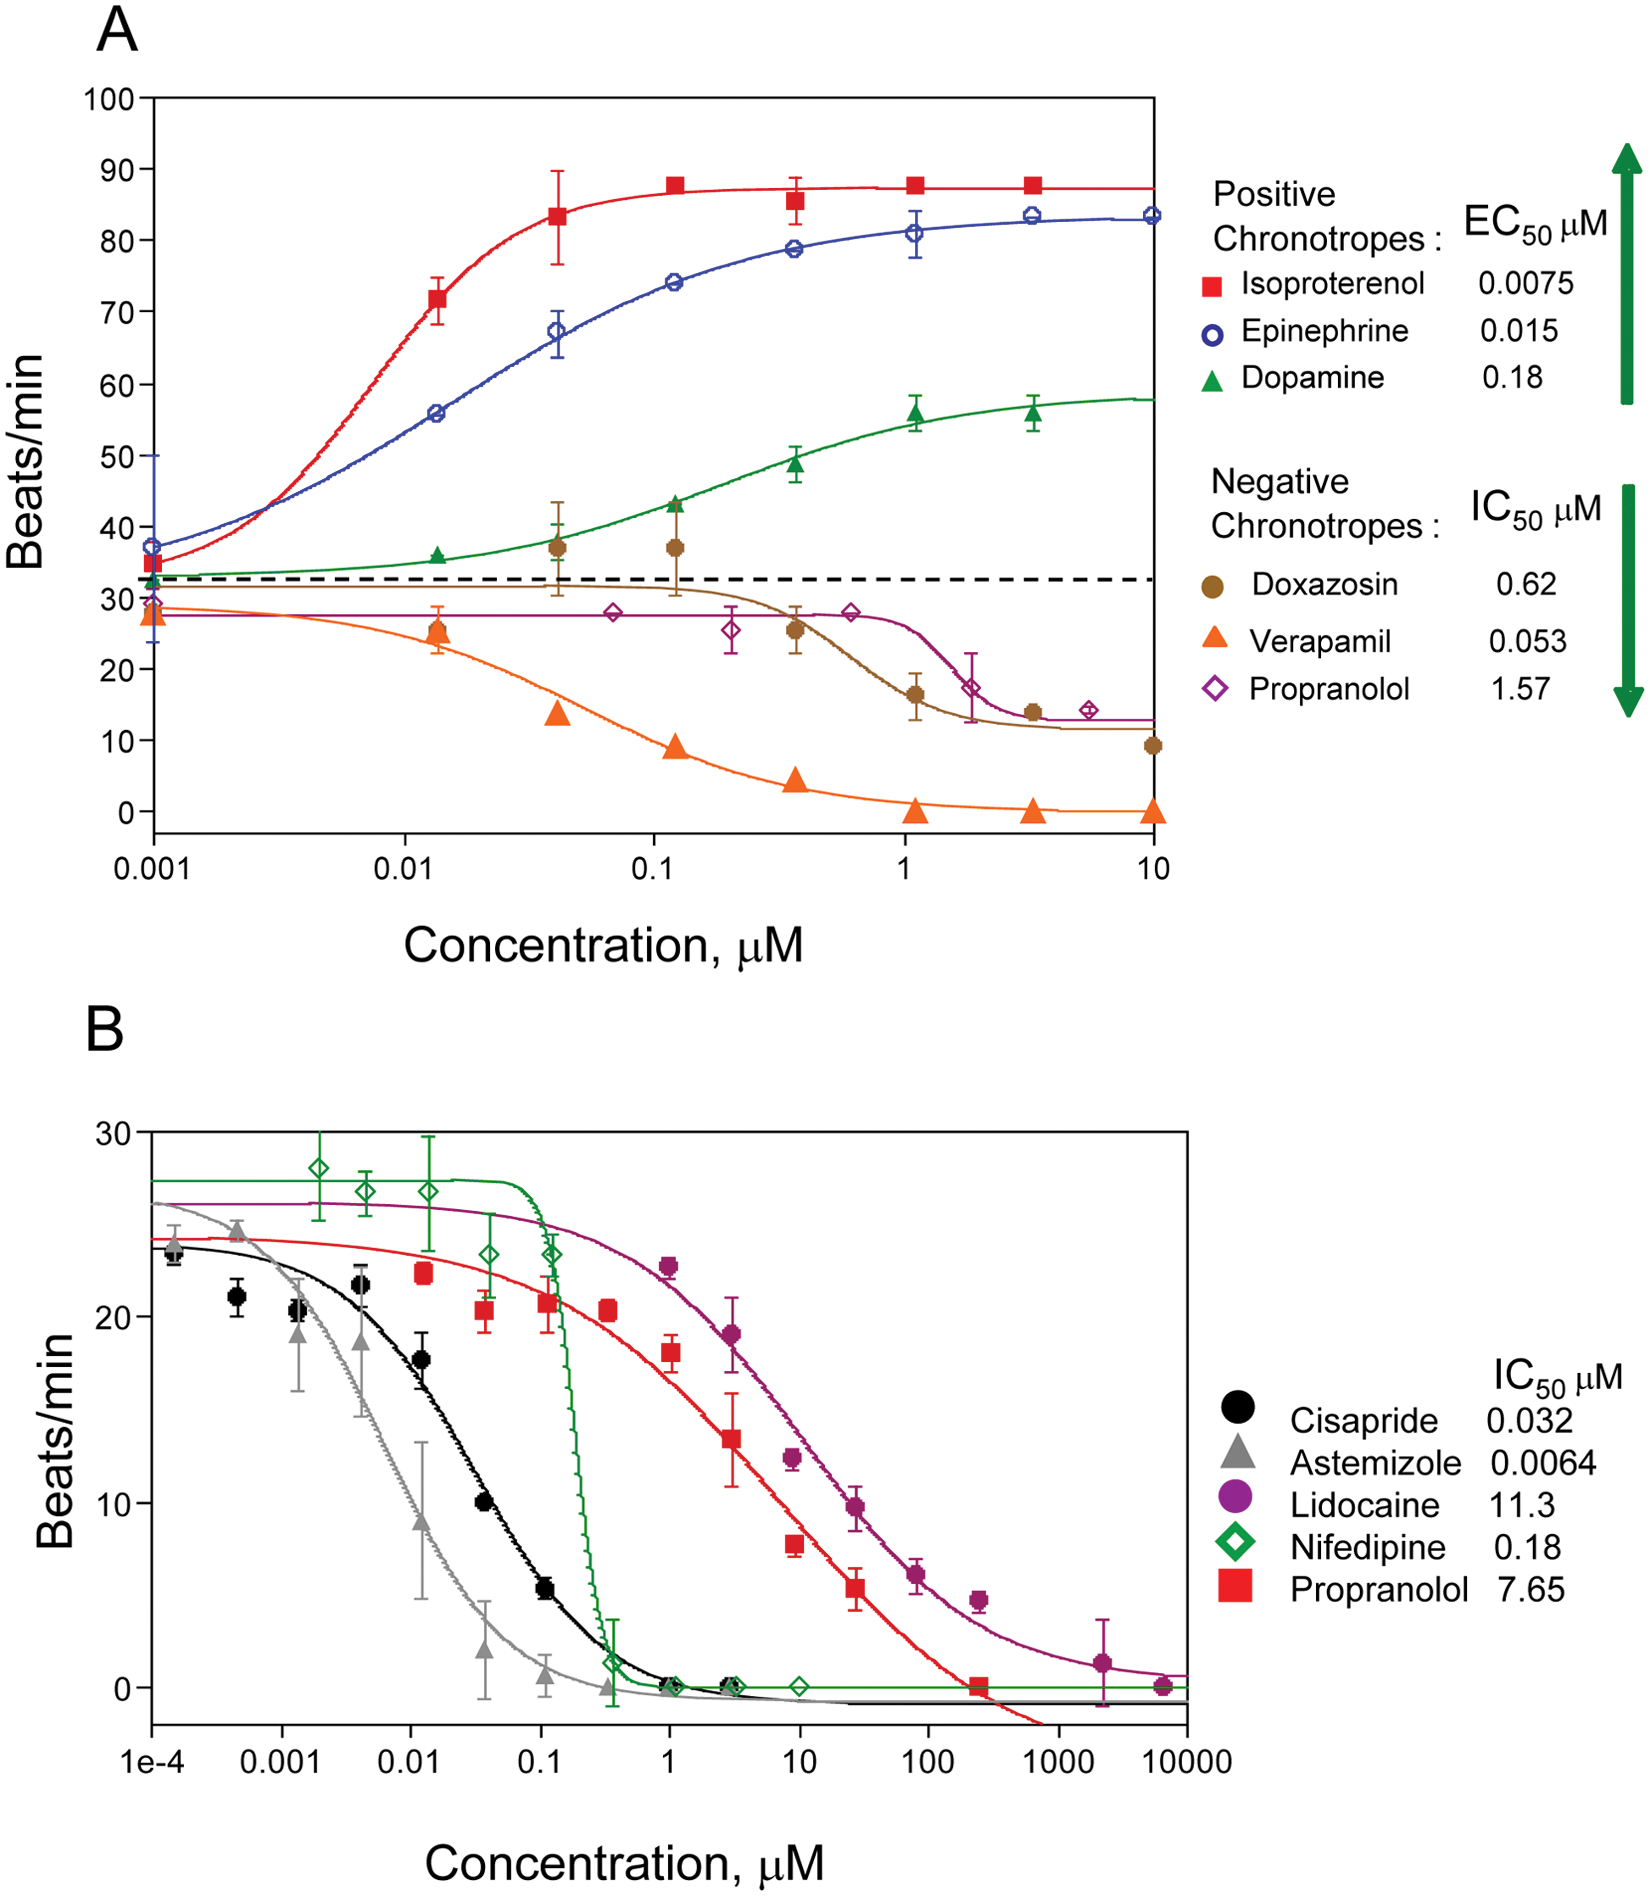
Beating rate is a potentially valuable phenotypic parameter for use in drug discovery and development. The automated cardiac beating assay was used to assess effects of several known positive and negative chronotropes. Positive chronotropes included epinephrine and isoproterenol. In addition, dopamine catecholamine neurotransmitter, a precursor of epinephrine, was used. Negative chronotropes included propranolol, a nonselective β-blocker; doxazosin, an alpha-1 adrenergic receptor blocker that inhibits the binding of norepinephrine (released from sympathetic nerve terminals) to the alpha-1 receptors; verapamil; and acetylcholine, an acetylcholine receptor agonist. We were able to observe concentration-dependent changes in the beat rate, agreeing with the mode of action of each compound. Results from a representative experiment are shown in Figure 6A . The IC50s of compounds tested were in good correlation with data obtained by other types of assays9–16 ( Table 1 ). For example, IC50s for isoproterenol 10 and verapamil 13 tested in other models were 13 nM (isolated rabbit cardiomyocytes) and 167 nM (isolated guinea pig hearts), respectively. However, we were not able to detect the effect of acetylcholine at present assay conditions.
(
Beating Cardiac Assay Concentration Response Results
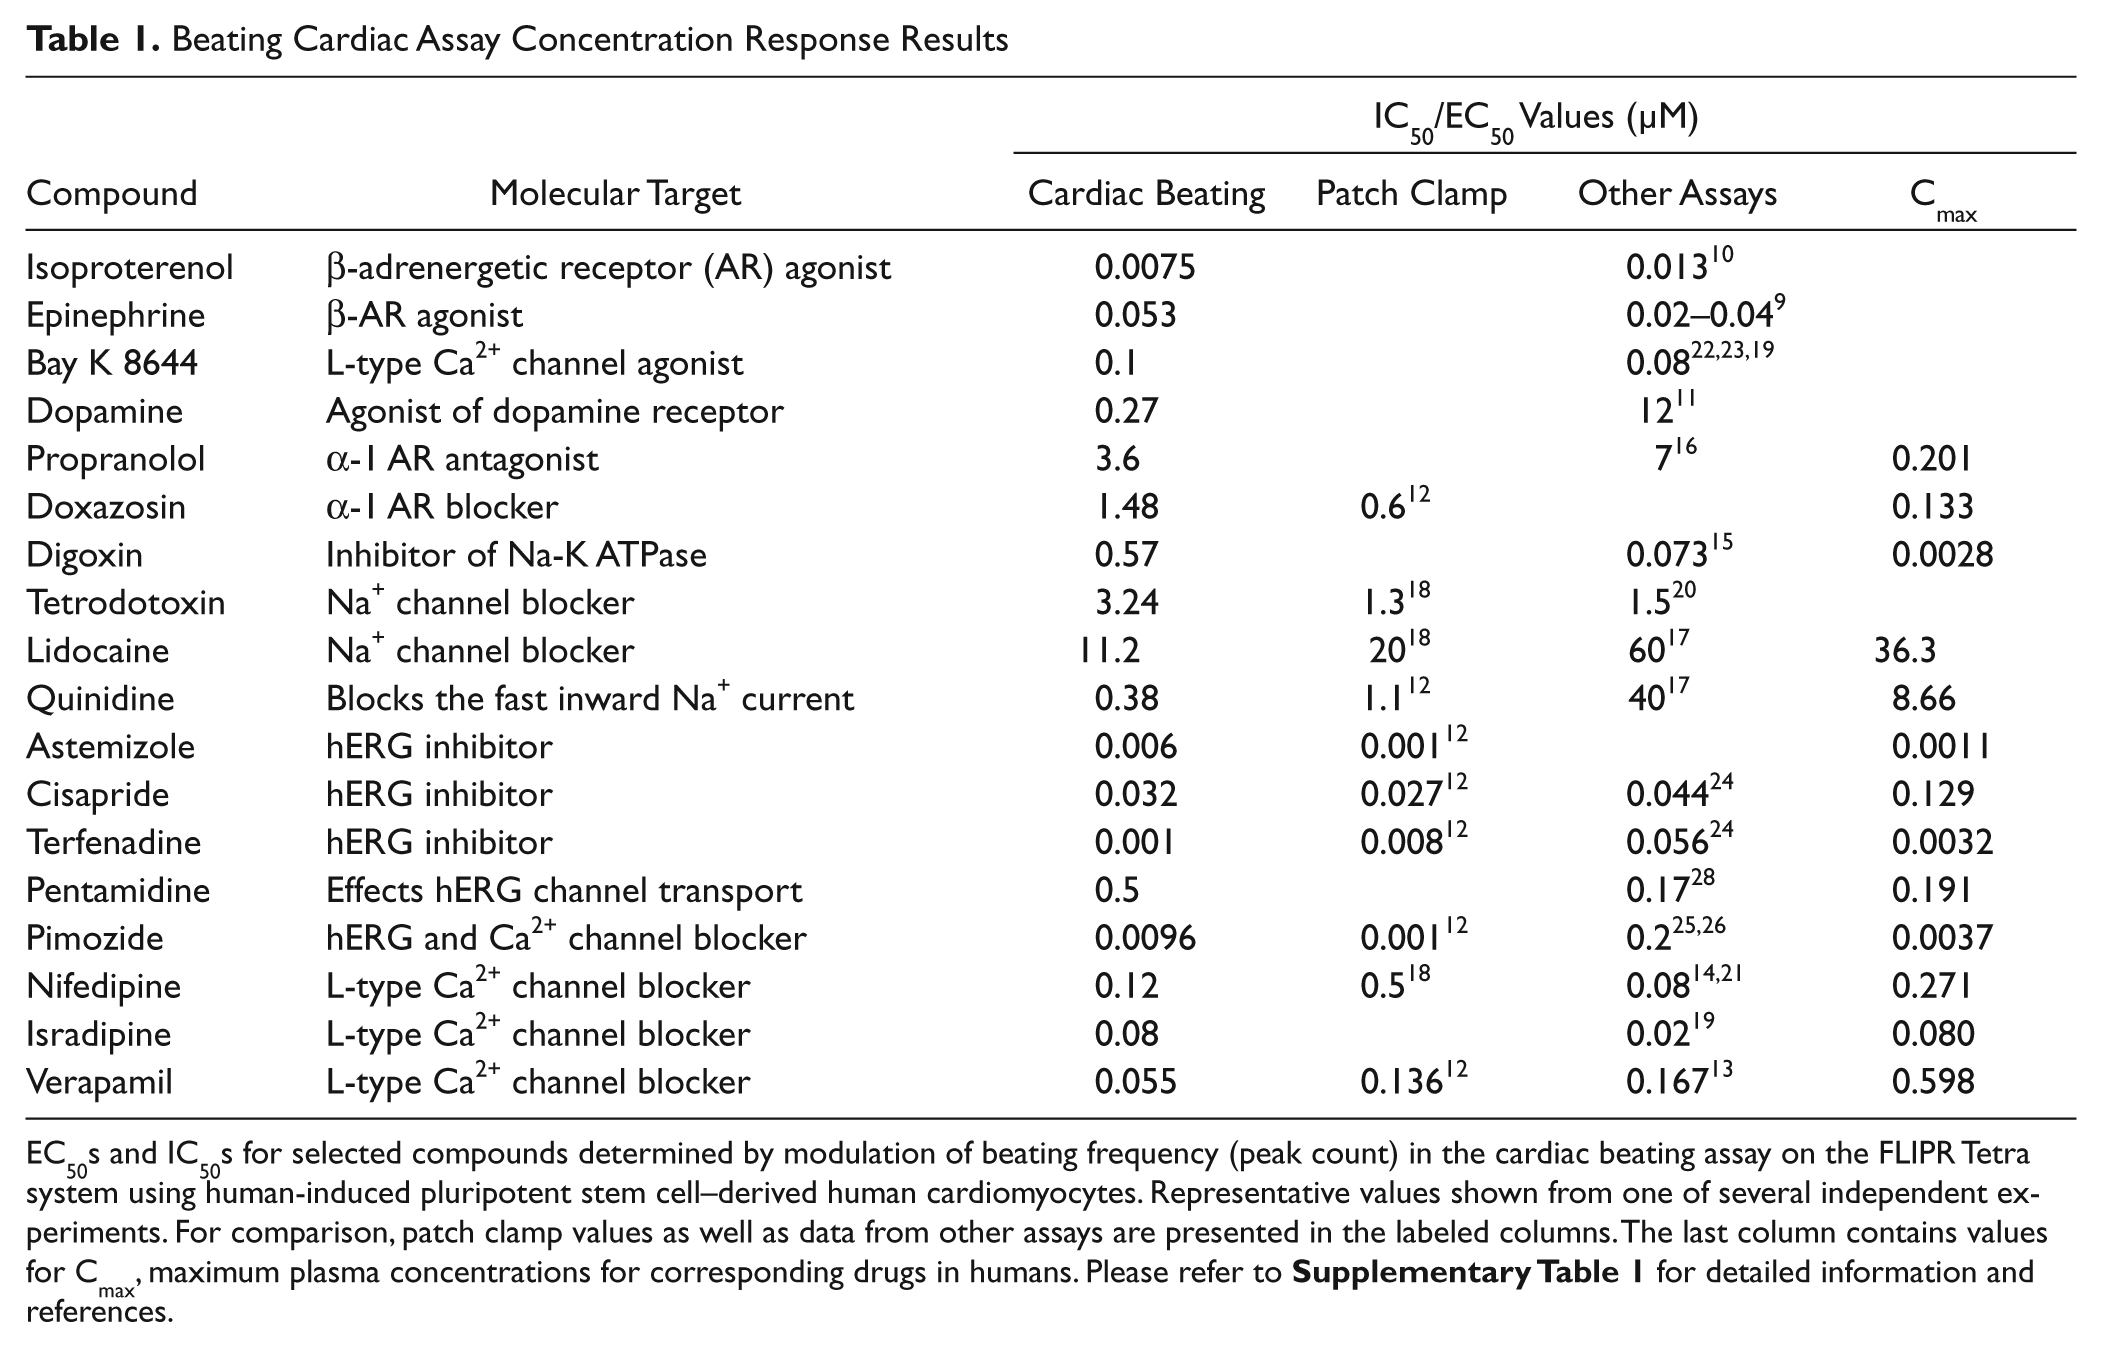
EC50s and IC50s for selected compounds determined by modulation of beating frequency (peak count) in the cardiac beating assay on the FLIPR Tetra system using human-induced pluripotent stem cell–derived human cardiomyocytes. Representative values shown from one of several independent experiments. For comparison, patch clamp values as well as data from other assays are presented in the labeled columns. The last column contains values for Cmax, maximum plasma concentrations for corresponding drugs in humans. Please refer to
Cardiotoxic Compounds
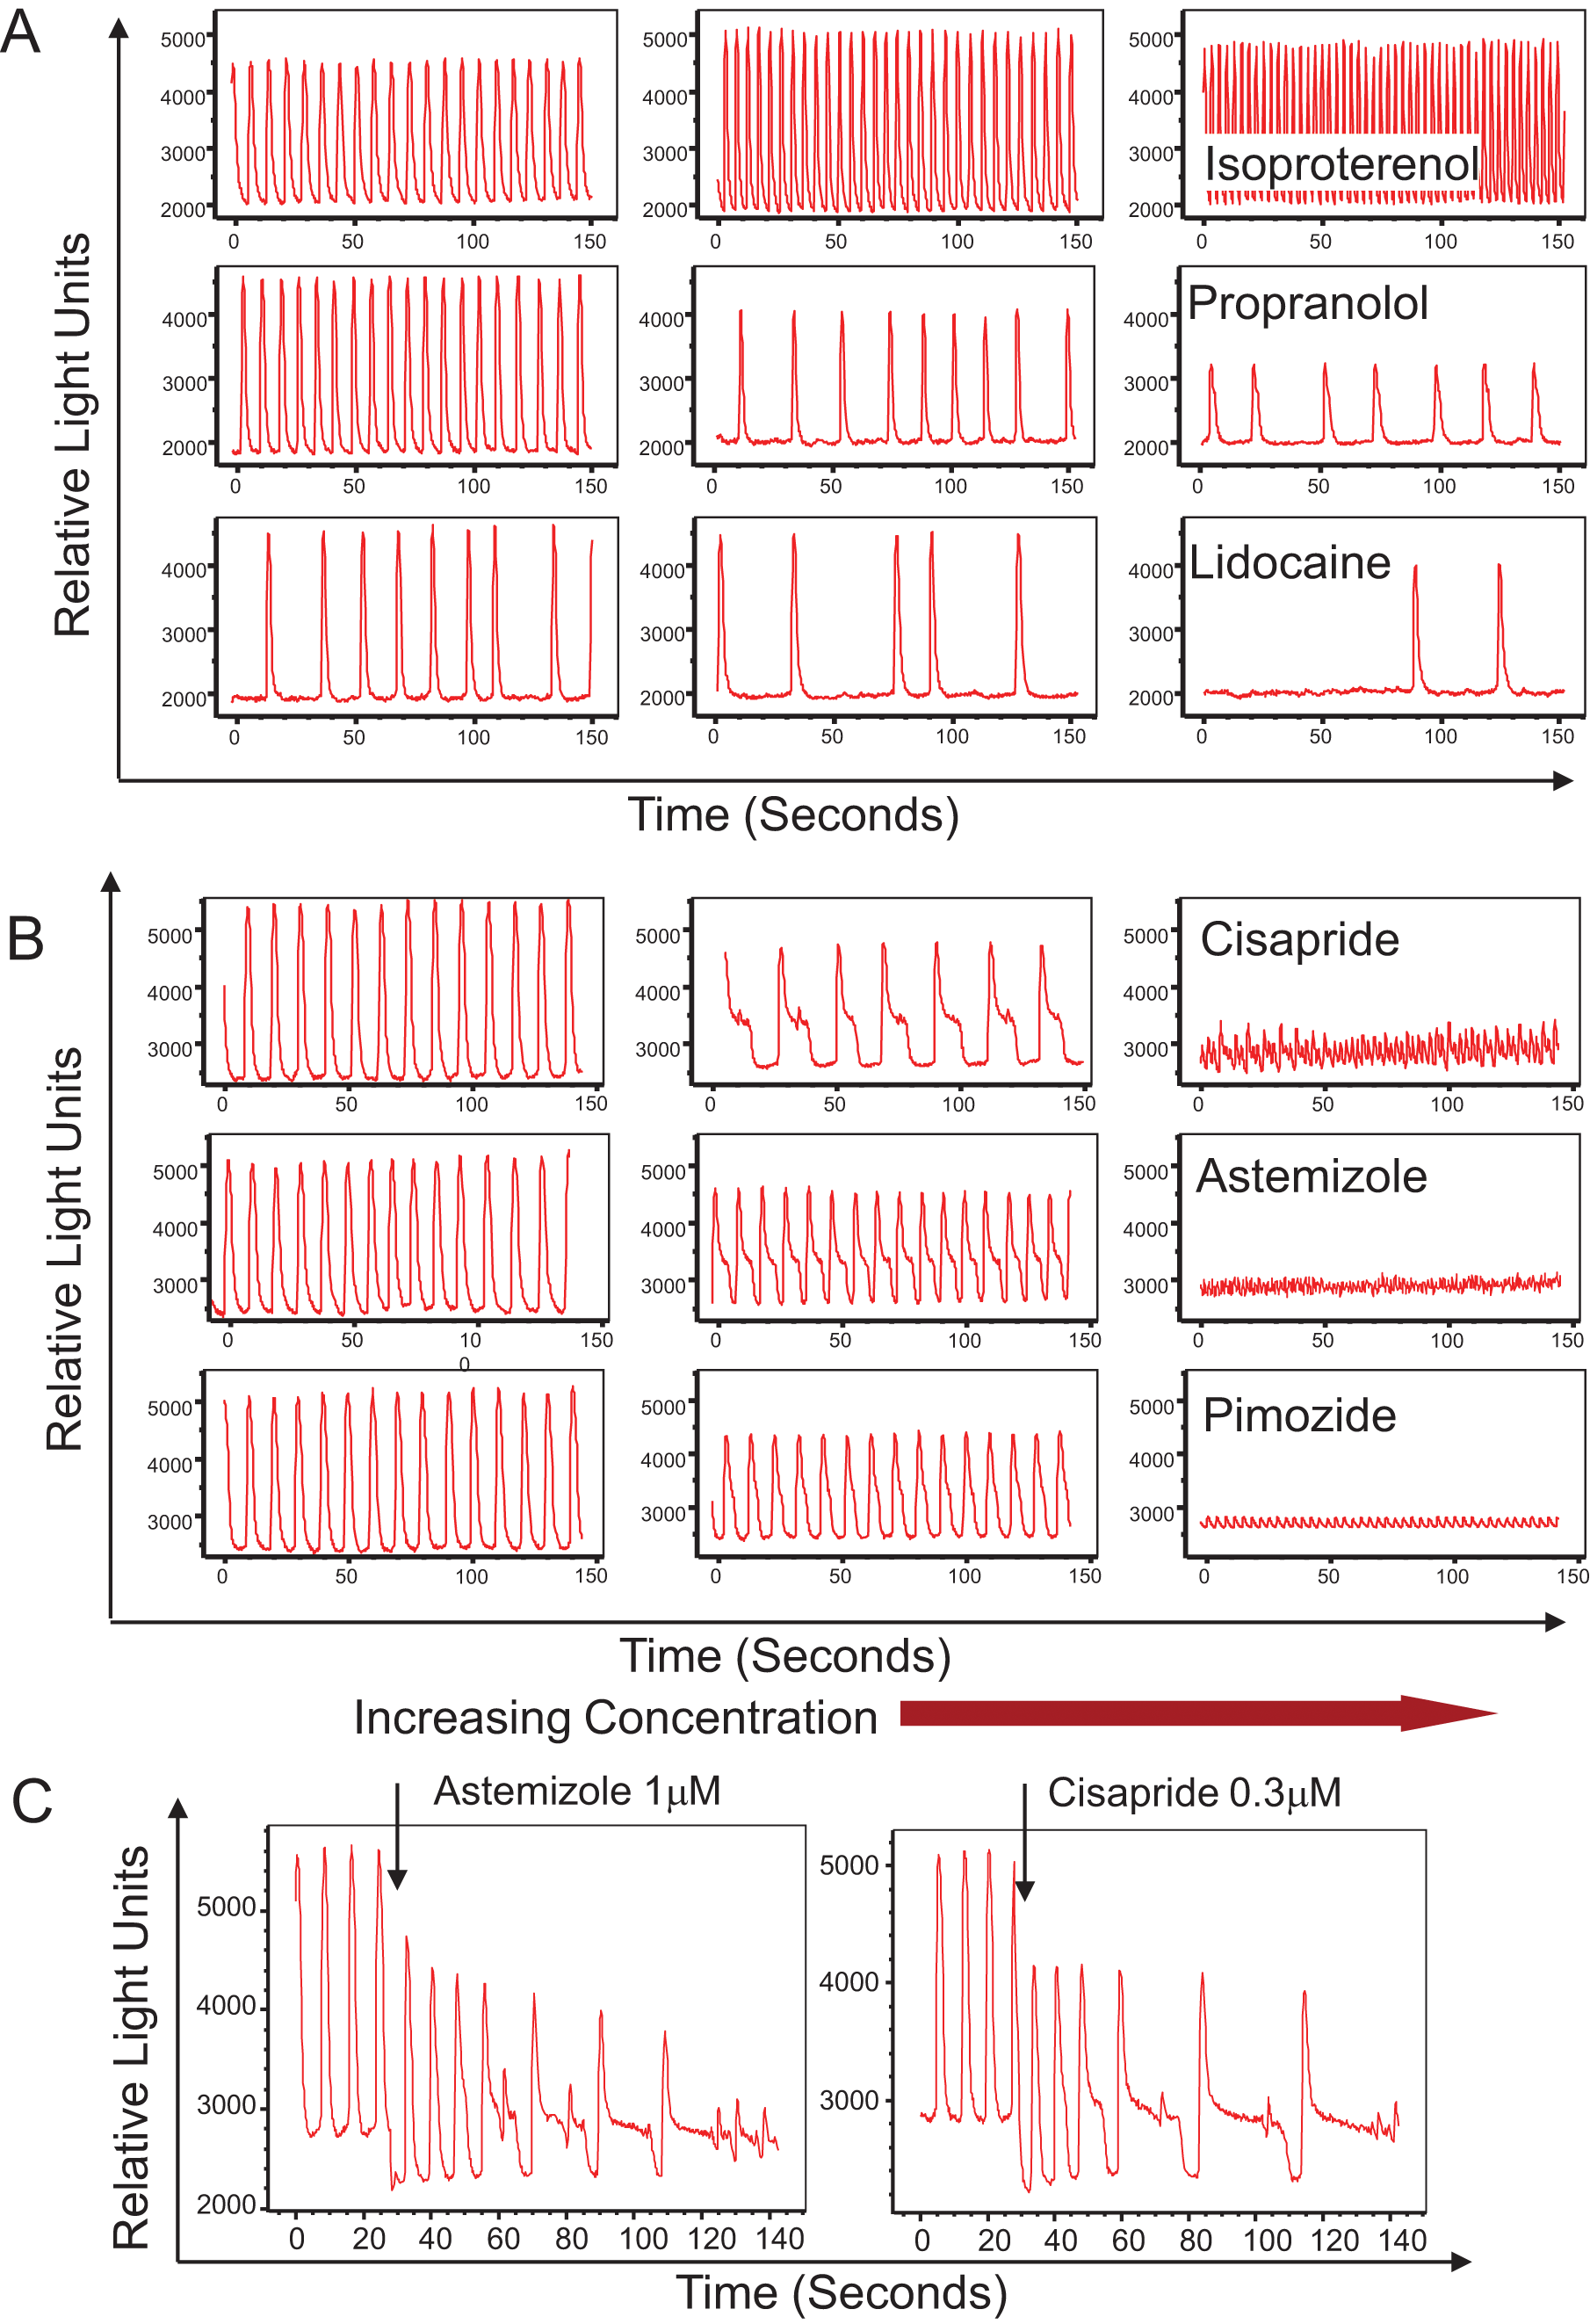
The FLIPR Tetra system also allows for detection of concentration-dependent atypical patterns and changes in cell-beating rate caused by several known cardiotoxic compounds including hERG, Ca2+ and Na+ channel blockers. In each case, the baseline was recorded immediately prior to compound addition, and then measurements were taken at regular intervals over a 60 min period. We found that high concentrations of many compounds caused effect immediately (within seconds) after addition (see, for example, the effect of isoproterenol addition shown in Figure 3 , bottom left).
Potentially cadiotoxic compounds can be detected in the assay by their effect on the beat rate pattern. We have tested several known blockers of different ion channels. Those included blockers of Na+ channels (lidocaine, tetrodotoxin), Ca2+ channels (nifedipine, isradipine, verapamil), and hERG channels (cisapride, terfenadine, astemizole, pimozide). Presented in Figure 6B are selected concentration-dependent inhibition curves for the beating rates as well as IC50s determined in the assay. These correlate well with reported IC50s for cardiac toxicity of those compounds ( Table 1 ).
Na+ channels are responsible for the inward Na+ current and depolarization phase of cardiac action potential. Treatment with the Na+ blocker lidocaine resulted in concentration-dependent inhibition of beating rate as well as irregularities in the beating profile (see Figs. 5A , 6B , and Table 1 ). The compound tetrodotoxin had a similar effect. The IC50 for lidocaine was 11.2 µM, which is in the same order as published values of 60 µM (rat cardiac myocytes 17 ) and 20 µM (mouse ESC-derived cells 18 ). The IC50 for tetrodotoxin of 3.2 µM was relatively higher than the 0.28 µM value observed in impedance studies (mouse ESC-derived cardiomyocytes) 19 but close to automated patch clamp values (1.3 µM for mouse 18 and 1.5 µM for human 20 cardiomyocytes).
The effect of Ca2+ channel blockers was tested with nifedipine, a dihydropyridine class of L-type calcium ion channel blocker. We have observed concentration-dependent inhibition of the beating rate (IC50 120 nM) for this compound, which is consistent with 79 nM observed in Langendorff-perfused murine hearts14,21 with no dramatic change of the beating pattern. Isradipine, another example of L-type calcium channel blocker, also decreased the beating rate with an IC50 of 80 nM ( Table 1 ), which is on the same range as the value of 20 nM reported for the impedance assay using mouse stem cell–derived cardiomyocytes. 19 The compound Bay K 8644 acts as an agonist of calcium channels.22,23 Treatment with this compound increased the beating rate in a concentration-dependent manner with an EC50 of 100 nM, which is consistent with Abassi’s observation (77 nM for mouse ESC-derived cells) as well as other reports (33 nM for rat primary myocytes). 19
The outward K+ current is part of the repolarization phase of cardiac action potential, and blocking the K+ channel (hERG channel) results in a prolonged repolarization phase. hERG inhibitors are an important class of compounds that are considered to be potentially dangerous, and screening for blockers of this channel is required by the Food and Drug Administration. We have tested several known inhibitors of the hERG channel (cisapride, astemizole, terfenadine, and pimozide) and observed concentration-dependent inhibition of beating rate by the compounds (see Figs. 5B , 6B , and Table 1 ). The IC50s observed for cisapride and astemizole are 32 nM and 6 nM, respectively, which are close to published values obtained by patch clamp and other methods.12,24–26 In addition, there were dramatic changes of the beating pattern: the repolarization phase of beating patterns become increased as well as durations of each beat. The most significant effect we have observed is for cisapride ( Figs. 5 and 7 ), where there was a very prominent plateau phase on the repolarization shoulder of each beat. We have also noted a brief oscillation part at the end of each plateau ( Fig. 5 ). Using ScreenWorks Peak Pro software, we were able to characterize this beating pattern by measuring a very significant increase of peak width at 10% of amplitude as well as duration of the depolarization phase. We were able also to observe the overlap of the next beat to the previous one, leading to irregular extra beats flagged by the software. Interestingly, at higher concentrations of compounds, we have observed a very high frequency of Ca2+ oscillations
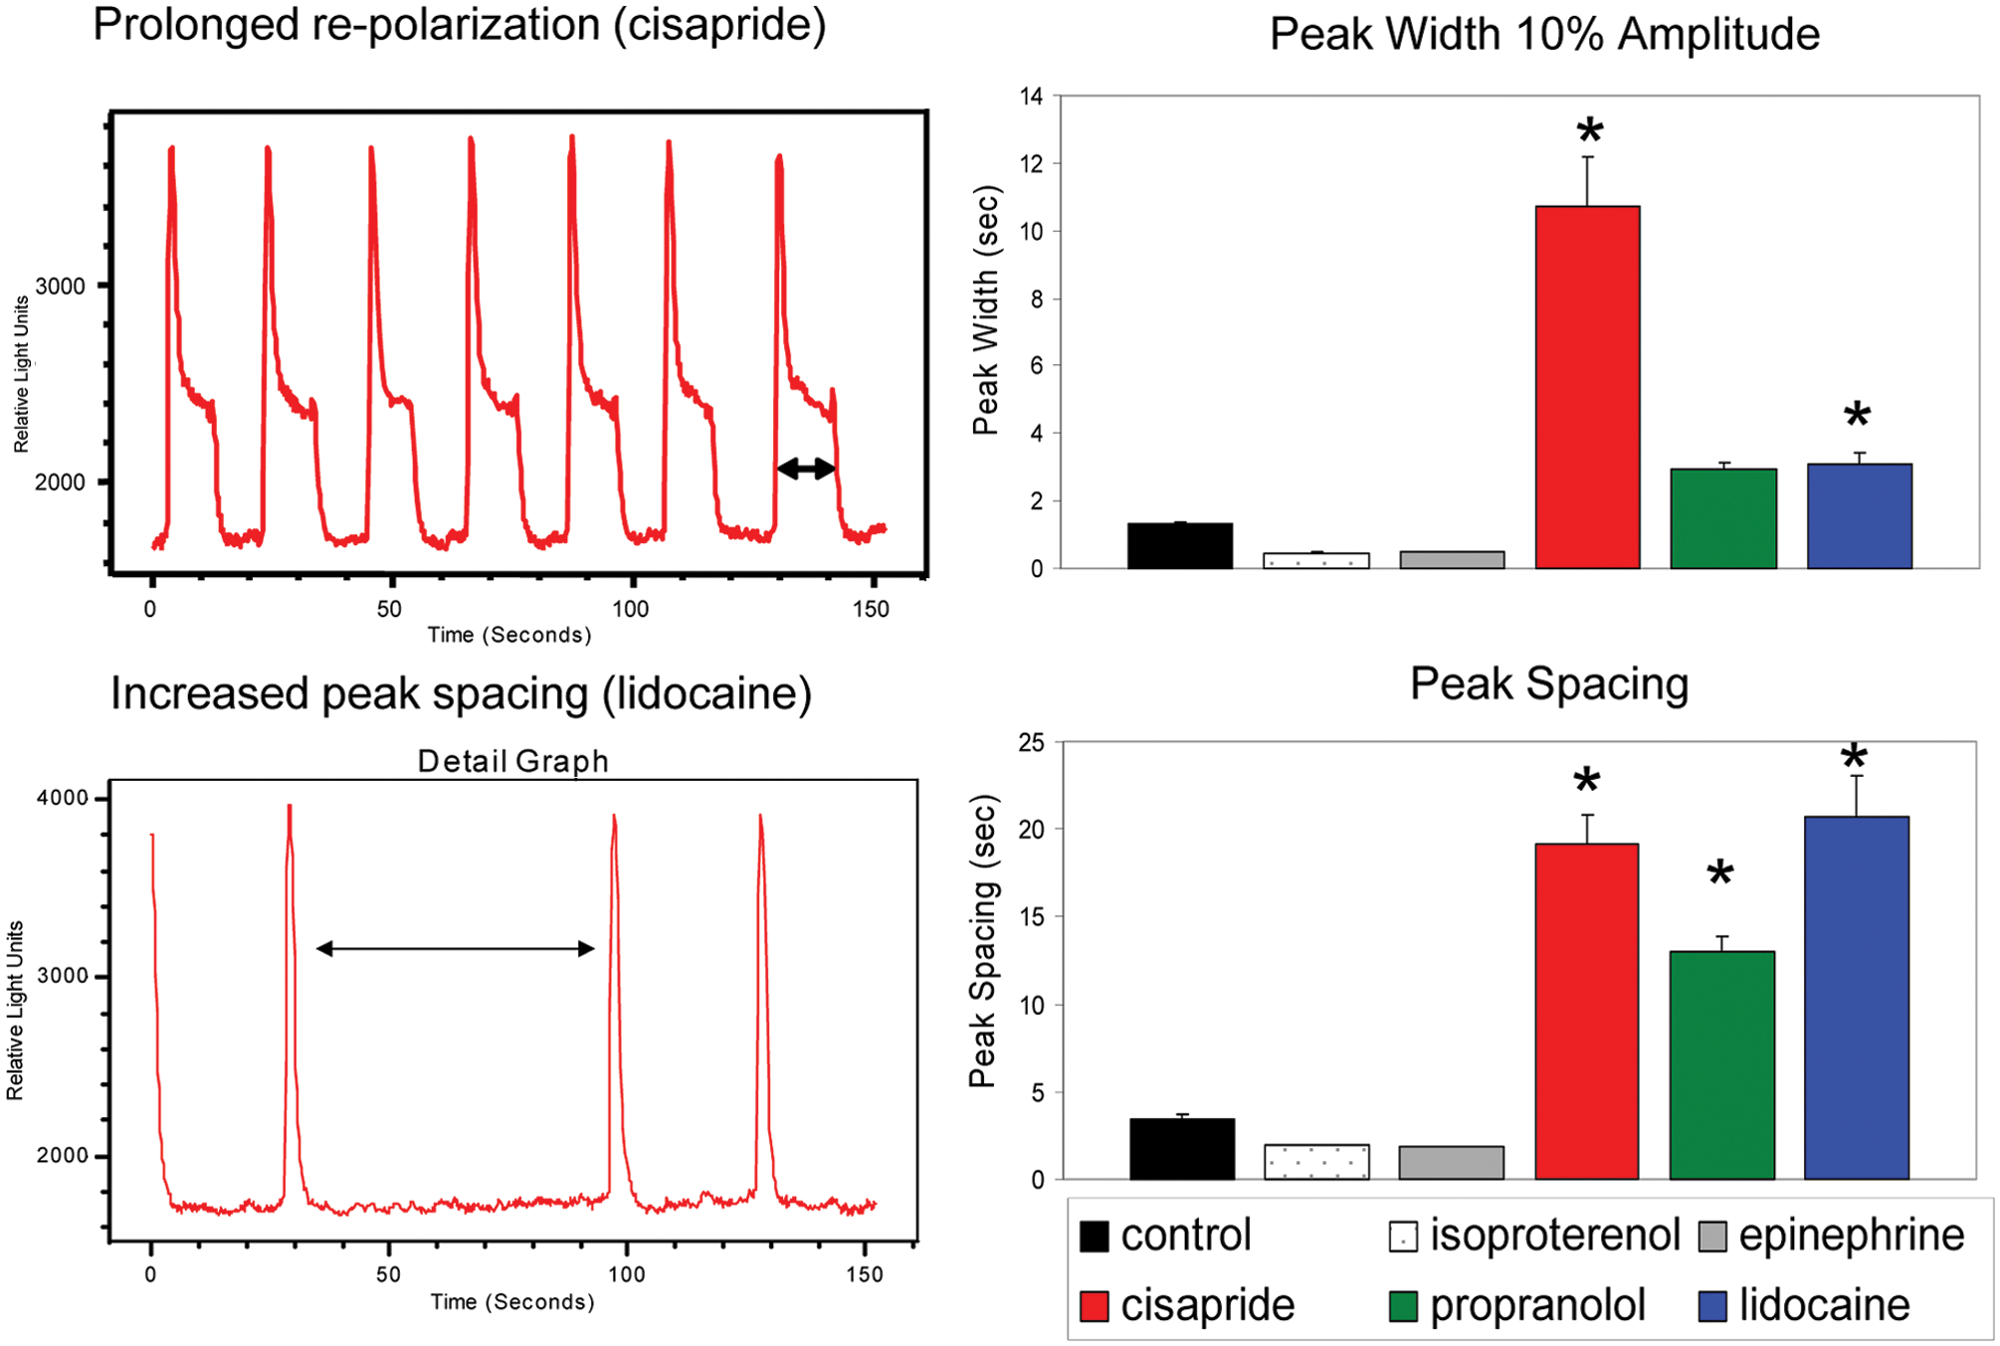
Characteristic behaviors of selected compounds on elongation of repolarization time and time between contractions (peak spacing). Bar graphs represent an average change in peak width at 10% amplitude and peak temporal spacing caused by selected compounds at high dose. Error bars represent ±1 standard deviation of the measurements. Asterisks indicate results that show significant difference from control by one-way analysis of variance test.
Finally, we have compared IC50s obtained using the cardiac beating assay on the FLIPR Tetra system with published data from studies using other cardiac models (
Table 1
). There was a significant rank correlation (rSpearman = 0.57, p = 0.045) of data from this system with the IC50 values from published reports (
Measuring Delayed Effects of Compounds
It is also advantageous to asses longer-term time-dependent effects of compounds that may indirectly effect expression of ion channels (e.g., pentamidine, which effects transport of the hERG channel and therefore has a delayed effect on beating pattern). 28 In this case, continuous recording using label-free methods is an advantage. The FLIPR Tetra system is ideal for assessment of immediate or short-term effects; however, measuring long-term effects would require a modified experimental protocol. Cells need to be pretreated with compounds for the desired length of time (e.g., for 24 h or 48 h) as for typical toxicity studies and then loaded with FLIPR Calcium 5 dye 30 to 60 min prior to read out on the FLIPR Tetra system. We have used this protocol while testing effects of pentamidine 28 and quinidine, 17 two compounds demonstrated previously to have a delayed effect on beating pattern. 19 The contraction patterns were measured 24 h after treatment. Both compounds had inhibitory effects on beating rate with IC50s of 0.5 µM and 0.38 µM, respectively ( Table 1 ).
Cardiac toxicity can be also caused by compounds that are not ion channel inhibitors (e.g., anthracycline drugs, kinase inhibitors, or other factors that may compromise cell metabolic activity or viability). Although those effects can be detected by using traditional viability assays, the cardiac beating assay is also suitable. We have tested effects of doxorubicin and the kinase inhibitors imatinib and staurosporine after 24 h of treatment. We observed expected cell death in 24 h (confirmed by imaging methods) and, accordingly, inhibition of cardiac contractions. IC50s at 24 h were 15 µM (imatinib), 20 µM (doxorubicin), and 3 µM (staurosporine).
Surrogate Markers for Cardiac Safety
The assay allows further beating characterization by measuring the irregularity of peak width, peak spacing, peak rise, and peak decay times and allows characterizing deviations from regular patterns. We have demonstrated a modified beating pattern for several hERG inhibitors, including cisapride, which elongates the repolarization time, reduces beat rate, and causes QT prolongation and arrhythmia in humans. The method allows one to observe an increase of repolarization time for the beat that leads to overlapping beats ( Figures 5 and 7 ). Prolongation of repolarization time can be detected as prolongation of peak width at 10% of amplitude or beat decay time using algorithms of ScreenWorks Peak Pro software ( Figure 7 ). An increase in spacing between peaks was observed after treatment with lidocaine, cisapride, and propranolol ( Figure 7 ). We have also observed shortening of peak width and spacing between peaks accompanied by increased beating rate with the positive chronotropes epinephrine and isoproterenol. Beating irregularities were observed after treatment of cells with lidocaine, astemizole, and a number of other compounds. Irregularities were flagged with software by increased standard deviation of the distance between peaks or by outliers in the distribution of peak spacings.
Discussion
An important cause of drug withdrawals from the market in the past several decades has been cardiotoxicity.29,30 Often, these drugs were associated with a potentially fatal form of ventricular arrhythmia, referred to as Torsades de Pointes (TdP). 31 A significant number of these drugs were terminated in the late preclinical studies where it is very costly. This leads to the need for predictive assays that allow for assessment of potential cardiotoxic side effects of lead compounds early in the drug discovery process. The application of Ca2+ flux measurements to spontaneously contracting cardiomyocytes addresses several critical needs for development of in vitro assays suitable for safety and efficacy testing. Kinetic fluorescence recording is used to monitor cell beating rates and other temporal parameters to assess compound-induced changes in the phenotypic behavior of the cardiomyocytes. The automated data acquisition and analysis methods are well suited for high-throughput environments. The assay precision is also sufficient for screening of compounds and can potentially allow early determination of their suitability for drug development. The ability to measure phenotypic response of human-derived cell models provides a system that shows good initial concordance with clinical data.
A number of limitations of currently employed methods are overcome with this technique. Electrophysiology methods use mammalian cell lines over expressing ion channels, which might not be representative of native human cardiomyocytes. Current systems for impedance-based measurements of contracting cardiomyocytes are lower throughput. 32 In addition, the relationship between changes in impedance and cell biology are not well understood, and potential dielectric properties of compounds can cause changes in impedance that further complicate such measurements. 19
Observation of Ca2+ flux in smooth muscle cell contraction was reported in 1986. 33 Intracellular calcium oscillations associated with spontaneous cardiomyocyte contractions 34 are monitored with Ca2+-sensitive fluorescent dyes. 35 This phenomenon was originally termed calcium sparks because of the fast, transient nature of the response. 36 The Ca2+ fluxes associated with contractions of cardiac cells have been established as physiologically relevant and a predictive indicator of myocardial performance.37–39
iPSC-derived cardiomyocytes recapitulate the expected genomic, biochemical, mechanical, and electrophysiological behaviors of native human cardiomyocytes and are available in large quantities required for high-throughput environments. The assays described here can be set up in 96- or 384-well formats, and extension to 1536-well formats is feasible with optimization of cardiomyocyte cell-plating protocols. The FLIPR Tetra system reads all wells simultaneously, thereby improving the precision of the assay by removing time-dependent well-to-well variation. The read and analysis time is less than 2 min per plate. Automation and on-board liquid handling further increase the flexibility of this platform and provide a system that is amenable to high-throughput screening. Real-time automated analysis of beating rate, EC50 determination for compound effects, and characterizing deviations from typical beating patterns further decreases time to results. The data outputs, which include beat rate, rise and decay times, beat durations, and assessment of irregularities in the beat pattern, provide tools not previously available from other methods.
The assay allows further peak characterization by detection of atypical patterns caused by compounds known to be associated with long QT syndrome (e.g., cisapride and doxazosin) and Na+ channel blockers (e.g., lidocaine). Measuring irregularity of peak width, peak spacing, peak rise, and peak decay times would allow characterizing deviations from a regular pattern and prediction of drugs inducing long QT syndrome, arrhythmia, and other potentially dangerous effects. These approaches are in their infancy; therefore, the relevance of this in vitro phenotype to in vivo disease models is yet to be confirmed. However, characterization of increased repolarization times caused by known blockers of hERG channels is the first step. It is too preliminary to relate these observations directly to the known in vivo patterns such as long QT syndrome or TdP; however, this type of signature (i.e., prolonged peak width and increased peak decay time) might be considered as a potentially predicative pattern for hERG blockers and similar compounds. These data suggest that this assay can be used to assess pharmacologic modulators of ion channels and adrenergic receptors and other targets that effect cardiac contraction.
An important consideration is whether the temporal response of the calcium-sensitive dye signal, or calcium sparks as initially called, 36 is an indicator of myocardial performance and hence can be used for predictive toxicology. Electrophysiology measurements of cellular action potentials (AP) have been accepted in this role. The response times of the various ion channels that contribute to the action potential vary from a few milliseconds for Na+ channels to several hundreds of milliseconds for the Ca2+ and K+ channels. The temporal shape of a cardiomyocyte calcium spark is similar to that of an AP, but there are significant differences to the underlying processes. The AP is an electrochemical response typically measured on a single cell, whereas the calcium spark stems from mechanical movement of intracellular biochemicals and, in the case here, an averaged response over a large population of cells. This means the AP is based on inherently faster responses and does not suffer from effects of synchronicity between cells.
Using fast optical sampling rates (up to 100 Hz), we can observe components of the calcium spark that correspond to the different ion channels on a time scale of the right order of magnitude. The initial rise times, which are attributed to the Na+ channels, are on the order of 100 ms or less. The plateau regions, attributed to Ca2+ and K+ channels, are typically several hundreds of milliseconds. Indeed, elongation of the plateau by K+ channel blockers has been observed to be several seconds. The calcium spark is similar to the AP but more physiologically like a true cardio contraction. There are other dyes and dye systems that can be employed to monitor cardiomyocyte contractions including Di-8-ANEPPS, 40 the Mermaid fluorescence protein FRET system, 41 and DiBAC4(3). 42 The first two dye systems use ratio metric readouts, making the instrumentation and analysis required more complicated. The third dye requires transportation through a cell membrane to become fluorescent. This physical movement limits the response time of the dye. Therefore, it is felt that calcium-sensitive dyes are best suited for high-throughput assays that measure kinetic responses of large cell populations.
It is important to discuss the question of assay predictivity and potential use for assessment of potency or off-target effects of developing cardiac and noncardiac drugs. To date, the assay has shown good concordance with clinical data for drugs with known chronotropic and/or inotropic effects. Of 19 drugs tested, 4 expressed expected positive chronotrope effect, and 14 of 15 known ion channel blockers or receptor antagonists demonstrated expected inhibition of contractile activity. Furthermore, two of four drugs associated with QT interval prolongation were found to have good quantitative agreement between Cmax and IC50 values. Therefore, despite the fact that accurate assessment of assay specificity, sensitivity, and positive and negative predictive values would require a larger number of test compounds to be evaluated, the utility of the assay for detecting known effects on cardiomyocyte physiology is encouraging.
Although the use of stem cell–derived cardiomyocytes for evaluation of pharmacologic effects is relatively novel, there are several recent studies using this model for predictive toxicology.3,19,32,43 These studies, as well as data presented here, show that contraction rates of mESC-derived cardiac cells are clearly affected by many compounds that are known positive or negative chronotropes, ion channel blockers, or hERG blockers. The use of human iPSC-derived cardiomyocytes provides a number of additional advantages. First is that they are human cells. Murine or rat cells are known to have a higher beating rate, different expression levels of ion channels, and in some cases different pharmacologic response. Second, iPSC-derived cardiomyocytes are developed using noninvasive methods, are scalable, and are extensively characterized for developmental stage and expression of important signaling molecules. 6 The limitations of this system include relative immaturity of cells in comparison with primary cells and also more complex techniques for cell maintenance in comparison with more common immortalized cell lines. The well-to-well precision obtained is more than sufficient to support an assay that is suitable for a screening environment.
Further developments are planned for this assay system. It is important to expand the range of compounds assessed to establish this assay’s capabilities and understand any limitations to using this assay for predictive cardiotoxicity. These will include known cardioactive and cardiotoxic drug panels and, specifically, compounds that have not been identified by other techniques as toxic but have been withdrawn from the market. We consider additional optimization of assay protocols necessary to ensure the highest sensitivity and reproducibility of the assay. Extensions of this assay to 1536-well or other smaller-volume formats to improve throughput and decrease the amount of cells and reagents required to perform the assay will remain an active area of pursuit in the near future. There is also a desire to increase the camera acquisition speed to enable faster kinetic measurements and see if it improves the information provided by the assay. This could be important for compounds such as Na+ blockers that have an effect on the contraction rise time. Last, it is important to understand whether this assay can be used to predict mechanism of action. This would expand its usefulness beyond phenotypic drug safety and toxicology assessment to drug discovery and development.
In summary, we describe a method and protocols for monitoring spontaneous contractions of cardiomyocytes that produce highly reproducible results and as such is an excellent assay candidate for primary screening and predictive toxicology. This system is likely to provide the capability to get information about cardiac beating in HTS format, prior to preclinical models or studies in human subjects. The assay overcomes limitations of other cardiac toxicity studies (e.g., electrophysiology screening for potential blockers of the hERG channel). It provides measurements based on a more physiologically relevant cell system that is closer to native human cardiomyocytes. It provides a higher-throughput, automated platform that includes on-board liquid addition; simultaneous, whole-plate read in less than 2 min; and real-time data analysis. It directly measures the cardiomyocyte contractions using a Ca2+ flux, a key component in the contractile process. These attributes make it attractive for screening of drug candidates for cardiac efficacy and other compounds for cardio safety and gives scientists new tools for predicting adverse effects of compounds on myocardial performance.
Footnotes
Declaration of Conflicting Interests
O. Sirenko, C. Crittenden, Y-W. Chen, J. Hesley, and E.F. Cromwell are employed by Molecular Devices, LLC, which sells the ImageXpress Micro and FLIPR Tetra systems. B. Anson is employed by Cellular Dynamics International which sells the iCell Cardiomyocytes.
Funding
The authors received no financial support for the research, authorship, and/or publication of this article.
References
Supplementary Material
Please find the following supplemental material available below.
For Open Access articles published under a Creative Commons License, all supplemental material carries the same license as the article it is associated with.
For non-Open Access articles published, all supplemental material carries a non-exclusive license, and permission requests for re-use of supplemental material or any part of supplemental material shall be sent directly to the copyright owner as specified in the copyright notice associated with the article.