
Abstract
Efficient elucidation of the biological mechanism of action of novel compounds remains a major bottleneck in the drug discovery process. To address this need in the area of oncology, we report the development of a multiparametric high-content screening assay panel at the level of single cells to dramatically accelerate understanding the mechanism of action of cell growth–inhibiting compounds on a large scale. Our approach is based on measuring 10 established end points associated with mitochondrial apoptosis, cell cycle disruption, DNA damage, and cellular morphological changes in the same experiment, across three multiparametric assays. The data from all of the measurements taken together are expected to help increase our current understanding of target protein functions, constrain the list of possible targets for compounds identified using phenotypic screens, and identify off-target effects. We have also developed novel data visualization and phenotypic classification approaches for detailed interpretation of individual compound effects and navigation of large collections of multiparametric cellular responses. We expect this general approach to be valuable for drug discovery across multiple therapeutic areas.
Introduction
Elucidating the relevant biological activities of novel small molecules and biologics remains a formidable challenge in modern drug discovery. This has been found to be true even in the case of individual cells, setting aside the significantly more complex scenario in whole organisms. The scale of the problem has escalated as targeted and phenotypic high-throughput screens continue to yield large numbers of compounds for which the mechanism of action is uncertain or unknown. The value of collecting multiparametric data from single cells on a large scale has been widely recognized as valuable for in-depth interrogation of biological activity.1–3 High-content screening (HCS) based on automated microscopic analysis has been particularly valuable for efficient and objective analysis of multiparametric cellular data on a large scale (defined here as >103 conditions tested per experiment) as it takes into account the structural and functional complexity of intact cells.1–5 A key reason for the success of HCS has been that automated image analysis methods have matured to the point where virtually any microscopically obvious cellular response can be objectively analyzed and quantified. Although multiple large-scale studies6–9 have used HCS effectively to classify compound effects, these studies have had a limited focus on measurements that can be used to make clear interpretations of the underlying biological process to build on our current understanding of cell biology. The mechanistic focus of the highly multiparametric approach described here is expected to address this unmet need for drug discovery in oncology and other therapeutic areas.
In this article, we report development of an approach to accelerate rapid triage of the mechanism of action of compounds that inhibit tumor cell growth in vitro as it is a major focus of drug discovery in oncology. To do this, we have implemented a highly multiplexed assay panel that is designed to detect the major known mechanisms of cell growth inhibition, including mitochondrial apoptosis, cell cycle disruption, DNA damage, and specific cellular morphological changes.10–12 A key criterion imposed on assay design was that each measurement should enable biological interpretation, especially as automated image analysis algorithms can output several distinct measurements from a single image, which can result in the creation of large, unwieldy data sets. Such data sets can often provide a reliable “fingerprint” or “signature” of the action of a particular compound, but they do not necessarily increase our understanding of cellular processes, as the biological significance of some of the measurements can be unclear. We also report the application of new data visualization approaches that facilitate rapid investigation of individual compound effects and the navigation of large sets of multiparametric patterns of cytotoxicity. Finally, the multiparametric cellular responses in the panel described here are analyzed and interpreted in the context of attempting to explain the likely cause of cell growth inhibition.
Materials and Methods
Reagents and Cells
All cell culture reagents and fluorescent indicators were obtained from Invitrogen (Carlsbad, CA) unless otherwise mentioned. MIA PaCa-2 cells were obtained from the American Type Culture Collection (Manassas, VA) and banked in cryovials at low passage. For immunofluorescent labeling, commercially available primary antibodies for cytochrome c, cleaved caspase-3, phospho–histone H2AX (Ser 139), and phospho–histone H3 (Ser 10) were purchased from BD Biosciences (San Jose, CA), Cell Signaling Technology (Danvers, MA), Millipore (Billerica, MA), and Millipore, respectively.
Assay Procedure
MIA PaCa-2 cells (American Type Culture Collection) were grown in Dulbecco’s modified Eagle’s medium supplemented with 1:100 dilutions of the stock solutions of sodium pyruvate, penicillin/streptomycin, nonessential amino acids, and 10% fetal bovine serum (vol/vol). The MIA PaCa-2 cell line was chosen because of its specific oncogenic genotype and its tissue of origin (pancreas). Cells were grown in tissue culture–treated flasks for one passage before plating to ensure full cellular recovery post thawing and passage number consistency for all experiments. Cells were trypsinized using 0.25% trypsin-EDTA, counted using a Countess (Invitrogen) automated viable cell counter, and plated at a density of 1200 cells in 40 µL cell culture medium in Collagen I–coated 384-well microplates (BD Biosciences, NJ) using a Multidrop (Thermo Fisher Scientific, Pittsburgh, PA). Cells were allowed to attach and spread under standard tissue culture conditions (37 °C, 5% CO2, >95% humidity) for 18 h.
All compounds were initially dissolved and serially diluted in DMSO. Compounds were tested in a 7-point concentration-response format using fivefold dilution in replicate plates for each multiparametric assay. Controls (DMSO and reference compounds) were included on each plate in triplicate for data normalization and plate quality control (QC). Immediately before transfer of compound to the cell plate, the compounds were diluted in cell culture medium, and 20 µl of 3x concentrated compounds made up in cell culture medium was transferred to the assay plate using a Biomek FX (Beckman Coulter, Brea, CA). The final concentration of DMSO across the entire assay plate was ≤0.4%. The plate layout showing locations of experimental and reference compounds in 384-well microplates is shown in
The panel of assays described here consists of three distinct multiparametric HCS assays (assays 1, 2, and 3; see Fig. 1 ). Six replicate cell plates (two plates for each assay) were treated simultaneously with compounds and then processed to label cells as required for each multiparametric assay. A standard immunofluorescence protocol was employed for all three assays. Specific modifications to this procedure were made for assays 2 and 3 to enable performance of antibody-independent fluorescent labeling, as described below. After compound treatment, cells were fixed for 10 min at room temperature in 2% ultrapure formaldehyde (PolySciences, Warrington, PA) and washed using an optimized three-cycle wash protocol on a Bio-Tek ELx 405 CW microplate washer (Bio-Tek, Winooski, VT). All subsequent steps were performed at room temperature unless otherwise indicated. The same cell-washing protocol on the microplate washer was used for all washing steps in all three assays. All steps through cell fixation were done without any fluid exchanges to minimize cell loss and preserve cell morphology. For cell fixation and all subsequent steps, reagents were dissolved in Ca2+/Mg2+-free phosphate-buffered saline (PBS), pH 7.4. Fixed cells were permeabilized using 0.1% Triton X-100 (Sigma, St. Louis, MO) for 10 min for assays 1 and 3, whereas 0.5% Triton X-100 was used for assay 2. After a wash step, blocking of nonspecific antibody-sample interactions was performed using 1% bovine serum albumin (BSA) for 30 min. All primary and secondary antibody working solutions contained 0.3% BSA. Primary antibodies were incubated with fixed cells at 4 °C overnight. Cells were subsequently washed and incubated with a 1:200 dilution of fluorescently labeled secondary antibodies (Alexa Fluor 488 goat antimouse IgG and/or Alexa Fluor 594 goat antirabbit IgG) containing 2.5 µg/mL Hoechst 33342 and 0.3% BSA and incubated for 1 h in the dark. After a final washing step, the microplate was ready for scanning.
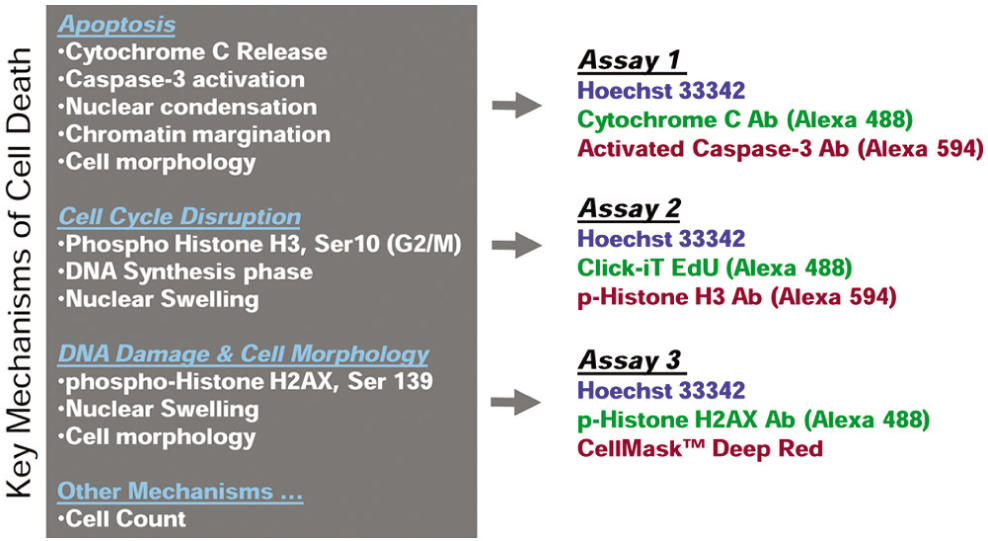
Assay panel design to span major cell death mechanisms. Key measurements spanning major cell death mechanisms (left) and corresponding reagents within the three-component assays are shown. Apoptosis is primarily monitored using assay 1, cell cycle perturbation using assay 2, and DNA damage and cellular morphology in assay 3. Ab, antibody.
For assay 1, mouse anti–cytochrome c and rabbit antiactivated caspase-3 (Asp175) antibodies were used at 1:100 dilutions of the stock solution received from the manufacturer. Antibody distribution was imaged using goat antimouse Alexa 488 and goat antirabbit Alexa 594 conjugated antibodies, respectively. In assay 2, the rabbit antiphosphorylated histone H3 antibody was used to label mitotic cells using a 1:2000 dilution and imaged using a goat antirabbit Alexa 594 conjugated secondary antibody. To label cells undergoing DNA replication in S-phase, an EdU incorporation assay employing Click-iT chemistry (Invitrogen) was employed. EdU incorporation and detection using Alexa Fluor 488 was performed according to the manufacturer’s recommended procedure. The Alexa 488 conjugation reaction was performed before all immunofluorescence labeling steps required for labeling phosphorylated histone H3. In assay 3, mouse antiphosphorylated histone H2AX antibody was used at 1:800 dilution and imaged using Alexa Fluor 488 goat antirabbit IgG. To label the cytoplasmic volume, we used a whole-cell marker, CellMask Deep Red. This labeling step was performed by incubating with 1 µg/mL CellMask Deep Red for 30 min after all immunofluorescence steps required for phosphorylated histone H2AX were completed.
Automated Imaging and Image Analysis
Microplates were scanned on an ArrayScan VTI HCS Reader (Thermo Fisher Scientific) with an EXFO X-Cite 120 light source, Hamamatsu Orca ER cooled CCD camera, and 1x coupler installed. All measurements with the exception of cell count were made based on 512 × 512 pixel images (binned 2 × 2) acquired using a 10x (0.3 N.A.) objective. Exposure times were determined by reaching fixed image saturation targets for each fluorophore while imaging cells in specific reference wells (containing either vehicle or a specific control compound). Images acquired for assays 1 and 3 were analyzed using the Cell Health Profiling BioApplication (V3) algorithm. The Target Activation BioApplication (V3) algorithm was used for assay 2. The specific algorithmic outputs used for each measurement are shown in
Table 1
. The Cell Health Profiling algorithm was used to measure all nuclear morphology changes, brightness associated with punctate mitochondria (cytochrome c), whole-cell area (CellMask Deep Red), and integrated pixel brightness from the whole cell after applying a fixed brightness threshold (activated caspase-3). Histone H3 phosphorylation, histone H2AX phosphorylation, and S-phase progression were measured as the average pixel brightness (unthresholded) in the nuclear region.
Statistical Performance of Component Assays of the Panel
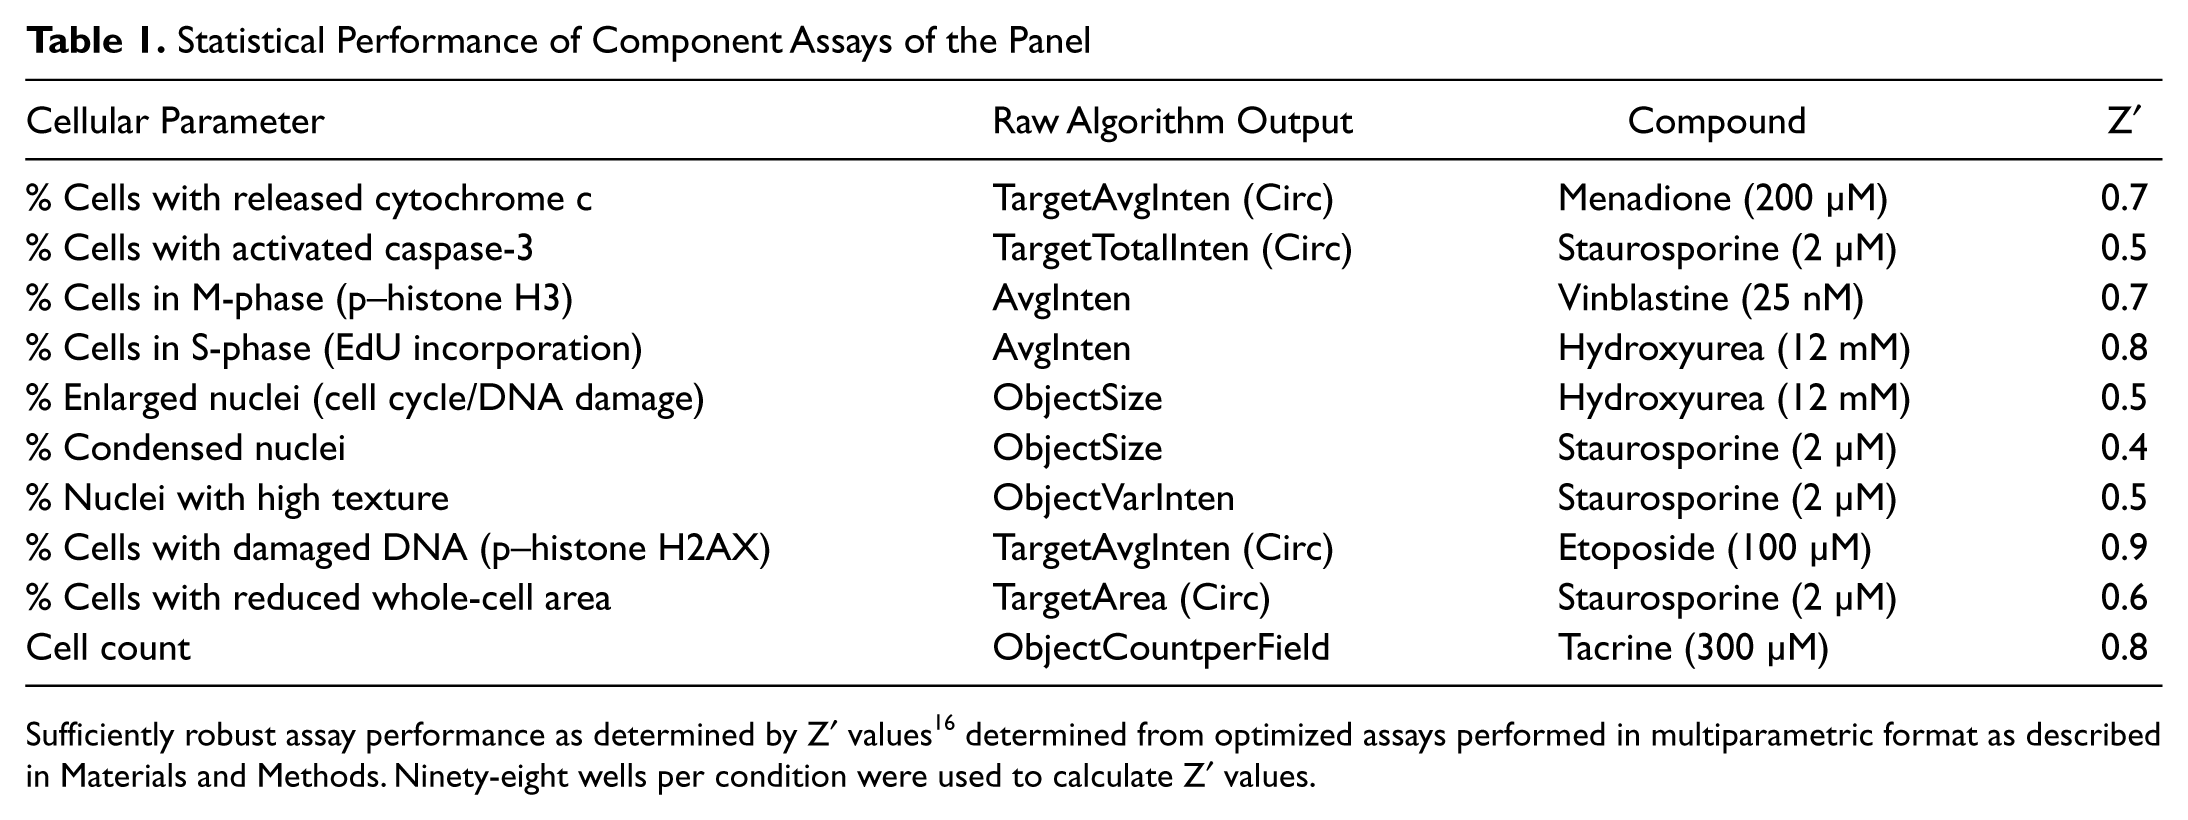
Sufficiently robust assay performance as determined by Z′ values 16 determined from optimized assays performed in multiparametric format as described in Materials and Methods. Ninety-eight wells per condition were used to calculate Z′ values.
Processing and Analysis of HCS Data
Plate QC was performed by ensuring that the assay, using reference compounds, showed similar robustness to that described in
Table 1
. Changes in cell count (which may arise from growth inhibition or loss of adhesion) were reported as the difference in % inhibition relative to vehicle control. All remaining cellular parameters measured (
Fig. 1
) were quantified as the percentage of responding cells. The absolute values of each raw measurement used to separate responding cells from nonresponding cells were set based on analysis of distributions of measurement values associated with cells treated with vehicle (DMSO) versus the reference compound for that measurement. Specifically, we required a Z′ of at least 0.4 using the set threshold value that defines a responding cell for a given parameter. We also used visual examination of the images to verify that the determined threshold truly identified responding cells. This had to be done because a mere morphological change such as cell rounding can result in a statistically significant change due to an increase in cellular path length, but it is likely unrelated to an actual change in the intended measurement (e.g., caspase-3 activation). The modified threshold had to satisfy the Z′ ≥ 0.4 criteria. Once the threshold was set, it did not have to be adjusted between experiments provided the target camera saturation was achieved for that fluorophore. Although the approach of including visual examination adds some subjectivity to the approach, it is important that the threshold value is not changed between experiments. The setting of the thresholds for assays 1 to 3 is illustrated in
Alternative approaches, such as the use of the mean raw value for each measurement per cell and the Kolmogorov-Smirnov (KS) statistic, were also considered. Using the mean raw value was found to be the least sensitive. The KS statistic was found to be too sensitive as even replicate vehicle-treated wells were routinely found to be significantly different from each other (p-values <0.05). The KS statistic also does not provide a clear indication of the nature of the change (increase or decrease in raw values). Quantitation of % responding cells was used as it provided a balance between sensitivity and clear interpretation. In addition, the % responding cell data for all measurements could be plotted on the same plot as the scale is identical for all parameters, thus enabling significantly easier overlaying and interpretation of the data.
The data were integrated with compound location and concentration maps using a protocol in Pipeline Pilot software using standard pipeline components (Accelrys, San Diego, CA). The protocol was configured to output the mean difference in the percentage of responding cells relative to vehicle (DMSO)–treated wells from replicate plates for each measurement. The protocol used also calculates the mean and standard deviation for every measurement across replicate plates and the median and standard deviation observed for each measurement across all plates run in that experiment. These were used to assign a p-value for each cellular measurement at every concentration to indicate the probability of being significantly different from vehicle-treated cells. The decision was made not to calculate IC50 data based on confirmation of the well-established observation that concentration-response data in cytotoxicity assays are often difficult to model using a sigmoidal curve fit. 13 The output of the Pipeline Pilot protocol was automatically exported to and visualized using Spotfire® Decision Site (TIBCO, Somerville, MA) as a scatterplot.
A second Pipeline Pilot protocol was configured to take all the concentration-response data used to generate scatterplots described above and cluster compounds based on similarity of phenotypic response across all measured cell health parameters. Both the p-value assigned to each measurement value at each concentration and the direction of change (increase or decrease in % responding cells) were used to phenotypically cluster cellular responses with the greatest sensitivity. The direction of the change in the cell population is especially important as the p-value only reports the occurrence of a statistically significant change, which could be very similar for compounds that have opposite effects on a given cellular parameter. For example, without the direction of change accounted for in the clustering approach, Aurora kinase inhibitors and mitotic blockers would not be as readily differentiated even though the former class of compounds decreases the cellular mitotic index, whereas the latter increases it. All data manipulations with the exception of phenotypic clustering were performed in Pipeline Pilot. Clustering was performed in Spotfire and used the unweighted Euclidean distance calculated using all cellular measurements described in Figure 1 with the exception of cell count. Phenotypic clustering employed only three of the seven concentrations analyzed for each compound. The three concentrations were centered on the lowest concentration at which the cell count measurement showed a median p-value of 0.01 across assays 1 to 3. This was done to ensure that clustering was focused on the targeted end points most likely to explain cell growth inhibition, as opposed to cellular responses observed at concentrations much higher than that needed to affect cell growth inhibition. If the drop in cell count did not reach the p = 0.01 threshold, the data from the highest three concentrations tested was used for clustering. Clustering that used the data from the entire concentration range tested was found to result in a greater rate of failure of clustering as judged by the number of compounds that yielded similar scatterplots not clustering together. Clustering using the entire range of concentrations tested for a compound was also found to be arbitrarily sensitive to the exact concentration range of that compound tested (data not shown).
Results
The measurements and detection approaches associated with our panel of multiparametric HCS assays are shown in
Figure 1
and
The performance of the assay panel for treatment of MIA PaCa-2 cells for 24 h with reference agents is shown in terms of Z′ values 16 in Table 1 . All measurements with the exception of cell count are reported as a percentage of responding cells to allow easy data visualization and interpretation. Table 1 shows that each measurement can be made with sufficient robustness for concentration-response testing of compounds (Z′ ≥ 0.4). Figure 2 shows pseudocolor images from each of the three assays for a subset of reference compounds used to validate the assays. Menadione, a strong oxidative stress inducer, effectively induces mitochondrial cytochrome c release at high concentrations. The microtubule stabilizer vinblastine causes G2/M arrest and is readily detected using assay 2, and the topoisomerase II inhibitor etoposide induces double-strand breaks in DNA, triggering the phosphorylation of histone H2AX.
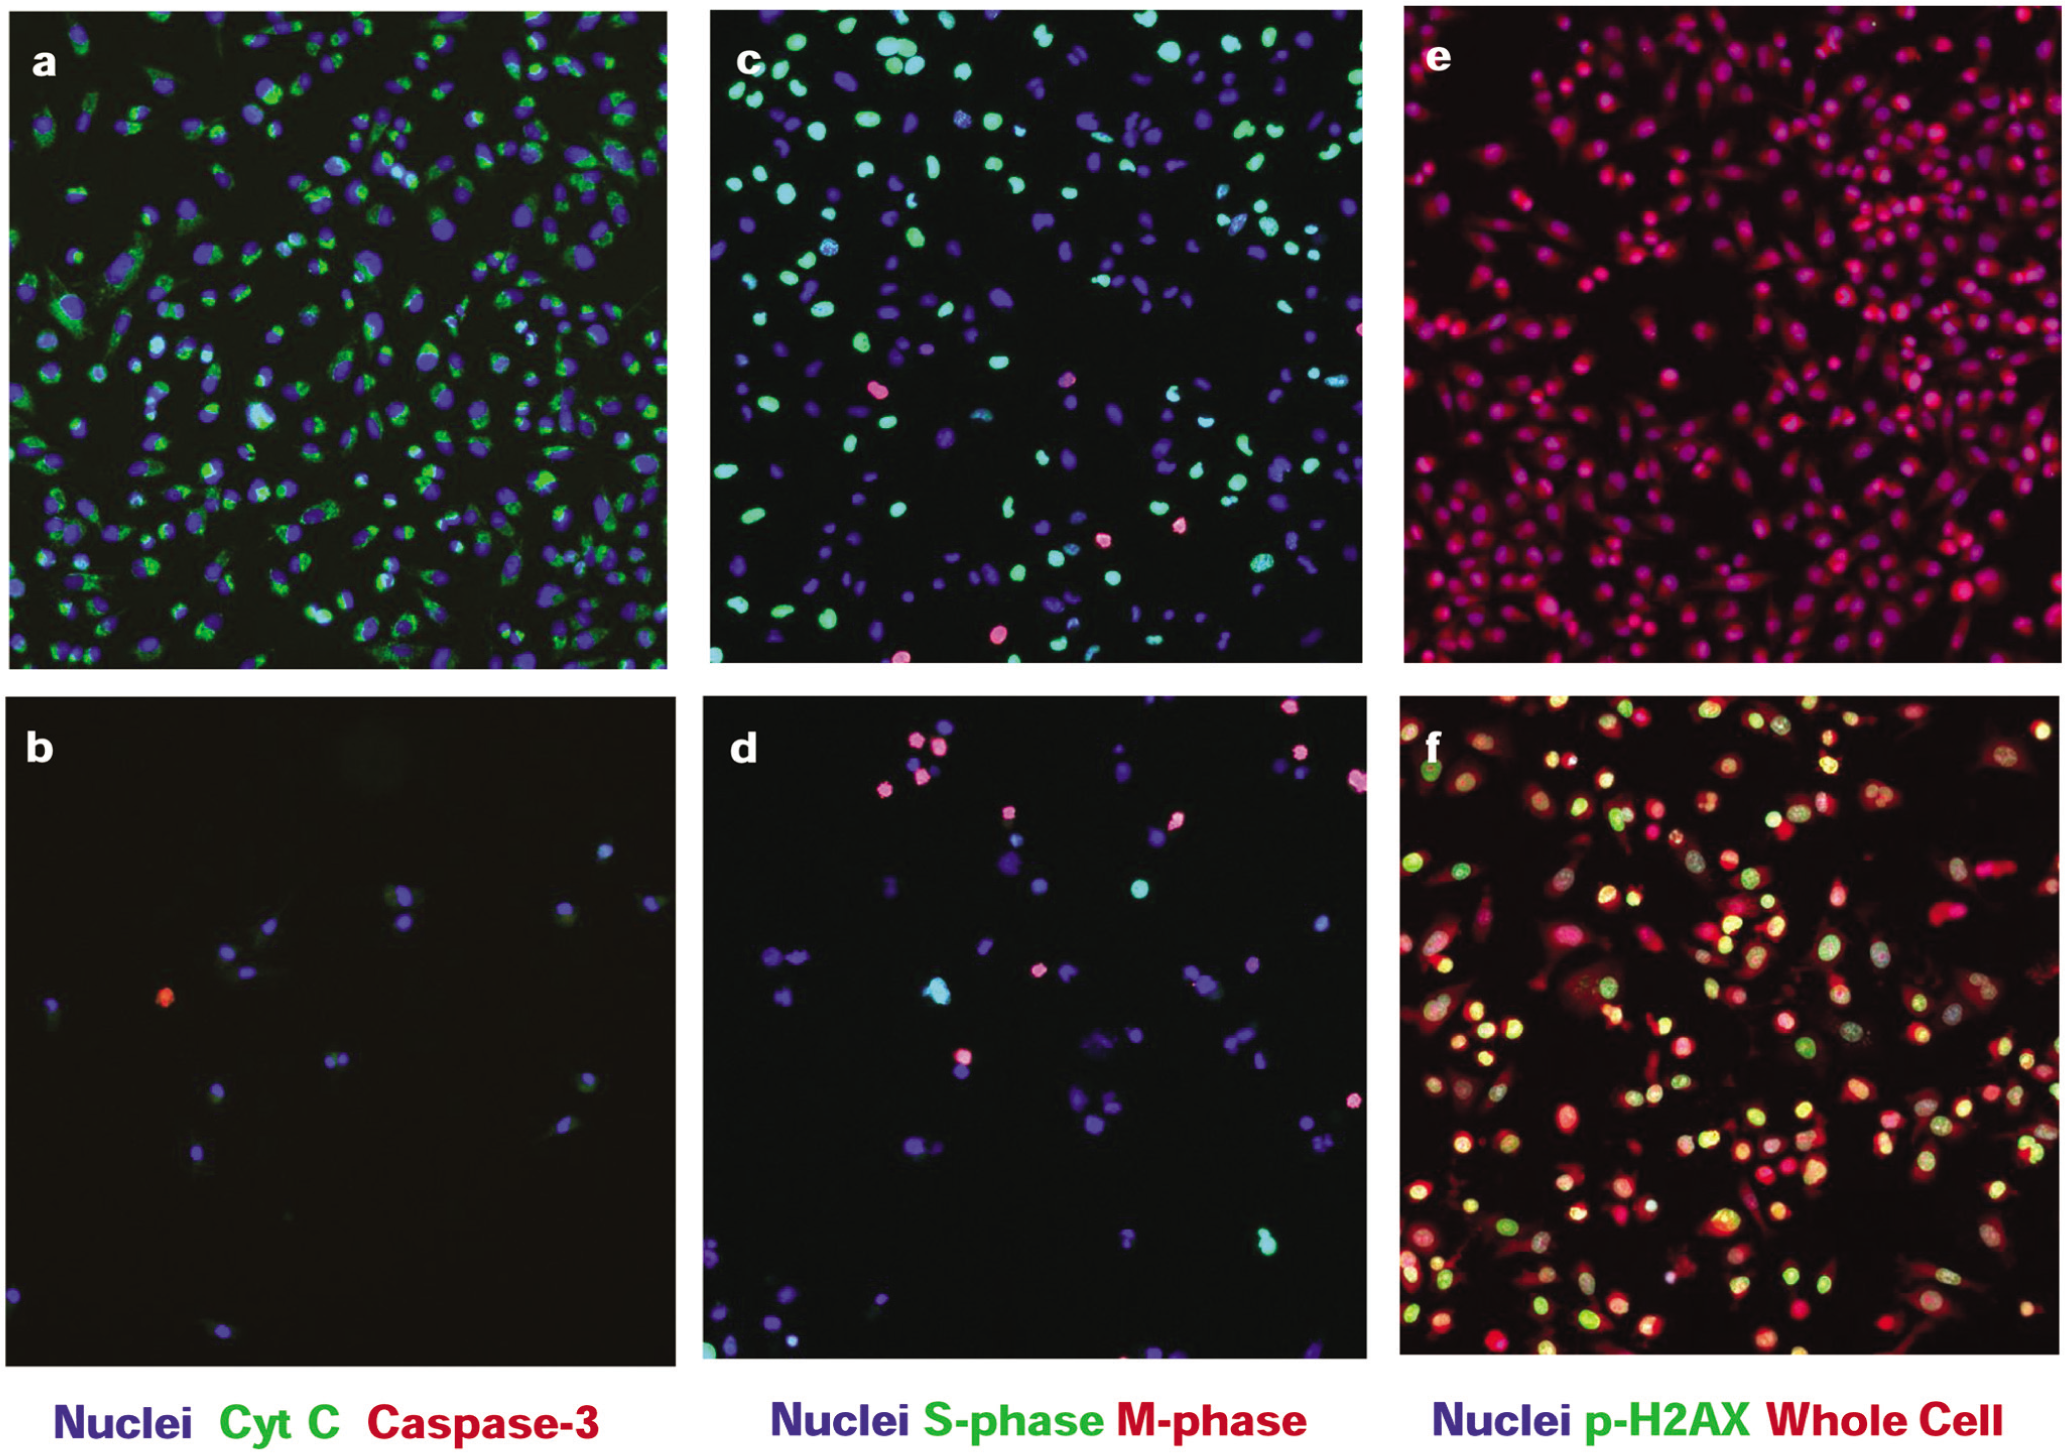
Representative images for key reference compounds. Pseudocolor images of MIA PaCa-2 cells are shown from assay 1 (
The measurement of cell proliferation is made across all three assays (see Materials and Methods) as a quality control step for reproducibility across assays 1 to 3. It also serves as an orthogonal assay to confirm cell growth inhibition, which is typically determined at an earlier stage in the screening funnel using a higher throughput homogeneous assay format based on measurement of total DNA/ATP content. We have additionally confirmed that a strong correlation exists between the measurements of nuclear area across assays 1 to 3 (data not shown).
The concentration-dependent responses of selected compounds across all measured parameters are shown in Figure 3 . Each plot shows the difference in the percentage of responding cells relative to the vehicle (% responding cells for treatment – % responding cells for vehicle). This is true for all parameters except cell count, for which the difference in % inhibition relative to vehicle treatment plotted as % responding cells is not meaningful. We find this to be a powerful visualization approach as (1) all the data can be presented in an easily interpretable way on a single plot, and (2) one only needs to focus on which curves show a deviation from the 0% level, indicating a change relative to vehicle treatment. It should be noted that the absence of difference in % responding cells relative to control does not indicate that there were no responding cells at that concentration—it only indicates the lack of change in the % responding cells relative to that observed with vehicle. The specific nature of the change in terms of increased or decreased percentage of cells showing a response is also captured. As mentioned previously, the measurement of cell count per field in each of the three assays serves as a data quality monitor to confirm that the data from all cellular measurements can be correlated across multiple end points. Our interpretation of results is focused on which of the other nine measurements provide a possible explanation for the mechanism of inhibition of cell proliferation by virtue of showing a significant change in the concentration range where cell growth begins to be inhibited. It is recognized that some novel mechanisms of cell growth inhibition may not show any responses in any of the measured parameters with the exception of the cell count measurement.
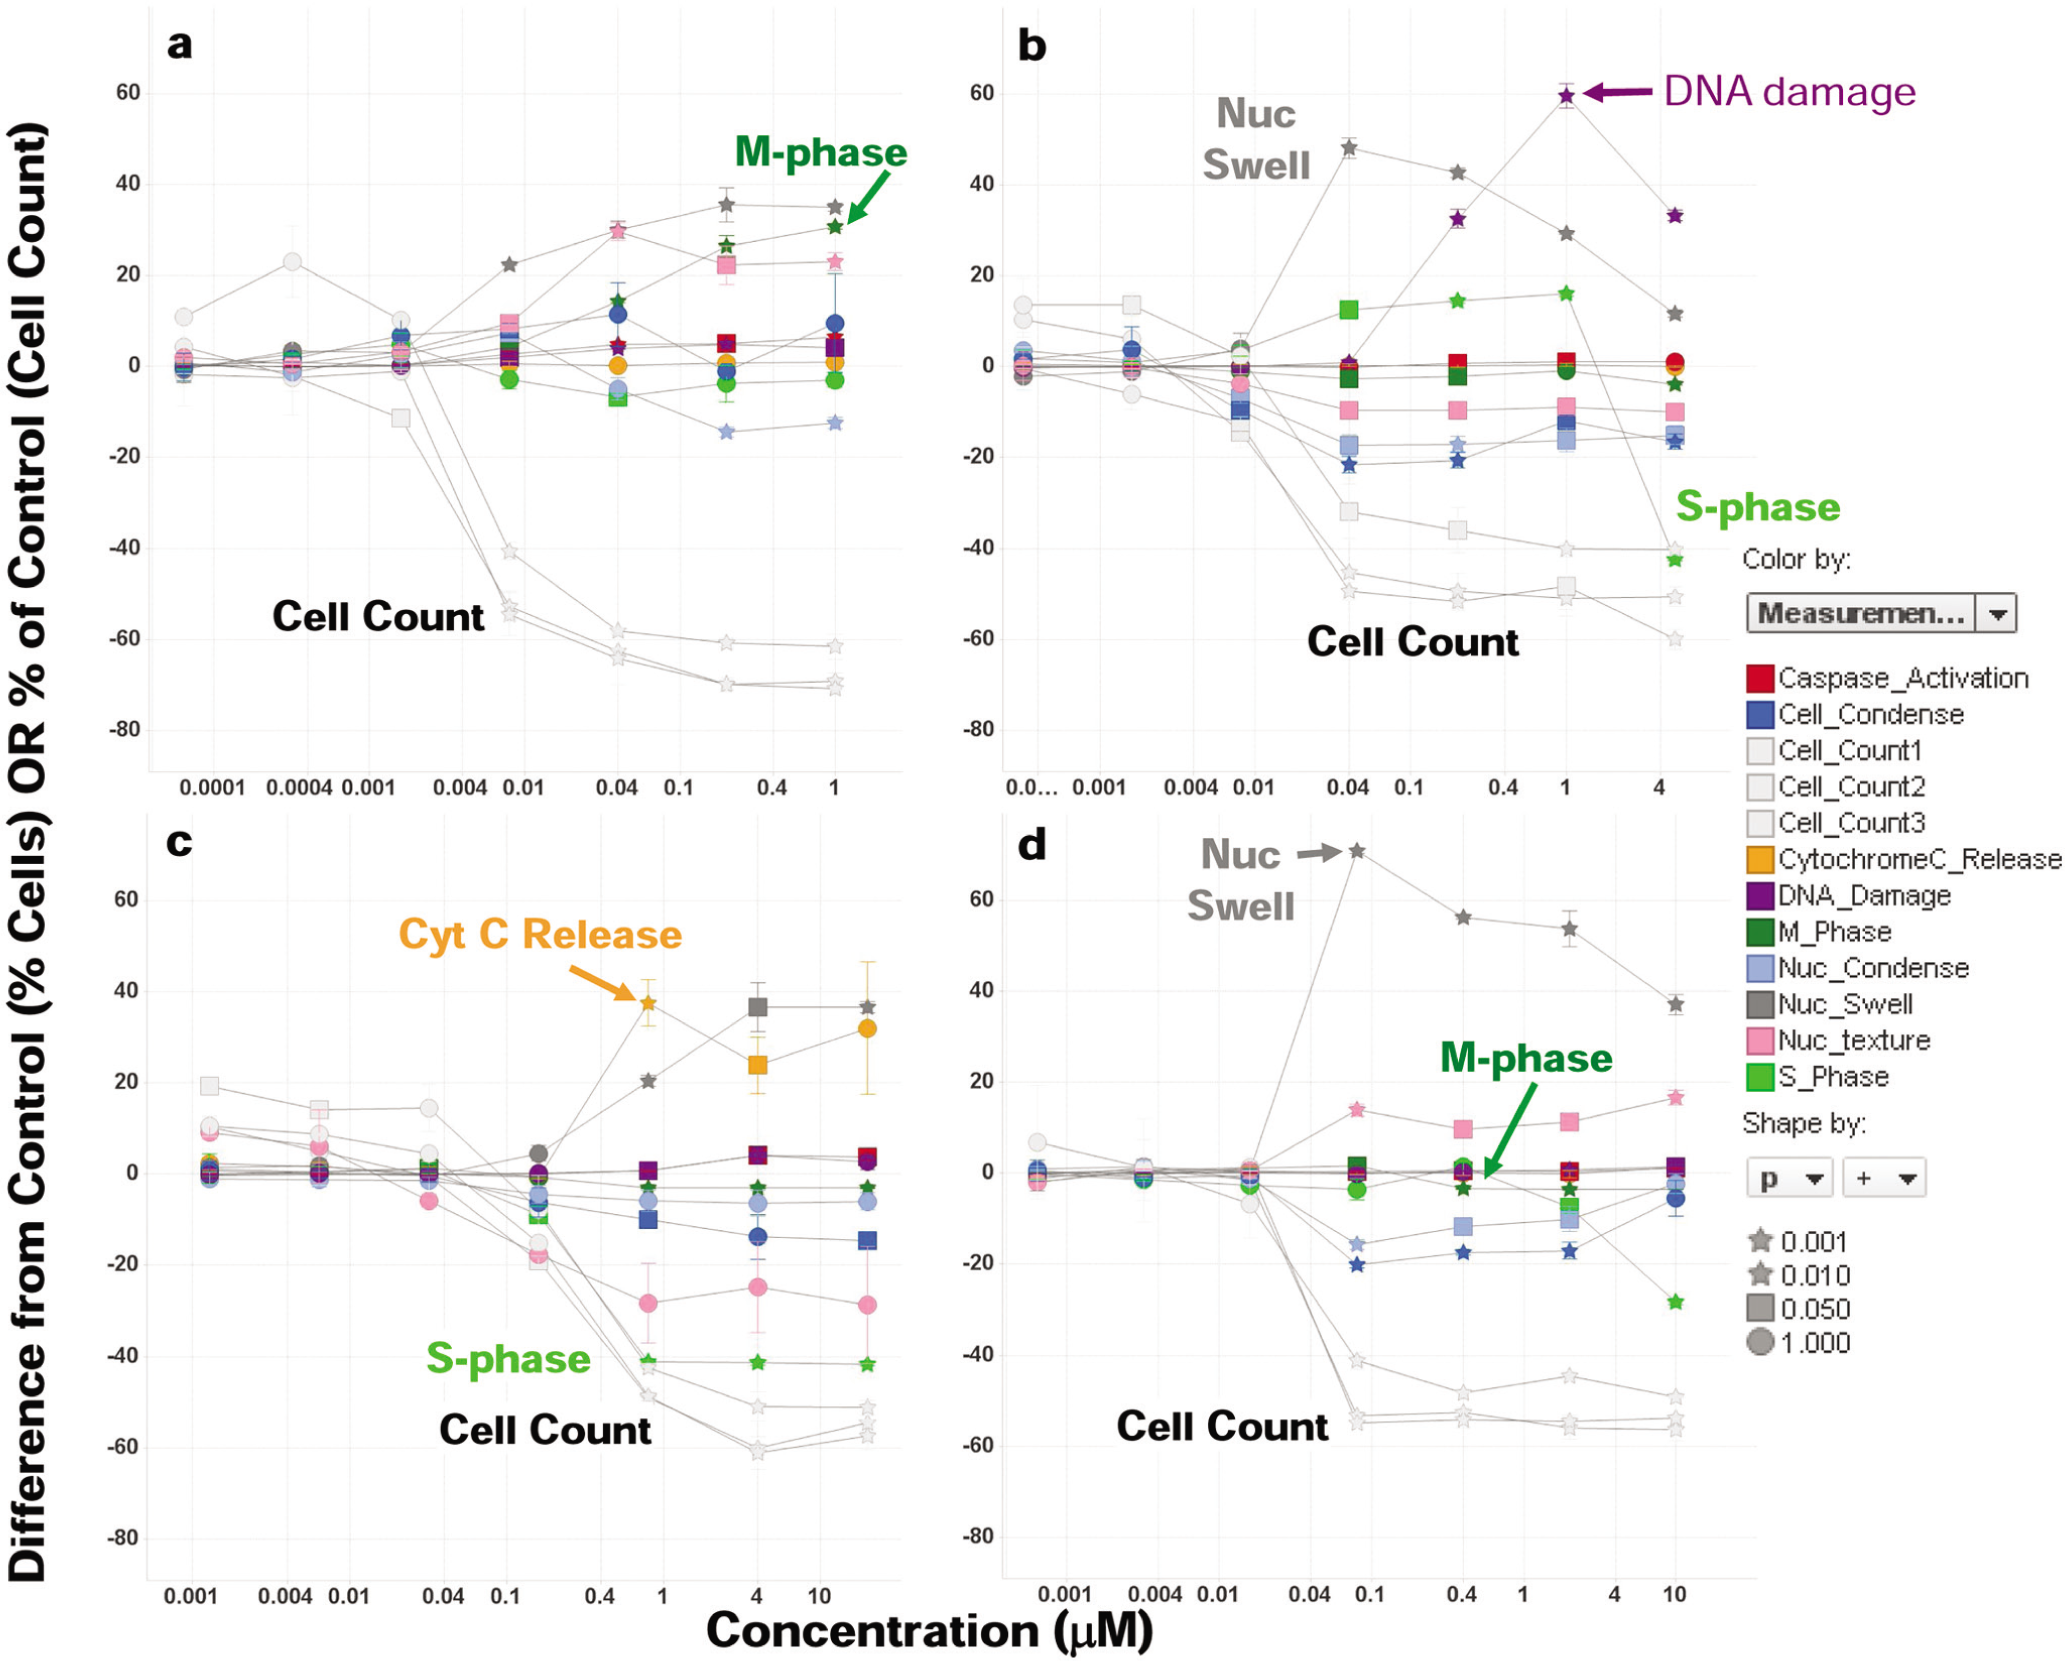
Patterns of cell death induced by reference compounds. Scatterplots showing concentration-response data upon 24-h treatment across all measured parameters are shown for each compound. The key responses expected from each compound are highlighted (arrows). (
The distinct responses of a selection of well-characterized reference compounds are shown in Figure 3 to demonstrate the ability of the assay panel to detect changes induced by compounds known to act via diverse mechanisms. Paclitaxel causes a rise in the percentage of cells in M-phase, as well as cells with elevated nuclear texture as expected. 17 Camptothecin, a topoisomerase I inhibitor, inflicts DNA damage 18 as indicated by histone H2AX phosphorylation and S-phase inhibition. Flavopiridol, a CDK kinase inhibitor, is thought to induce cell death at least in part by causing cytochrome c release from mitochondria by depleting antiapoptotic factors of the Bcl-2 protein family.19–21 Interestingly, flavopiridol also induces a simultaneous drop in S-phase cells. Note that vehicle-treated cells typically show ~40% cells in S-phase, so a negative deviation of 40% indicates complete S-phase inhibition. Last, the Aurora kinase inhibitor VX-680 induces polyploidy, detected as a dramatic increase in nuclear size, and a drop in the percentage of cells in M-phase as measured by phosphorylation of the Aurora B substrate histone H3.22,23 A drop in the percentage of mitotic cells from approximately 4% to 0%, although being a small change, can be measured reliably as the scatterplot also indicates a p-value of ≤0.01. An increase in the percentage of cells with enlarged nuclei is a phenotype induced by all four compounds. This is consistent with the previously mentioned observation that nuclear swelling is often caused by compounds that cause cell cycle inhibition and/or DNA damage. Note that the primary expected responses for each of these compounds (M-phase arrest, paclitaxel; DNA damage, camptothecin; cytochrome c release, flavopiridol; polyploidy/nuclear swelling accompanied by a drop in cells in M-phase, VX-680) were observed at concentrations similar to the concentration at which the drop in cell count became highly significant (p ≤ 0.01).
It should be emphasized that
Figure 1
is an oversimplification of the major cell growth inhibitory mechanisms as experimental compounds could easily trigger events across all three multiparametric assays, especially if compound polypharmacology is involved in the mechanism of action of the compound. Even a compound that is highly specific for its target could easily mediate changes that span the different general mechanisms shown. For example, etoposide causes DNA damage, which results in inhibition of progress through S-phase, and flavopiridol induces both S-phase inhibition and cytochrome c release from mitochondria (see
Although compound treatment for 24 h was used for most of the experiments described here, further investigation of the kinetics of compound effects is expected to provide considerable additional value. Such studies can be used to dissect mechanism of action of single compounds or further differentiate mechanisms of different compounds. This is illustrated through the dissection of the effects of three well-characterized S-phase-inhibiting compounds: hydroxyurea, etoposide, and camptothecin ( Fig. 4 ). Although all three compounds inhibit S-phase progression (arrowheads in Fig. 4a – f ) and affect double-stranded DNA damage, the effects of hydroxyurea can be readily identified as different from that induced by camptothecin and etoposide as the S-phase inhibition effected at 8 h clearly occurs at lower concentrations than the onset of DNA damage, suggesting that DNA damage is not the likely cause of S-phase inhibition. In contrast, camptothecin and etoposide show the onset of S-phase inhibition and DNA damage at similar concentrations after 8 h. Both compounds are known to act by inducing DNA breakage via topoisomerase inhibition. However, hydroxyurea is known to act by reducing the pools of reduced nucleotides available for DNA replication and is expected to cause DNA damage after stalling of replication forks, 24 as is seen at the 16-h time point. All three structurally distinct compounds induced a statistically significant increase in the percentage of S-phase cells at low concentrations (see asterisks in Fig. 4 ), presumably due to S-phase elongation at low concentrations. 25
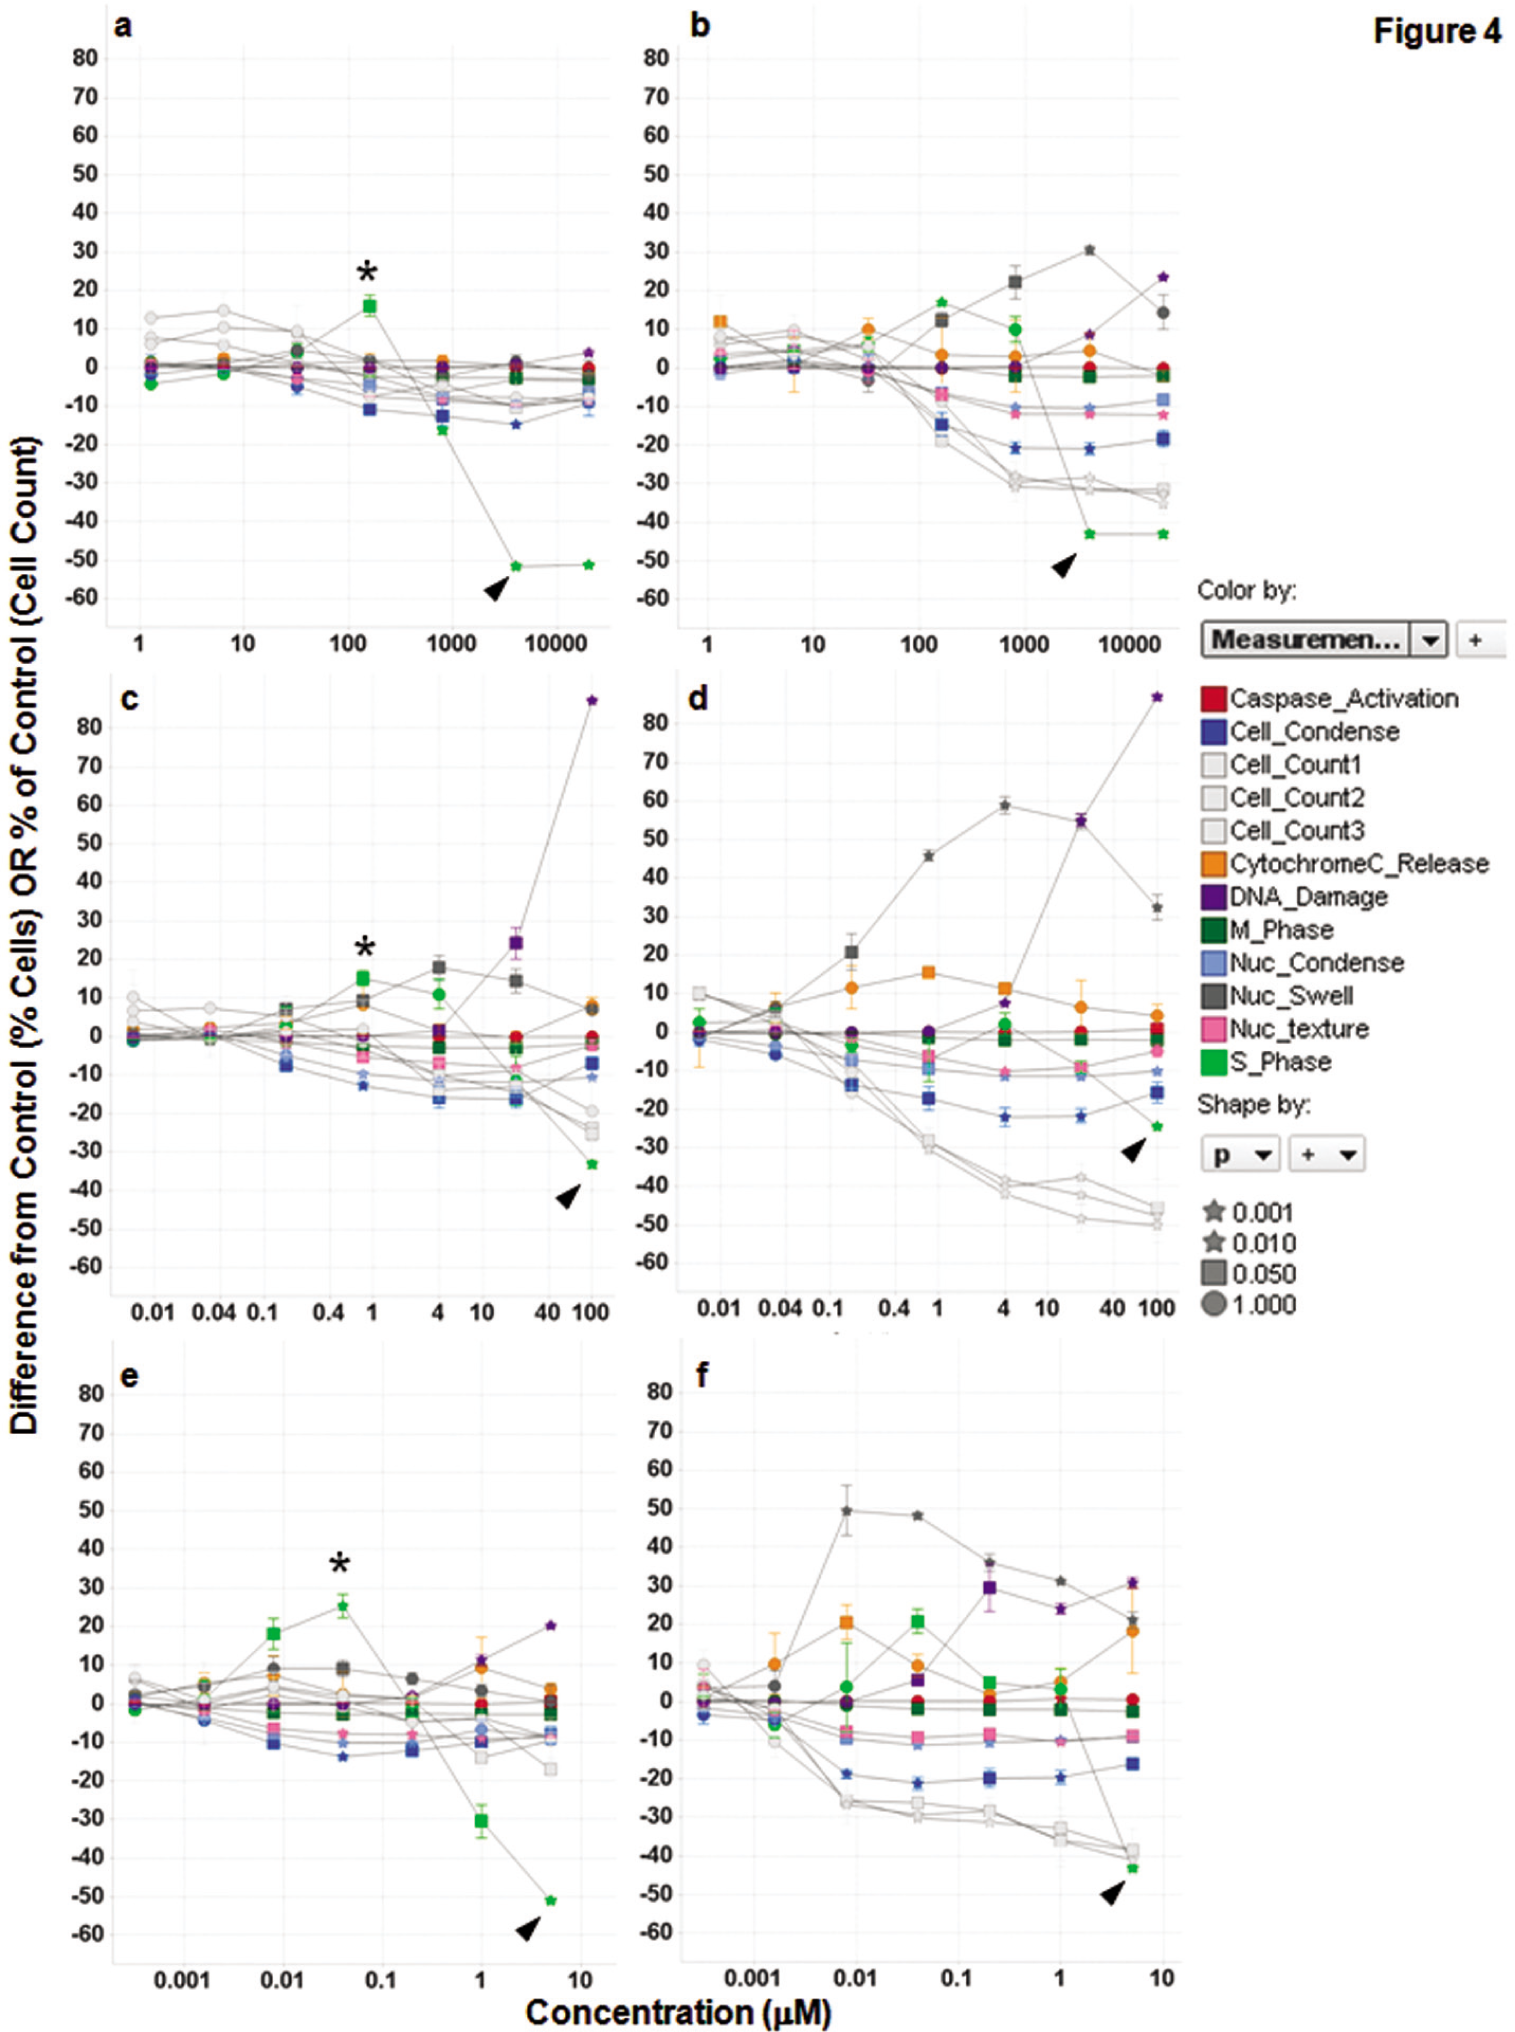
Kinetics of MIA PaCa-2 cell responses to treatment with S-phase inhibitors. (
To complement the methods developed to enable rapid interpretation of concentration-response data for single compounds, it is also essential to have an approach to navigate large data sets comprising several patterns of cell death. We anticipate this to be valuable (1) to evaluate whether multiple chemotypes targeting the same protein show similar patterns of cell death and (2) to investigate mechanisms of action of novel compounds for which cell growth inhibition is not understood. We implemented a clustering approach that takes into account the strength of the p-value and the direction of change (increase or decrease in percentage of cells) for every cellular measurement, at every concentration ( Fig. 5 ). We focused on the concentration at which the median p-value is ≤0.01 across replicate measurements of cell count across assays 1, 2, and 3. Compounds were clustered as described in Materials and Methods using the multiparametric cellular response at this concentration and the next higher and next lower concentrations tested. The clustering approach was designed as such to focus on the pathways most potently impacted by the compound to effect growth inhibition, eliminating effects induced at much higher concentrations that may not be therapeutically relevant due to lack of compound specificity. This approach also makes phenotypic clustering of compounds independent of their potencies. Thus, the concentrations across the heatmap columns in Figure 5 are shown as indices instead of absolute concentrations as the absolute concentration range may not be the same for each compound. Figure 5a shows the results of applying this clustering approach to a set of 308 experimental and reference antitumor compounds profiled thus far across five experiments in MIA PaCa-2 cells. These compounds span a wide range of targets and expected mechanisms of cell growth inhibition described in Figure 1 . Figure 5b highlights a subset of the compound profiles shown in Figure 5a . Examples of compounds that have similar mechanisms of action include antimitotics (the PLK inhibitor BI-2536 and the microtubule poisons paclitaxel, vinblastine, and nocodazole). Immediately adjacent to these compounds, we also found 24 additional M-phase inhibitors that were structurally similar to known tubulin-binding compounds, which is consistent with the cellular phenotype (data not shown). Also shown is a cluster of Aurora kinase inhibitors (MLNM-8054, experimental Aurora kinase inhibitor 1, VX-680, and AZD1152). In this instance, at least five additional experimental compounds in the immediate vicinity of this group were found to be Aurora inhibitors based on enzymatic activity assays (data not shown).
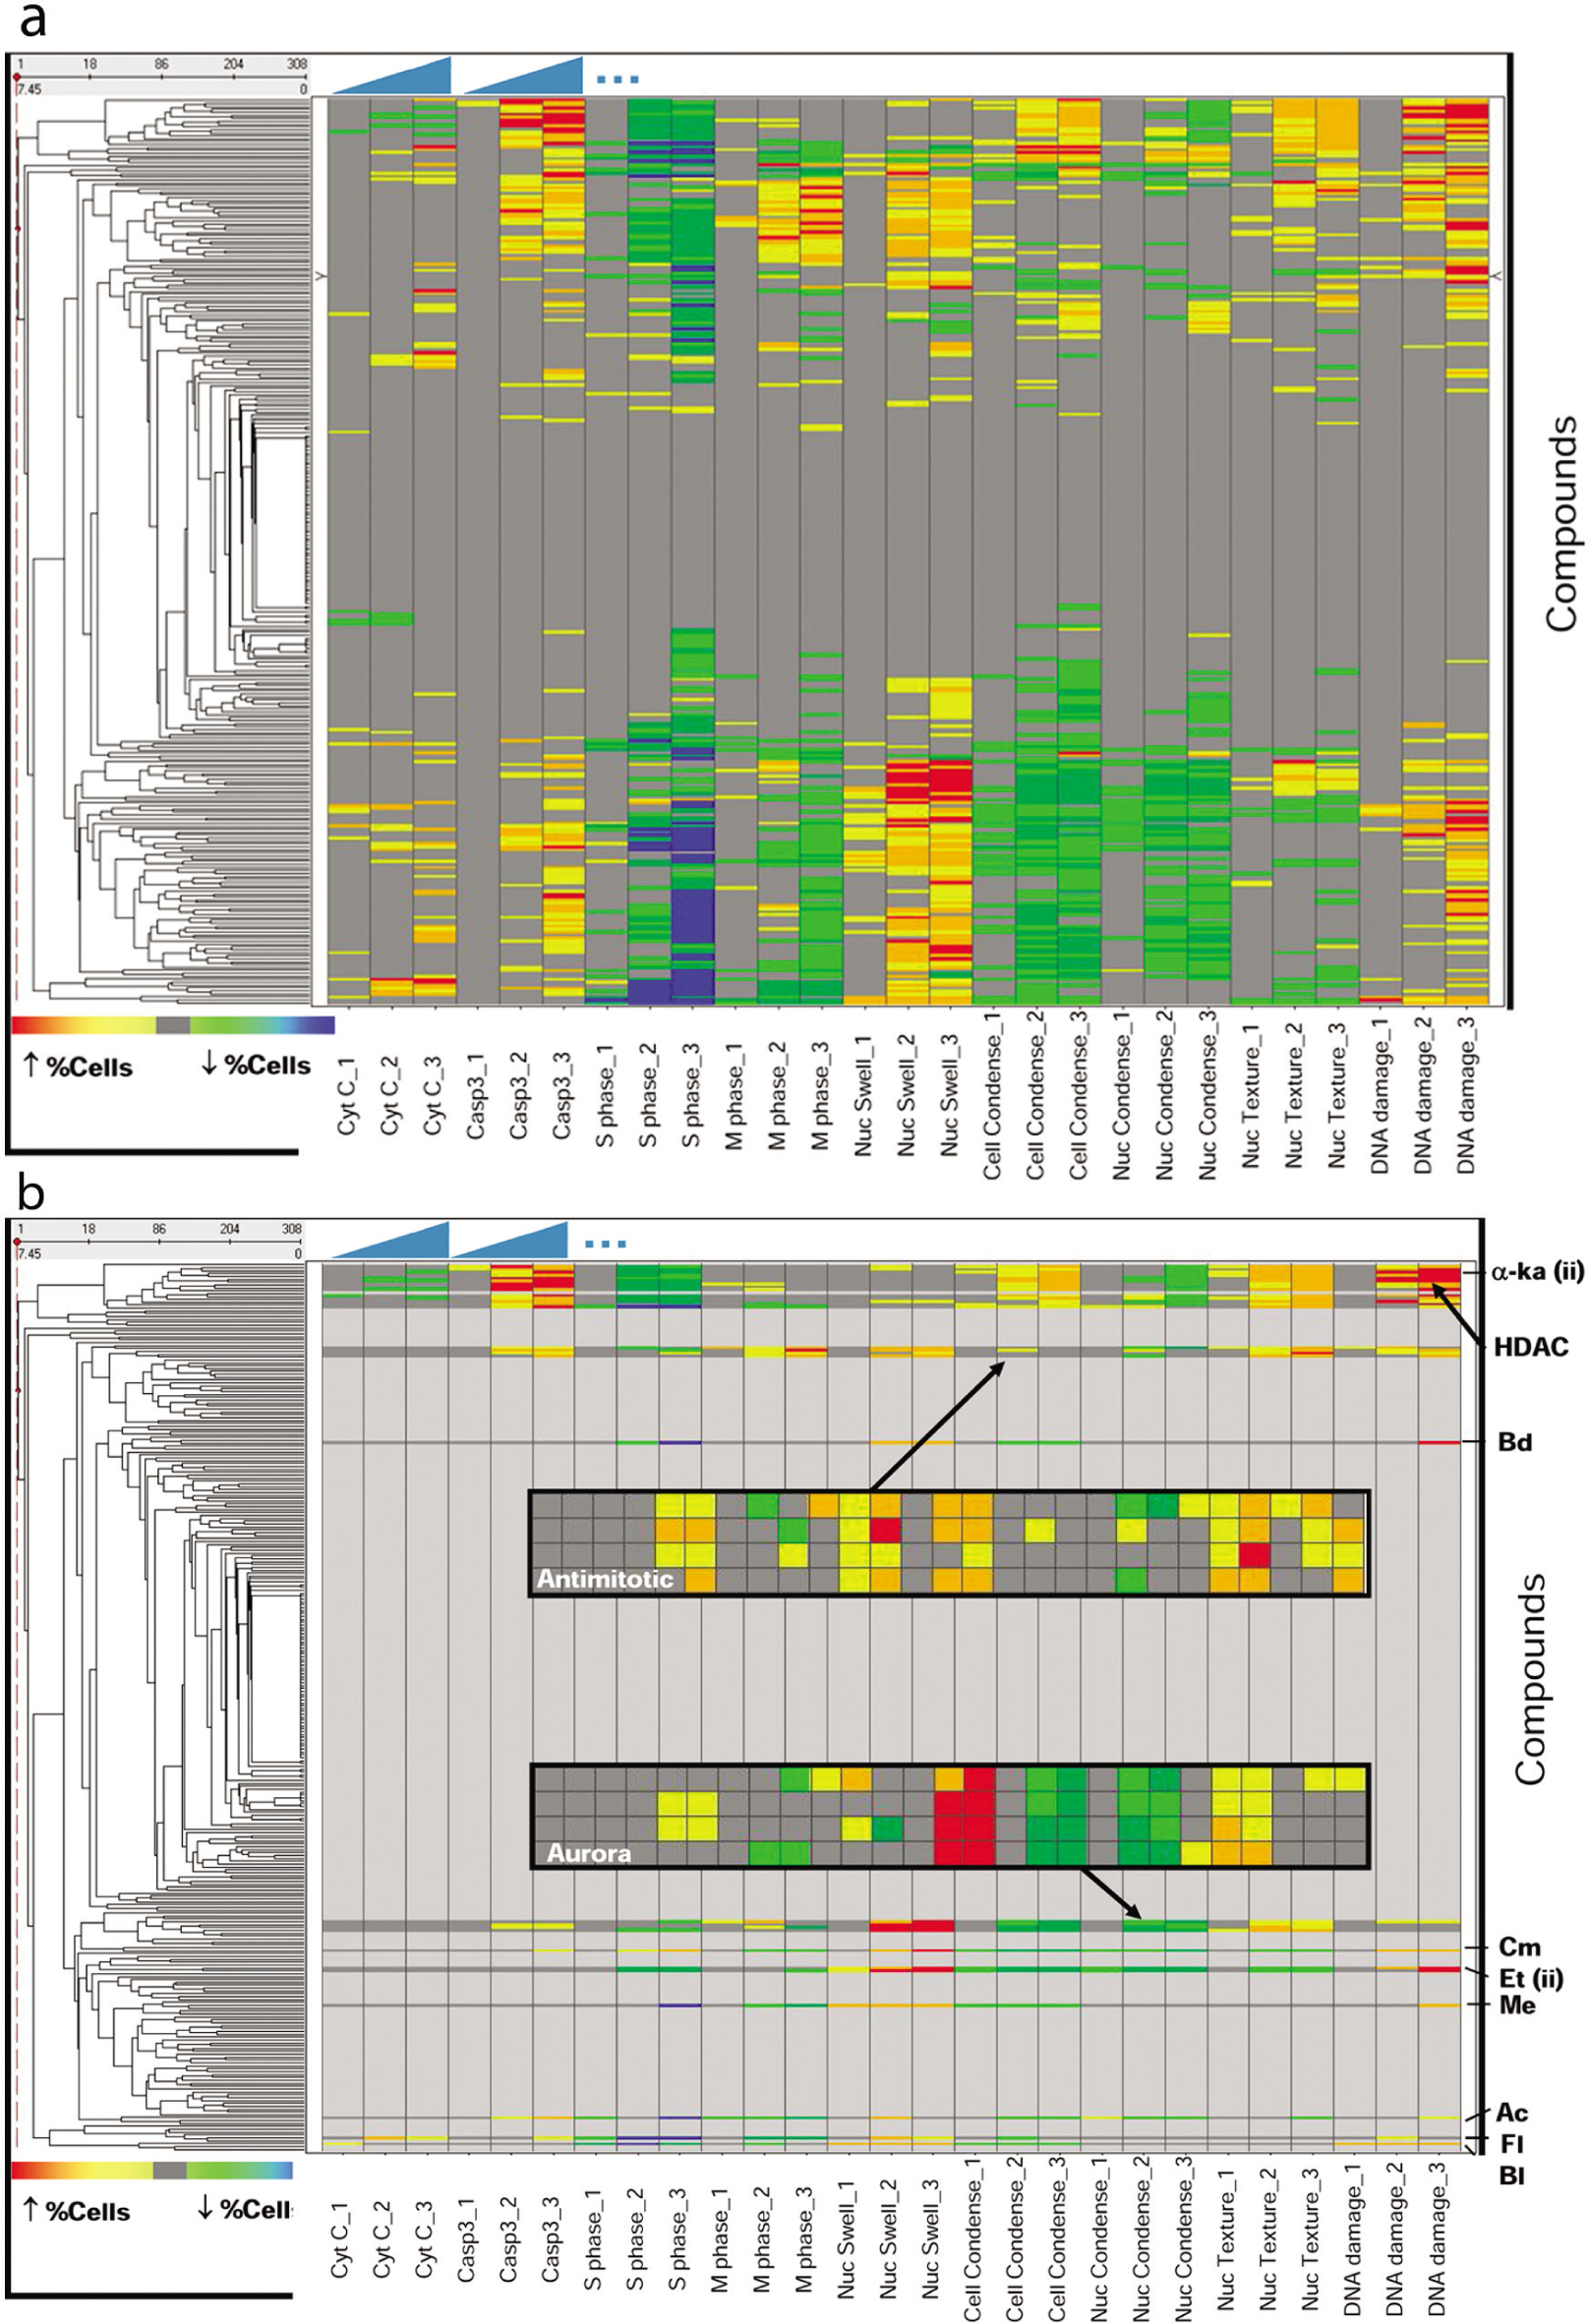
Clustering of multiparametric patterns of cell growth inhibition. (
For assessment of interexperimental variability, we tested a histone deacetylase (HDAC) inhibitor from the keto amide class (see compound 6 in the report by Glaser and colleagues 26 ) on different days. The robustness of the clustering is indicated by the observation that the repeated testing of the compound resulted in placement of the two growth inhibitory patterns such that they were separated by just one other compound (see α-ka (ii) in Fig. 5b ). The compound whose phenotypic pattern separated the results from the repeated testing of this compound was found subsequently to also be an HDAC inhibitor from the same keto amide class (data not shown). The entire class of HDAC inhibitors tested is highlighted in Figure 5b . Intraexperiment variability was evaluated by testing two different concentration ranges of etoposide (0.6 nM–10 µM and 3 nM–50 µM) in the same experiment. As the clustering method used is concentration independent and should be centered on the cell growth inhibitory concentration, these two patterns should be expected to group immediately adjacent to each other, which is the case (see Et (ii) in Fig. 5B ). These results indicate that phenotypic clustering of compounds acting via similar mechanisms appears to be robust and likely valuable, at least as a tool for navigating large multiparametric phenotypic data sets and initiating investigation of compounds with unknown mechanisms of action.
Interestingly, topoisomerase inhibitors camptothecin and etoposide also cluster near each other, whereas different classes of DNA damage inducers bendamustine (Bd), melphalan (Me), and bleomycin (Bl) do not. This result indicates that compounds that induce DNA damage (which can be induced via a variety of mechanisms) cannot be expected to cluster together. Additional reference compounds shown include flavopiridol (Fl) and actinomycin D (Ac). It should be mentioned that the most detailed interpretation of compound effects is best understood by evaluating the concentration-response plots ( Figs. 3 , 4 ) and examining representative microscopic images. The scale of experimentation described here is such that examination of images from each concentration for every compound is not practical and is thus typically done (a) to confirm the multiparametric phenotype of compounds of the highest interest and (b) as an algorithm QC tool to rule out compound effects that cause the image analysis algorithm to output unusual phenotypic patterns.
Discussion
We report the development of a panel of multiparametric HCS assays and associated data visualization approaches that are expected to significantly accelerate generation and interpretation of multiparametric patterns of cell responses. This approach was implemented to increase our understanding of the compounds that inhibit tumor cell growth in vitro on a large scale. The individual assays developed here are not novel. However, the application of these assays as a panel has several valuable attributes. Firstly, all measurements are biologically interpretable, are decision enabling, and span the major mechanisms of cell growth inhibition. Secondly, data are visualized in a way that enables rapid interpretation. Finally, analysis is focused on the perturbations that are most likely to explain cell growth inhibition. We expect this approach to be valuable in several scenarios. First, it enables definition of the role of particular drug targets, especially if multiple distinct chemotypes targeting the same target produce a common cell growth inhibiting phenotype. Compounds/chemotypes that produce an “outlier” multiparametric pattern of cell growth inhibition could be readily deprioritized based on likely off-target effects and an incomplete understanding of compound activity. Finally, we also expect to be able to reveal the dominant phenotype for each compound in the cell given the established polypharmacology of marketed drugs. 27
Our approach in isolation cannot be expected to reveal the mechanism of action of a compound as it only points to the general mechanism by which cell growth inhibition is affected. In the case of compounds associated with novel or unknown targets (as in the case of phenotypic screens), our approach is expected to be very powerful when used in combination with the rapidly growing suite of target/mechanism-finding approaches28–30 and biochemical profiling data, such as kinase selectivity. Additional mechanistic analyses associated with cytoskeletal rearrangement, in-depth cell cycle dissection, specific posttranslational protein modifications, and protein turnover using HCS or other assay formats could be used to either expand the panel or be implemented in subsequent investigation of specific compounds. Last, as HCS has routinely been used for target validation using RNAi-based gene silencing or gene knock-in technology, 31 such focused interpretable HCS assay panels offer ways to understand the role played by specific gene products in tumor cell growth as well.
Current efforts in our laboratory are focused on improving the ability of the panel of assays described here to automatically report complex biologically interesting cell death patterns, such as caspase-3 activation in the absence of cytochrome c release or vice versa. More detail in terms of single-cell data can be readily harnessed through algorithms that readily permit creation of user-defined Boolean strings across multiple parameters at the single-cell level. 32 In addition, there may be some room for streamlining of the assay based on retrospective analysis of the data generated. For example, whole cell size and nuclear size are highly correlated across large numbers of compounds and concentrations (D. Towne and V. Abraham, unpublished results). This is in agreement with a similar smaller scale investigation. 5 So far, we have successfully developed the panel using DLD-1, HCT-116, and A2058 cells (D. Towne and V. Abraham, unpublished data). We are also working to expand the assay panel with additional tumor cell lines that span key oncogenic genotypes and tissue origins of interest. Finally, the capability of measuring the same parameters described here in 3D cellular models and tumors from xenograft models ± treatment is also expected to be valuable.
A question that could be raised about the application of such highly multiplexed assay panels is regarding the relative sensitivities of the component assays. It should be noted that the question of sensitivity should be an even greater cause for concern when comparing results obtained using entirely different formats such as fluorescence microscopy, enzyme-linked immunosorbent assays, Western blots, and biochemical activity assays, which is done routinely. It should be noted that, our evaluation of well-characterized compounds revealed the expected patterns of cell death. A specific limitation of immunofluorescence-based assays is that severely compromised cells are often washed away during the several wash steps required for fluorescent labeling. We have optimized our cell washing to minimize cell loss, as evidenced by the retention of mitotically arrested cells ( Figs. 2 , 3 ). Although flow cytometry allows analysis of the entire cell population without loss of cells that are no longer adherent to the substratum, it is not optimal for use with adherent cells as the cells have to be detached from the substratum prior to fixation and labeling. It should be pointed out that the value of the assay panel described here is greatest for measuring prelethal (prior to loss of cell adhesion) changes that provide the greatest insight into mechanism of action. Another alternative is to develop such panels using cell lines expressing engineered fluorescent protein chimeras. While this approach will allow live-cell kinetic studies, reduce the reagent consumption, and simplify assay performance, it is also time-consuming to rapidly develop the panel in a collection of tumor cell lines as extensive cell line engineering is involved. The additional value of using immunofluorescence is that native proteins can be monitored.
The work reported here focuses on drug discovery in the field of oncology where a primary goal is often to affect growth inhibition, and preferably selective death, of tumor cells. The panel could be expanded to dissect other cellular processes thought to be involved in tumor regression such as cell migration/metastasis, angiogenesis, and autophagy. Similar HCS assay panels have been implemented for definition of cytotoxicity from a liability perspective using hepatocytes and HepG2 cells.13,14,33 We expect that similar mechanistically oriented, decision-enabling panels of assays, when implemented downstream of key physiologically relevant higher throughput phenotypic assay(s), should be valuable tools for other therapeutic areas as well. This should be facilitated as more pathological states continue to be modeled at the level of cellular phenotypes.34–38 The concept of HCS providing a means to ease the bottleneck following high-throughput screening in the drug discovery process has been proposed previously. 1 We believe that approaches such as the one described here may help to realize that prospect.
Footnotes
Acknowledgements
We thank Tamar Uziel for screening antibodies to be used for p-Histone H2AX detection and Kenneth Banike, Jeff Marolt, and Linda Traphagen for compound dispensing. We acknowledge Sujatha Gopalakrishnan, Jieyi Wang, Yu Shen, Joel Leverson, Shaun McLoughlin, William Pappano, Omar Shah, Julie Wilsbacher, and Chris Tse for several helpful discussions.
Declaration of Conflicting Interests
All authors are currently employed by, and obtain their salary from, Abbott Laboratories.
Funding
The authors disclosed receipt of the following financial support for the research, authorship, and/or publication of this article: All work described was supported by Abbott. No external grant support was used for this work.
References
Supplementary Material
Please find the following supplemental material available below.
For Open Access articles published under a Creative Commons License, all supplemental material carries the same license as the article it is associated with.
For non-Open Access articles published, all supplemental material carries a non-exclusive license, and permission requests for re-use of supplemental material or any part of supplemental material shall be sent directly to the copyright owner as specified in the copyright notice associated with the article.