
Abstract
Three-dimensional (3D) spheroid models are rapidly gaining favor for drug discovery applications due to their improved morphological characteristics, cellular complexity, long lifespan in culture, and higher physiological relevance relative to two-dimensional (2D) cell culture models. High-content imaging (HCI) of 3D spheroid models has the potential to provide valuable information to help researchers untangle disease pathophysiology and assess novel therapies more effectively. The transition from 2D monolayer models to dense 3D spheroids in HCI applications is not trivial, however, and requires 3D-optimized protocols, instrumentation, and resources. Here, we discuss considerations for moving from 2D to 3D models and present a framework for HCI and analysis of 3D spheroid models in a drug discovery setting. We combined scaffold-free, multicellular spheroid models with scalable, automation-compatible plate technology enabling image-based applications ranging from high-throughput screening to more complex, lower-throughput microphysiological systems of organ networks. We used this framework in three case studies: investigation of lipid droplet accumulation in a human liver nonalcoholic steatohepatitis (NASH) model, real-time immune cell interactions in a multicellular 3D lung cancer model, and a high-throughput screening application using a 3D co-culture model of gastric carcinoma to assess dose-dependent drug efficacy and specificity. The results of these proof-of-concept studies demonstrate the potential for high-resolution image-based analysis of 3D spheroid models for drug discovery applications, and confirm that cell-level and temporal-spatial analyses that fully exploit multicellular features of spheroid models are not only possible but soon will be routine practice in drug discovery workflows.
Introduction
Three-dimensional (3D) spheroid models, compared with traditional two-dimensional (2D) in vitro cell models, are far better suited to replicate human physiology in vitro and are amenable to a wide range of applications—from basic research to pharmaceutical drug safety and efficacy testing.
The scientific appeal of adopting 3D spheroid models is multifaceted. 3D spheroid models are compact in size and relatively simple to handle. The architecture of these models more faithfully mimics diffusion gradients (e.g., for nutrients, waste, and O2), which in turn create in vivo tissue-like microenvironments that have been shown to exhibit differential responses to drug treatment. 1 For example, 3D differentiated HepG2 spheroids exposed to compounds known to cause drug-induced liver injury (DILI) in humans were more likely to exhibit stress response activation than their 2D HepG2 counterparts. 2
Spheroids can be engineered to mimic a variety of different human tissue and organ types of varied complexities: from simple tumor models derived from well-established cancer cell lines to complex triple-culture liver models produced from primary human donor cells.3,4 With all major cells present in the model, multicellular spheroids have the potential to faithfully model cellular crosstalk and cell–extracellular matrix (ECM) interactions as well as secrete physiological levels and mixtures of ECM proteins, all without the need for exogenous ECM, gels, or scaffolds. Together, these features provide a physiologically relevant in vitro environment that not only mimics human tissue in terms of cellular composition and function, but also translates to a more in vivo–like response to drugs. For example, multicellular human liver spheroids (composed of hepatocytes, Kupffer cells, and liver endothelial cells) were shown to be nearly twice as predictive of DILI as 2D primary human hepatocytes when treated with a panel of 110 known compounds with known DILI profiles. 5 In addition, multicellular 3D spheroid models can also be engineered to replicate complex disease states to more effectively interrogate and predict human responses to new therapies.6,7
During the past decade, 3D spheroid models have also been adapted for use in assay- and automation-ready plate formats, including 96-, 384-, and 1536-well plates, as well as emerging microfluidic systems that support organ networks.8–13 With minor modifications, 3D spheroid models can be easily adapted to validated cellular endpoints, including assays originally designed for 2D cell culture to assess cell viability, cell function, and gene expression (e.g., biochemical assays, secreted biomarker assays, and omics methods).14,15
Cell-based assays, however, often rely on lytic and secretion endpoints and interrogate the whole spheroid, not specific cell populations or spatially defined regions of the spheroid. For many scientific investigations, a cell-level and/or temporal-spatial analysis would exploit more of the purported advantages and physiologically informative content of multicellular 3D models.
In contrast, high-content imaging (HCI) preserves both population-specific and spatial information. HCI assays are also highly amenable to multiplexing, which enables extraction of more information per well for models that tend to be more labor intensive and costly to manufacture than their 2D counterparts. At first glance, multicellular 3D models and high-content screening would appear to be a perfect match. Implementation of a robust high-content assay with enough resolving power to interrogate individual cell populations, subcellular structures, or specific microregions of the microtissue, however, can be unexpectedly challenging.
Designing a Successful Framework for High-Content Imaging of 3D Spheroid Models
Emerging 3D platforms and technologies can help address the obstacles and pitfalls that limit successful implementation of high-content screening assays in 3D models. We identified six fundamental components to consider when developing a 3D HCI framework: spheroid model, plate technology, assay protocols, process automation, imaging platform, and data analytics and management tools ( Fig. 1 ). The platform technologies underlying these components require careful evaluation and selection based on compatibility with the 3D imaging workflow.
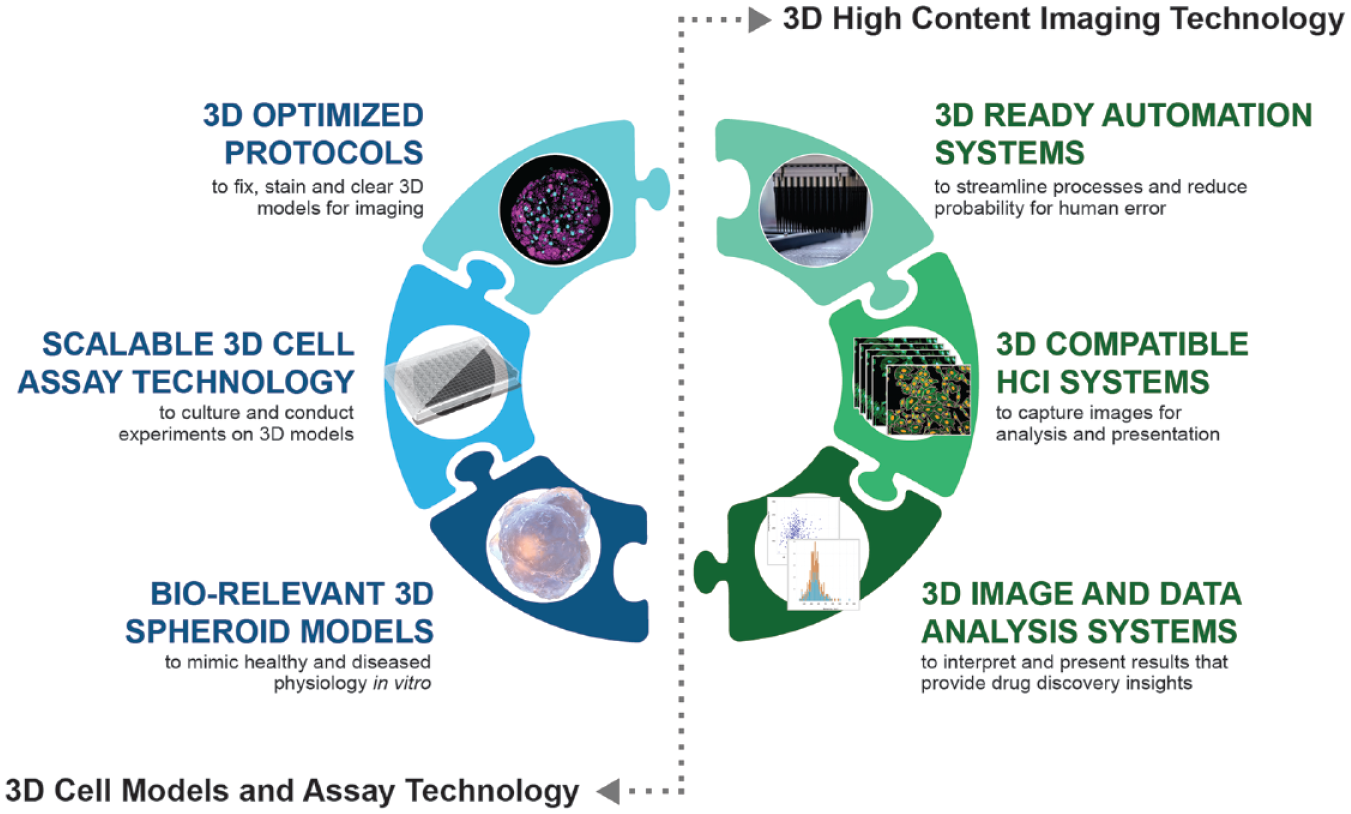
A framework for high-content imaging with three-dimensional (3D) models.
The 3D Models, Assay Technology, and Automation
The foundation of every 3D HCI study or screening campaign is the 3D cell model. For 3D applications, the materials and methods used for spheroid production can have a significant impact on downstream compatibility with 3D imaging techniques. During the past several decades, numerous methods for generating 3D spheroid models have been described. More recently, the benefits and challenges of using HCI approaches to extract phenotypic data from 3D spheroids have received attention.2,16,17 Some spheroid models rely on scaffolds to facilitate cellular assembly, provide structure, and serve as a source of ECM. Certain scaffold materials, however, can have deleterious effects on imaging and should be avoided. For example, the formation of spheroids in hydrogel scaffolds can produce spheroids located in several different Z-planes that may confound autofocus routines, whereas spheroids produced in porous polymers or thick collagen matrices may suffer from reduced light penetration and unacceptable light scatter. Production quality control is also important, because uniformity in spheroid size and cellular composition improves intra-assay reproducibility and therefore assay and screen robustness. 18
Selecting appropriate plate technologies (e.g., well plates), designed for both imaging and sustaining 3D spheroid models in culture, can significantly improve the quality and outcome of 3D assays. Many ultralow attachment plates developed for spheroid aggregation are not ideal for imaging due to round and/or thick polystyrene bottoms that reduce light transmission and introduce artifacts, especially at high magnifications. 19 Plates with conventional well geometry may also result in accidental spheroid loss during liquid-handling steps. For 3D HCI applications, the ideal plate should have a black frame to minimize fluorescent crosstalk; a flat, thin, optically pure bottom to maximize light transmission; compatibility with water immersion objectives; and a well geometry that facilitates efficient media exchanges and wash steps without associated sample loss. The latter is particularly important for assays that use non-adherent spheroids.
HCI fix and stain protocols originally designed for 2D applications often require re-optimization for 3D models, in which the free diffusion of probes and antibodies may be limited by layers of tightly associated cells or hydrogels. Longer incubation times and harsher permeabilization conditions are necessary to enable probes and antibodies to stain the full spheroid. And use of clearing techniques 20 is frequently required to achieve deeper light penetration.
Automation platforms (e.g., liquid handlers, dispensers, and plate washers) with features such as tunable aspiration and dispensing speeds and adjustable XYZ offsets are preferable for non-adherent spheroids to minimize loss during processing. For attached, hydrogel- or agarose-embedded 3D models, automation steps may be similar to 2D methods and require less optimization. Prerequisite for either system, however, are plate formats that adhere to SLAS (Society for Laboratory Automation and Screening) and ANSI (American National Standards Institute) specifications, thus enabling seamless integration with robotic systems.
Considerations for Upgrading an HCI Platform from 2D to 3D
The basic workflow for 2D HCI is already well defined and can be easily extended to 3D HCI; however, the underlying platform technology parameters may vary considerably between 2D and 3D applications ( Fig. 2 ).
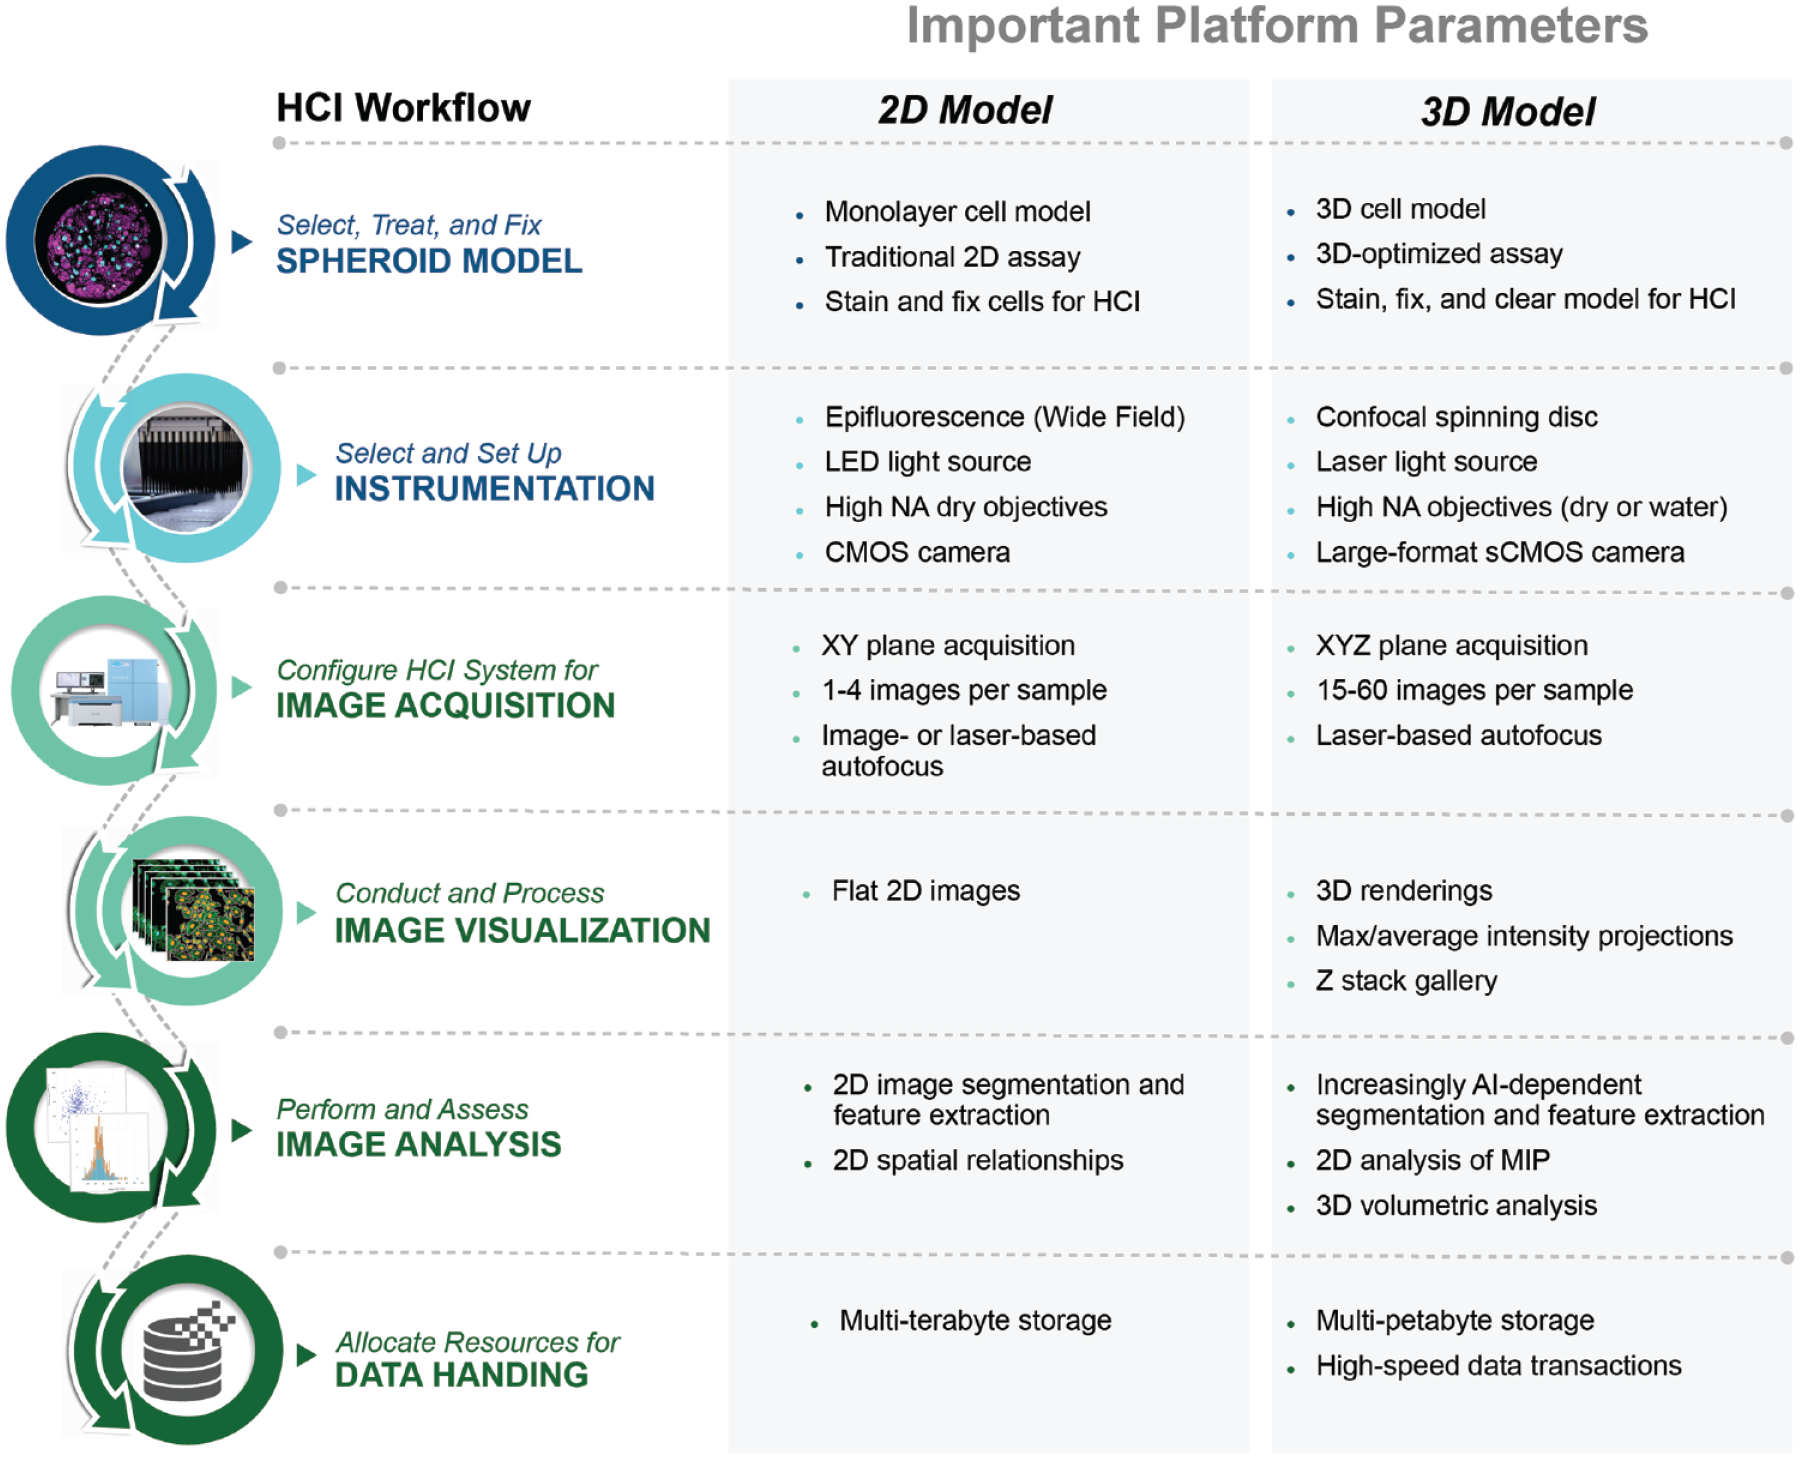
High-content imaging (HCI) workflow with platform guidelines for 2D and 3D applications.
Choosing an appropriate high-content image acquisition and analysis platform for 3D applications is paramount. For low-resolution readouts, such as spheroid diameter, a widefield imager may be adequate, but for high-resolution, high-content screening, a spinning disk confocal platform with 3D acquisition and automated 3D image analysis capability is almost certainly required.
Some key features of a high-resolution 3D-compatible HCI platform are: a laser light source, a dual spinning disk with microlens to maximize excitation of fluorescent labels deep within the microtissues; targeted object acquisition—a two-step process that increases acquisition speed and reduces the number of empty images; a large-format scientific complementary metal–oxide–semiconductor (sCMOS) camera for increased speed, sensitivity, and effective field of view; and a flexible autofocus routine that enables laser-based focusing with a large range of plate bottom thickness and flatness.
Image analysis capability is also a key component of a 3D imaging platform and should include a software package with 3D modules and tools. For example, maximum intensity projections (MIPs) compress large Z-stacks down to a single 2D image, which then can be analyzed with conventional 2D image analysis tools, dramatically reducing image analysis time. For biological investigations that depend on measuring spatial relationships and subtle phenotypes, a 3D volumetric analysis option is essential.
Equally important, due to the vast amounts of data (mainly in the form of images) associated with 3D and four-dimensional (4D, i.e., time-lapse 3D) imaging assays, a data management solution that includes multi-petabyte data storage and enables ultrafast data transactions is also a necessity.21,22
We propose an HCI framework that addresses the basic HCI workflow and platform parameters that support effective and efficient high-content image analysis of 3D spheroid models. We demonstrate how these platforms work in concert and can be used to develop HCI applications that broaden our understanding of human disease progression and predict the response to different medical treatments or therapies.
We devised three representative HCI applications using 3D spheroid models for experiments in which the biological response could not be adequately served by lytic or secreted endpoints due to cellular complexity. We had determined that performing these studies using widefield imaging systems was not optimal, and in some cases not possible due to light penetration, image resolution, or speed requirements.
We anticipate that these guidelines and proof-of-concept applications will assist research groups in the efficient implementation of a 3D framework that not only fulfills their needs but also realizes the full potential of physiologically relevant models in a drug discovery setting.
Materials and Methods
3D Liver Model Maintenance and Treatment
3D InSight Human Liver Microtissues were provided by InSphero (InSphero AG, Schlieren, Switzerland), in an Akura 96-well plate (InSphero AG). Microtissues were generated by self-assembly of monodispersed primary cells, as described previously.23–25 The liver microtissues were a co-culture of primary human hepatocytes (10-donor pool), primary human non-parenchymal cells (single-donor liver endothelial cells and Kupffer cells), and human primary hepatic stellate cells (single-donor).
Following self-assembly, liver microtissues were incubated for 1–4 days in 70 µL of 3D InSight Human Liver Maintenance Media–TOX (InSphero AG) to stabilize phenotypic and functional characteristics.
To simulate nonalcoholic steatohepatitis (NASH) disease progression, liver microtissues were exposed for 10 days to either Lean or NASH conditions. In brief, Lean-condition microtissues were cultured in 70 µL of basal hepatocyte maintenance medium (InSphero AG) supplemented with normal glucose (cat. no. 50-99-7; Merck, Kenilworth, NJ) and vitamin C (cat. no. A8960; Sigma-Aldrich, St. Louis, MO). NASH-condition microtissues were cultured in 70 µL of basal hepatocyte maintenance medium supplemented with elevated glucose (cat. no. 50-99-7; Merck) and fructose levels (cat. no. F3510; Sigma-Aldrich), free fatty acids (FFAs; InSphero AG), and a pulse application of lipopolysaccharide (LPS; cat. no. L2880; Sigma-Aldrich). Medium was exchanged on days 0, 3, 5, and 7 of treatment.
To assess effects on lipid accumulation, Firsocostat, an acetyl-CoA carboxylase (ACC) inhibitor, was applied during a 10-day NASH induction protocol. A 50-mM stock solu-tion of Firsocostat (cat. no. HY-16901; MedChemExpress, Monmouth Junction, NJ) was prepared by solubilizing the powder in DMSO (cat. no. 2650; Sigma-Aldrich). Final concentrations applied to liver microtissues were 0.5 µM and 10 µM, and dosing was performed using a TECAN D300e Digital Dispenser. All conditions were normalized to 0.2% DMSO. Six biological replicates were performed for each treatment group. Dosing was applied on days 0, 3, 5, and 7 of treatment.
Fixation and Staining
On day 10 of treatment, liver microtissues were washed 1× with phosphate-buffered saline (PBS, containing Ca2+ and Mg2+; cat. no. D8662; Sigma-Aldrich) and fixed for 1 h at room temperature in 4% paraformaldehyde (PFA; cat. no. J61899; Alfa Aesar, Tewksbury, MA). For staining, PBS was removed, staining solution [PBS + Nile Red (1:700 from 1 mg/mL stock in acetone; cat. no. N3013; Sigma-Aldrich) + DAPI (1:500 from 1 mg/mL stock solution in ddH2O; cat. no. 096M4014V; Sigma-Aldrich)] was added, and the liver microtissues were incubated for 1 h at room temperature. Staining solution was removed, the liver microtissues were washed 1× with PBS, and fresh PBS was added to wells for imaging.
Image Acquisition and Analysis
Imaging was performed on a Yokogawa CQ1 confocal high-content analysis (HCA) system (Yokogawa Electric Corp., Tokyo, Japan). A 40× objective (Olympus, Tokyo, Japan) was used for imaging with the following settings: DAPI: excitation 405 nm laser, laser power set to 30%, emission filter 447/60; and Nile Red: excitation 488 nm laser power 20%, emission filter BP617/73. Image stacks were acquired at intervals of approximately 4 µm to a final depth of 62 µm; in total, 15 sections were acquired for each microtissue.
MIP images were created from Z-sections for each channel, and MIPs were then used for image analysis. Images acquired with the 405 nm laser were used to identify the entire microtissue region and individual nuclei. Lipid droplets were then detected using images acquired with the 488 nm laser. Only droplets residing within the microtissue region (defined in the 405 nm channel) were measured. The number of lipid droplets, area of lipid droplets, and total intensity of lipid droplets were measured as features; the lipid droplets were further gated into five groups according to size (Group1: 0–10 µm2; Group2: 10–30 µm2; Group3: 30–50 µm2; Group4: 50–100 µm2; and Group5: >100 µm2) using the CellPathfinder Gate function.
3D Lung Tumor–Immune Cell Model Generation and Treatment
3D InSight Tumor Microtissues were provided by InSphero AG in HCI-optimized Akura 384-well plates (InSphero AG). In short, these tumor microtissues (spheroids) were generated by self-assembly of monodispersed cells (tumor cells plus fibroblasts), as previously described. 26 The multicellular tumor microtissues used in this study were generated from green fluorescent protein (GFP)-labeled A549 cells (lung carcinoma cell line) plus primary human dermal fibroblasts (hDFs). Tumor microtissues were maintained in Dulbecco’s modified Eagle’s medium (DMEM; Gibco, Fisher Scientific, Illkirch Cedex, France), supplemented with 10% fetal bovine serum (FBS; Sigma-Aldrich) and 1% penicillin and streptomycin (P/S).
Infiltration of Tumor Microtissues by CD3- and CD28-Activated Immune Cells
A549–GFP/hDF lung tumor microtissues with an initial diameter of ~250 µm were used for the immune cell infiltration assay. Peripheral blood mononuclear cells (PBMCs, obtained from StemCell Technologies, Vancouver, Canada) were thawed and washed once with RPMI1640 medium supplemented with 10% fetal calf serum (FCS) and 1% P/S, as instructed by the manufacturer. Immune cells were either left untreated (T-cell-naïve) or pretreated using anti-CD3 (5 ng/mL) and anti-CD28 (250 ng/mL) monoclonal antibodies (BioLegend 300314, cat. no. B206044; BioLegend, San Diego, CA). PBMCs were exposed to stimulating factors for 24 h, then washed and allowed to rest for another 24 h in RPMI1640, 10% FCS, and 1% P/S. Following the rest phase, PBMCs were stained with CellTracker Deep Red dye (10 µg/mL; cat. no. C34565; ThermoFisher, Waltham, MA) for 1 h at 37 °C, then co-cultured with A549–GFP tumor microtissues (10:1 E:T ratio) in Akura 384-well plates using RPMI1640, 10% FCS, and 1% P/S.
Image Acquisition and Analysis
Image acquisition was performed using a Yokogawa CQ1 confocal HCA system (Yokogawa Electric Corp.) in Akura 384-well plates. Images were acquired with a 20× objective lens (Olympus), Z-range was 60 µm, and Z-step was 5.5 µm. For 488-nm images, emission filter 525/50, laser power was set to 30%, with a 200 msec exposure. For 640-nm images, emission filter 685/40, laser power was set to 20%, with a 150 msec exposure.
Infiltration of immune cells within tumor microtissues was monitored for 39 h using settings for 3D live-cell imaging. Incubation conditions were set to 37 °C, 5% CO2, with humidification. Three biological replicates were performed for each treatment group. Two time-lapse intervals were used: 10 min for timepoints 1–20, and 60 min for timepoints 20–56.
A 3D analysis was performed using individual Z-sections from each channel. Tumor microtissues were detected in images acquired with the 488-nm laser, and each cell was further segmented. PBMCs were detected on 640-nm images, and each immune cell was further segmented. To analyze only PBMCs near or touching tumor cells, the region of tumor cells was expanded by 15 µm, and only PBMCs within the expanded region were included in the analysis. The total volume of tumor cells and total volume of PBMCs were calculated by integrating voxels from each Z-section in the respective regions after segmentation. The Z-position of each tumor cell and Z-position of each PBMC were also measured and gated into eight groups by Z-position (P0–10 µm, P10–20 µm, P20–30 µm, P30–40 µm, P40–50 µm, P50–60 µm, P60–70 µm, and P>70 µm).
3D Gastric Carcinoma Co-Culture Model
3D InSight Tumor Microtissues were generated from a GFP-labeled NCI-N87 gastric carcinoma cell line and red fluorescent protein (RFP)-labeled NIH3T3-L1 murine fibroblasts. In short, these tumor microtissues (spheroids) were generated by self-assembly of monodispersed cells (tumor cells plus fibroblasts), as previously described.24,26 Following self-assembly, microtissues were treated with lapatinib (Selleck Chemicals, Houston, TX) for 6 days; dosing was performed on day 0 and day 3 during media exchange. Lapatinib was applied at 3 concentrations (5, 0.5, and 0.05 mM) with 16 microtissues (biological replicates) per dose. The DMSO-treated group served as vehicle control. On day 6, all microtissues were collected and fixed with 4% PFA, washed once with PBS, and stored in PBS plus 0.05% sodium azide at 4 °C until imaging.
Image Acquisition and Analysis of Tumor Co-Culture High-Content Screen
Images were acquired on the Yokogawa CV8000 confocal high-content analysis (HCA) system (Yokogawa Electric Corp., Tokyo, Japan) using a 10× objective lens. Z-range was 310 µm; the Z-step was 5.0 µm. For 488-nm images, we used an emission filter 525/50, laser power set to 60%, and a 300 msec exposure time. For 561-nm images, we used an emission filter 600/37, laser power of 60%, and a 300 msec exposure time. 3D image analysis was performed using Z-sections from each of the acquired channels.
GFP-labeled tumor cells were detected from images acquired with the 488-nm laser, and RFP-labeled fibroblasts were detected with images acquired with the 561-nm laser. The total volume of tumor cells and total volume of fibroblasts were calculated by integrating voxels from each Z-section in the respective regions after segmentation. The total volume of the spheroid region was calculated by adding tumor and fibroblast regions.
Results
3D Spheroid Model and Plate Technology
Aligned with the proposed HCI framework, we applied a 3D model platform specifically engineered to meet requirements for downstream applications, such as HCI, in one turnkey solution. The platform combined scaffold-free 3D spheroid microtissues (spheroids) with automation and HCI-compatible plate technology. The plate technology underlying the platform possessed several features that made it ideal for downstream imaging applications. First, the plates are available in three ANSI- and SLAS-compliant formats: 96-well, 384-well, and an 80-well microphysiological system (MPS) for organ-on-a-chip applications ( Fig. 3A ; MPS 27 not shown). Spheroids had been shown to thrive in all three formats. The unique well geometry includes a lower spheroid compartment and a pipetting ledge. This ledge helps the user position the pipet tip on the side of the well, thus preventing unintended physical damage. Furthermore, it significantly lowers the risk of spheroid loss during media exchanges and wash steps. During liquid removal, a minimal residual volume remains in the lower spheroid compartment protecting the spheroid. The optically pure flat-bottom material (polystyrene for the 96-well plate and MPS, and ultrathin Teflon film for the 384-well plate) promotes good light penetration and minimizes imaging aberrations. Unlike other commercially available well plates, this plate well bottom has a diameter of only 1 mm, which makes location and imaging of small spheroids in the 96-well plate faster, requires fewer fields for whole-well acquisitions, and therefore requires less image storage space ( Fig. 3B ).
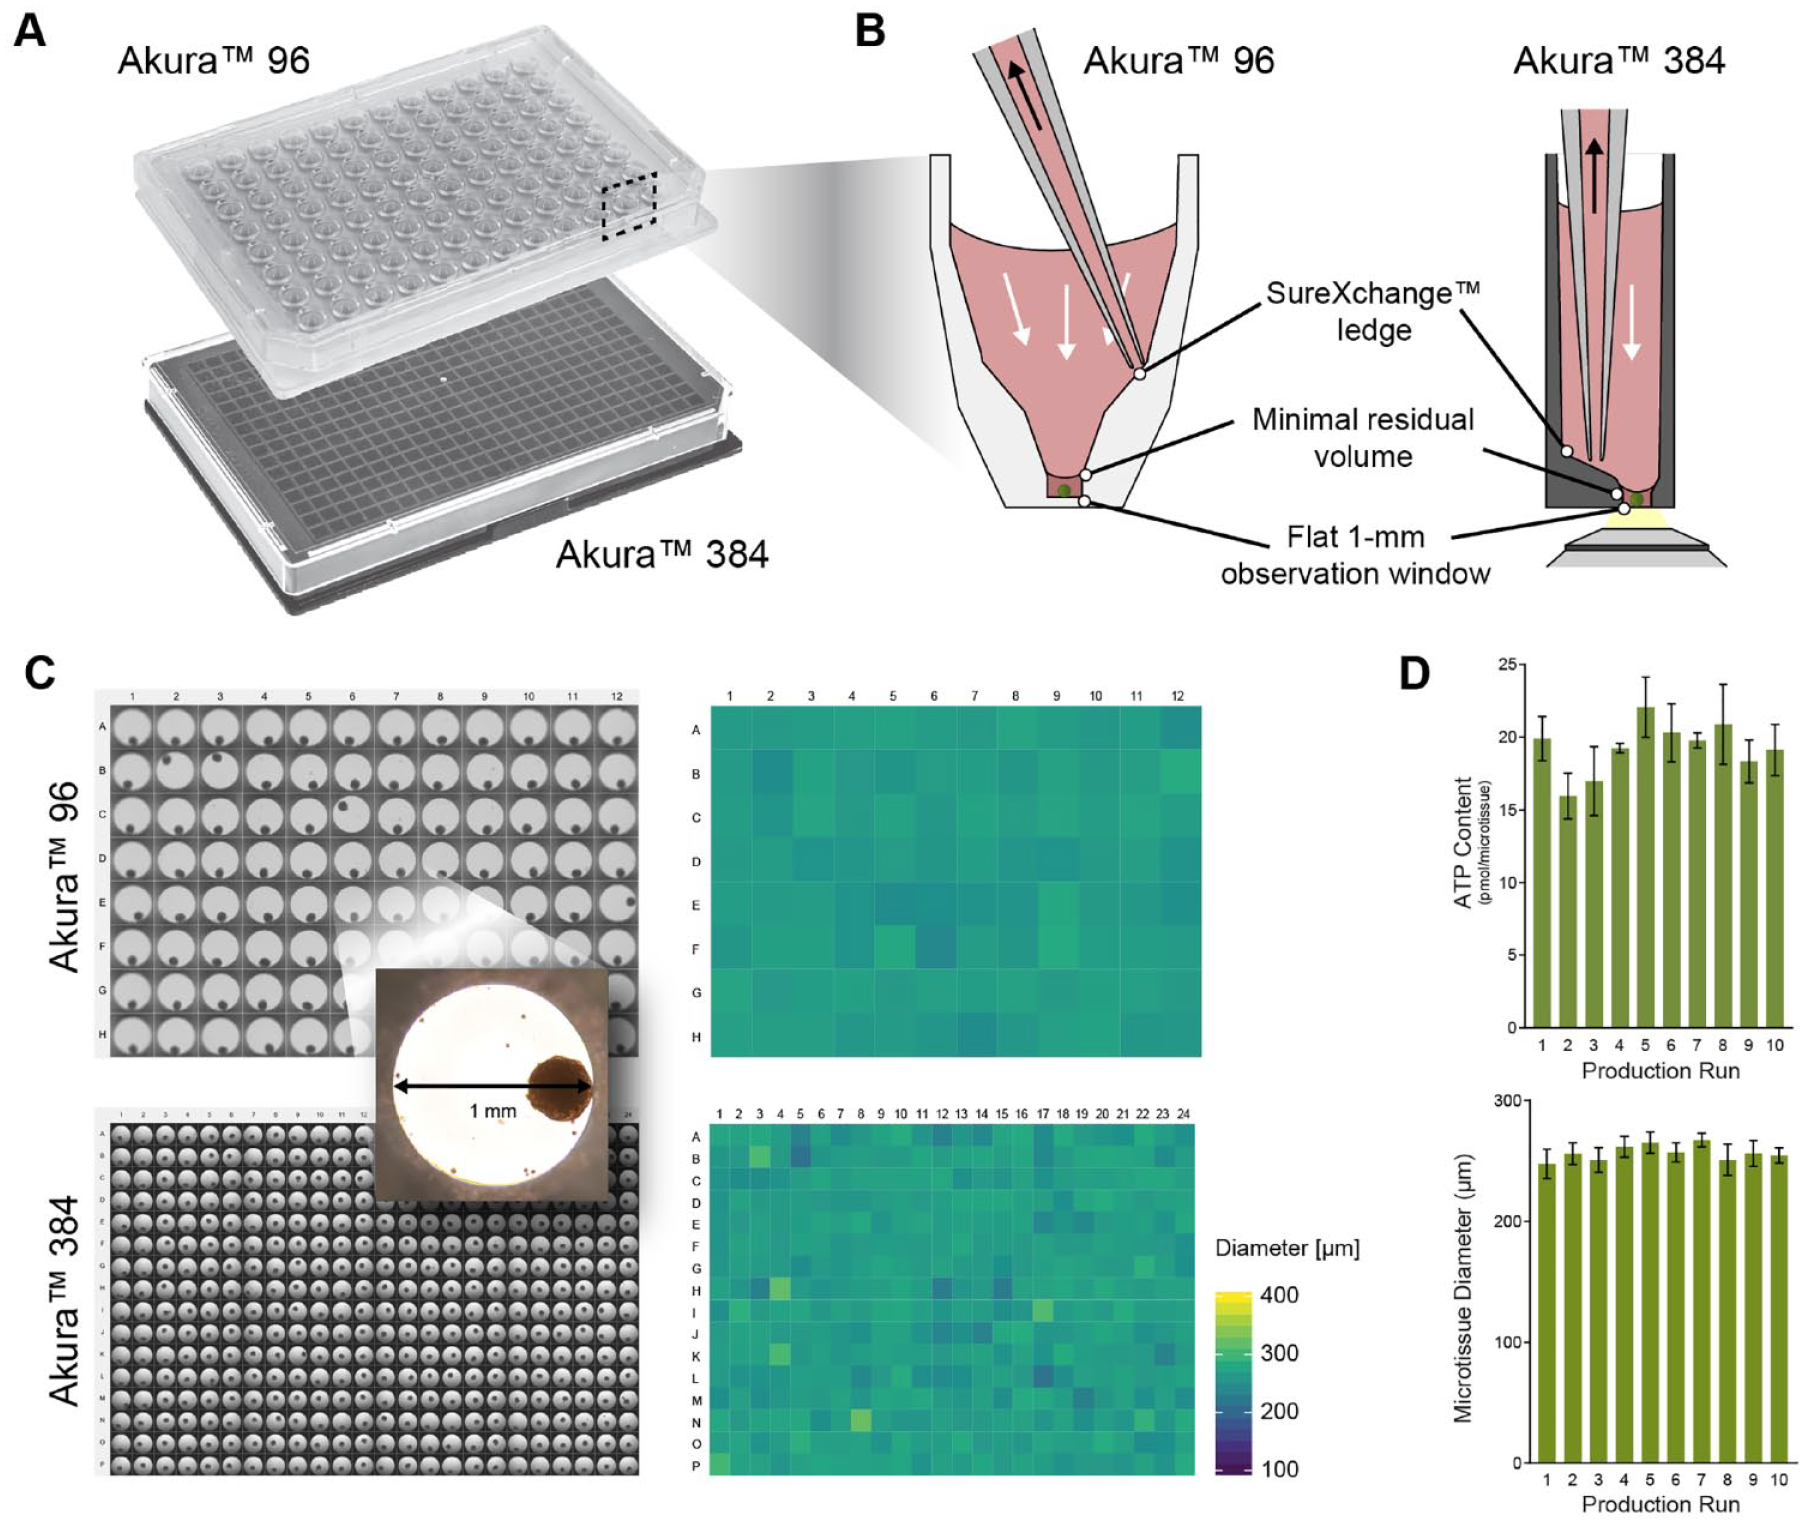
The scaffold-free cellular self-assembly manufacturing process used to generate 3D spheroid models resulted in spheroids that were highly uniform in size and cellular composition among plates ( Fig. 3C ). Uniformity of the spheroid models was further supported by extremely low variations in adenosine triphosphate (ATP) and size for microtissues throughout multiple productions ( Fig. 3D ).
In this platform, spheroid models may be transferred easily from one format to another, enabling researchers to move freely from a high-throughput screening format to a highly complex, multitissue MPS format, which can be more physiologically relevant but lower throughput.
HCI of Lipid Accumulation in a Human 3D NASH Model with a Steatosis-Like Phenotype
Nonalcoholic fatty liver disease (NAFLD) is a chronic liver disease closely associated with the rising epidemics of obesity and diabetes. The spectrum of NAFLD starts with accumulation of fat in liver hepatocytes (steatosis), and it may progress to more severe forms of the disease characterized by inflammation of the liver and hepatic ballooning (NASH), scarring of the liver (fibrosis), and eventually liver cirrhosis or cancer. 28 There are currently no US Food and Drug Administration (FDA)-approved treatments on the market to treat either NAFLD or NASH. It is an area of intense study, and numerous pharmacotherapeutic approaches aimed at treating NALFD and NASH, many of which target proteins that regulate lipid metabolism 29 or involve combination therapies, are currently under investigation and would benefit from high-content screening experimental strategies.
The histological hallmark of both NAFLD and NASH is excessive accumulation of lipid droplets in the cytoplasm of liver hepatocytes. NAFLD can be further stratified by the morphology of lipid droplets, presenting as either microvesicular or macrovesicular steatosis. The presence of microvesicular steatosis in NALFD patients has recently been positively correlated with severity of disease. 30
We developed a high-content assay using a multicellular 3D spheroid liver model of NAFLD–NASH to evaluate compounds for their therapeutic effects on hepatic steatosis. To model the disease, we used a 3D liver spheroid model composed of the liver cell types implicated in the progression of NAFLD: human primary hepatocytes, Kupffer cells, liver endothelial cells, and hepatic stellate cells. Throughout a 10-day time course, we induced a fatty liver NAFLD phenotype in the 3D human liver model by exposing healthy 3D liver spheroids to the media equivalent of a Western diet: high glucose and fructose, FFAs, plus a pulse of LPS. Triglyceride (TG) accumulation in this NASH model was visualized using Nile Red, a probe that fluoresces red in the presence of neutral lipid.
For each spheroid, 15 4-µm Z-sections were obtained using the Yokogawa CQ1. In this study, we were able to image to a depth of 62 µm without compromising lipid droplet segmentation. Efficient automated image acquisition of the spheroids was enabled by the uniformity of spheroid size, shape, and composition; the optical properties and small viewing port of the plate; the large range of bottom thickness (0–2.0 mm) accommodated by the 40× objective and autofocus routine; map-mode acquisition; the low-magnification scan followed by high-magnification scan targeting only the object of interest; and the large field of view provided by the sCMOS camera, resulting in only one XY field per spheroid. Image analysis efficiency was enhanced by the availability of 3D image processing. In this example, the generation of MIPs reduced the total number of analyzed images per spheroid from 15 to 1.
The grayscale and composite images of lipid droplets reveal mild lipid accumulation in the low-glucose Lean condition that is likely the result of de novo lipogenesis, 31 because the Lean medium does not contain FFAs. When the same liver spheroids were cultured for 10 days in the presence of diabetic levels of glucose and fructose, exogenous FFAs, and a short pulse of LPS (NASH condition), we observed a statistically significant increase in lipid accumulation (p < 0.01) ( Fig. 4A ). Under these conditions, the accumulation of lipid is likely to be the result of FFA uptake as well as increased de novo lipogenesis.
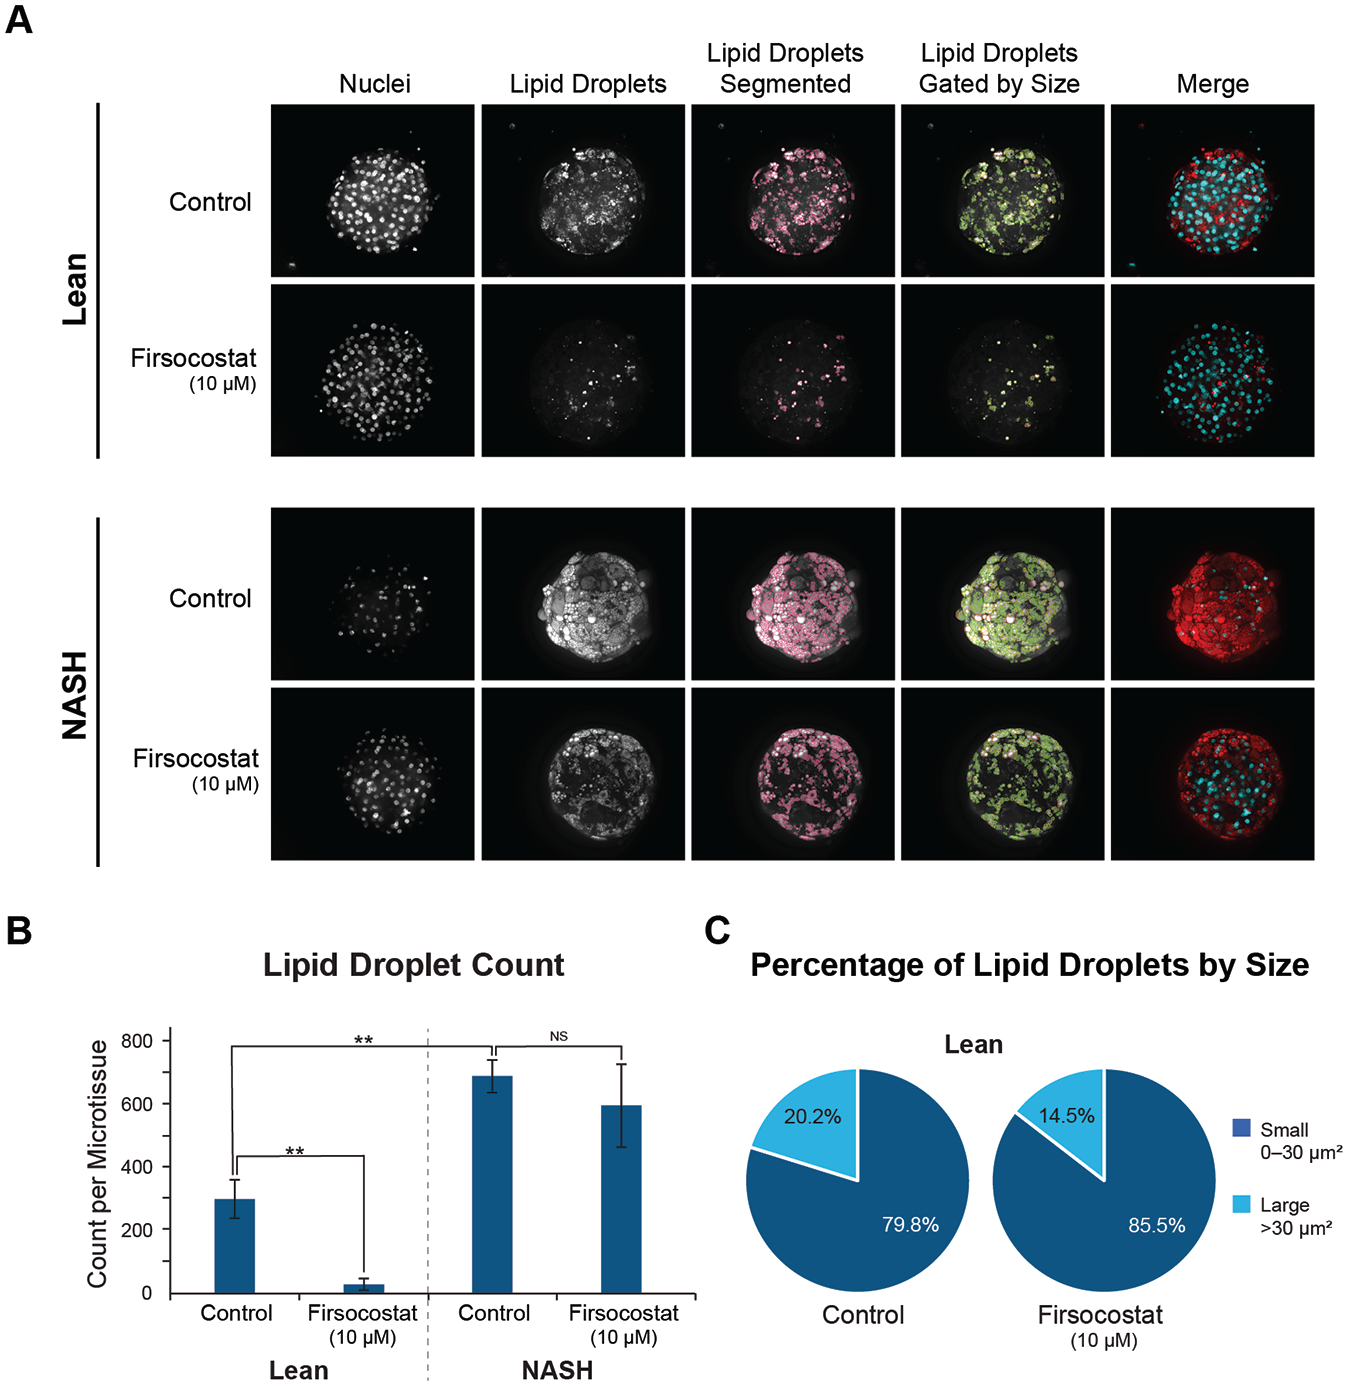
ACC is an enzyme that catalyzes the first committed step of de novo lipogenesis (DNL). When Firsocostat, an ACC inhibitor, is applied at the start of the 6-day incubation, a statistically significant decrease in lipid accumulation is observed in the Lean condition (p < 0.01). Only a modest decrease in lipid accumulation is observed with Firsocostat, however, when applied in the presence of the NASH condition (not significant, or NS). This result is not entirely unexpected considering that under the NASH conditions (high sugar plus FFAs), uptake of exogenous FFAs may exceed the contribution of DNL to the TG pool ( Fig. 4B ).
Other studies have highlighted the potential prognostic value of being able to differentiate and quantify two subtypes of hepatic steatosis: microvesicular and macrovesicular. 32 Lipid droplet size has been correlated with certain classes of dietary fatty acids (Ref. 33 and unpublished data). Based on these observations and their implications for patient treatment strategies, we investigated whether we could apply an HCI approach to further classify lipid droplets by size in our NASH disease model. We recognized that it could be challenging to achieve adequate segmentation of both types of lipid droplets in a multicellular 3D model. Our initial attempt to properly segment both large (>30 µm2 in diameter) and small (0–30 µm2 in diameter) lipid droplets of varying intensities demonstrates, however, that classification of microvesicular and macrovesicular steatosis in 3D models using MIPs is feasible ( Fig. 4C ). In addition to the significant decrease in total lipid observed in the Lean + Firsocostat treatment group, small differences in the percentage of large and small lipid droplets were also observed between Lean and Lean + Firsocostat treatment groups ( Fig. 4C ).
Lipid droplet size classification, when combined with other parameters such as hepatocyte ballooning or nuclear displacement, could add significant value when evaluating lipid-modulating compounds or when characterizing the severity of steatosis in in vitro and ex vivo models of NAFLD and NASH. Additional studies would be required to correlate in vitro lipid phenotypes with the pathological findings and disease severity scoring from patient biopsies.
Live-Cell Imaging with Spatial and Temporal Quantification of Immune Cell Infiltration in 3D Lung Carcinoma Model
Oncology continues to be a disease area with a high unmet need. But unlike for NAFLD and NASH, numerous FDA-approved therapies for common cancer types exist. Despite the vast array of treatment options now available, patient survival rates remain extremely poor, and overall drug failure rates remain disproportionately high among all branches of oncology. During the past decade, targeted approaches such as immuno-oncology (I-O) therapies, as well as clinical trials that make use of biomarkers for patient selection, have resulted in more positive results and renewed hope for finding cures. 34 There is still, however, a very strong need for methods that streamline the compound selection process and identify more efficacious and durable treatments.
Multicellular 3D tumor models have been shown to more faithfully recapitulate cell interactions and discrete tumor zones (e.g., proliferating, quiescent, and necrotic), collectively known as the tumor microenvironment (TME), than conventional 2D models.16,35 In addition, several studies have shown that drug responses from 3D models are better aligned with in vivo preclinical results and, in some cases, with human clinical results.36,37
Even so, adoption of 3D models in the drug discovery process has been slow, in part because of technical challenges associated with developing and screening in these models. 38 For I-O applications, challenges are further exacerbated by the need to include disease-appropriate immune cell populations.
To illustrate how HCI and HCA can be applied to advance our understanding of I-O treatments on immune cell infiltration and tumor killing, we developed a multicellular 3D lung cancer model. We fluorescently tagged the tumor spheroids and PBMC populations with a recombinantly expressed GFP and a live cell tracer dye, respectively.
The A549–GFP + hDF lung carcinoma tumor co-culture model was left untreated, treated with naïve PBMCs, or treated with CD3- and CD28-activated PBMCs, and then placed on the environmental stage of the Yokogawa CQ1 platform and imaged at regular time intervals for 37 h (
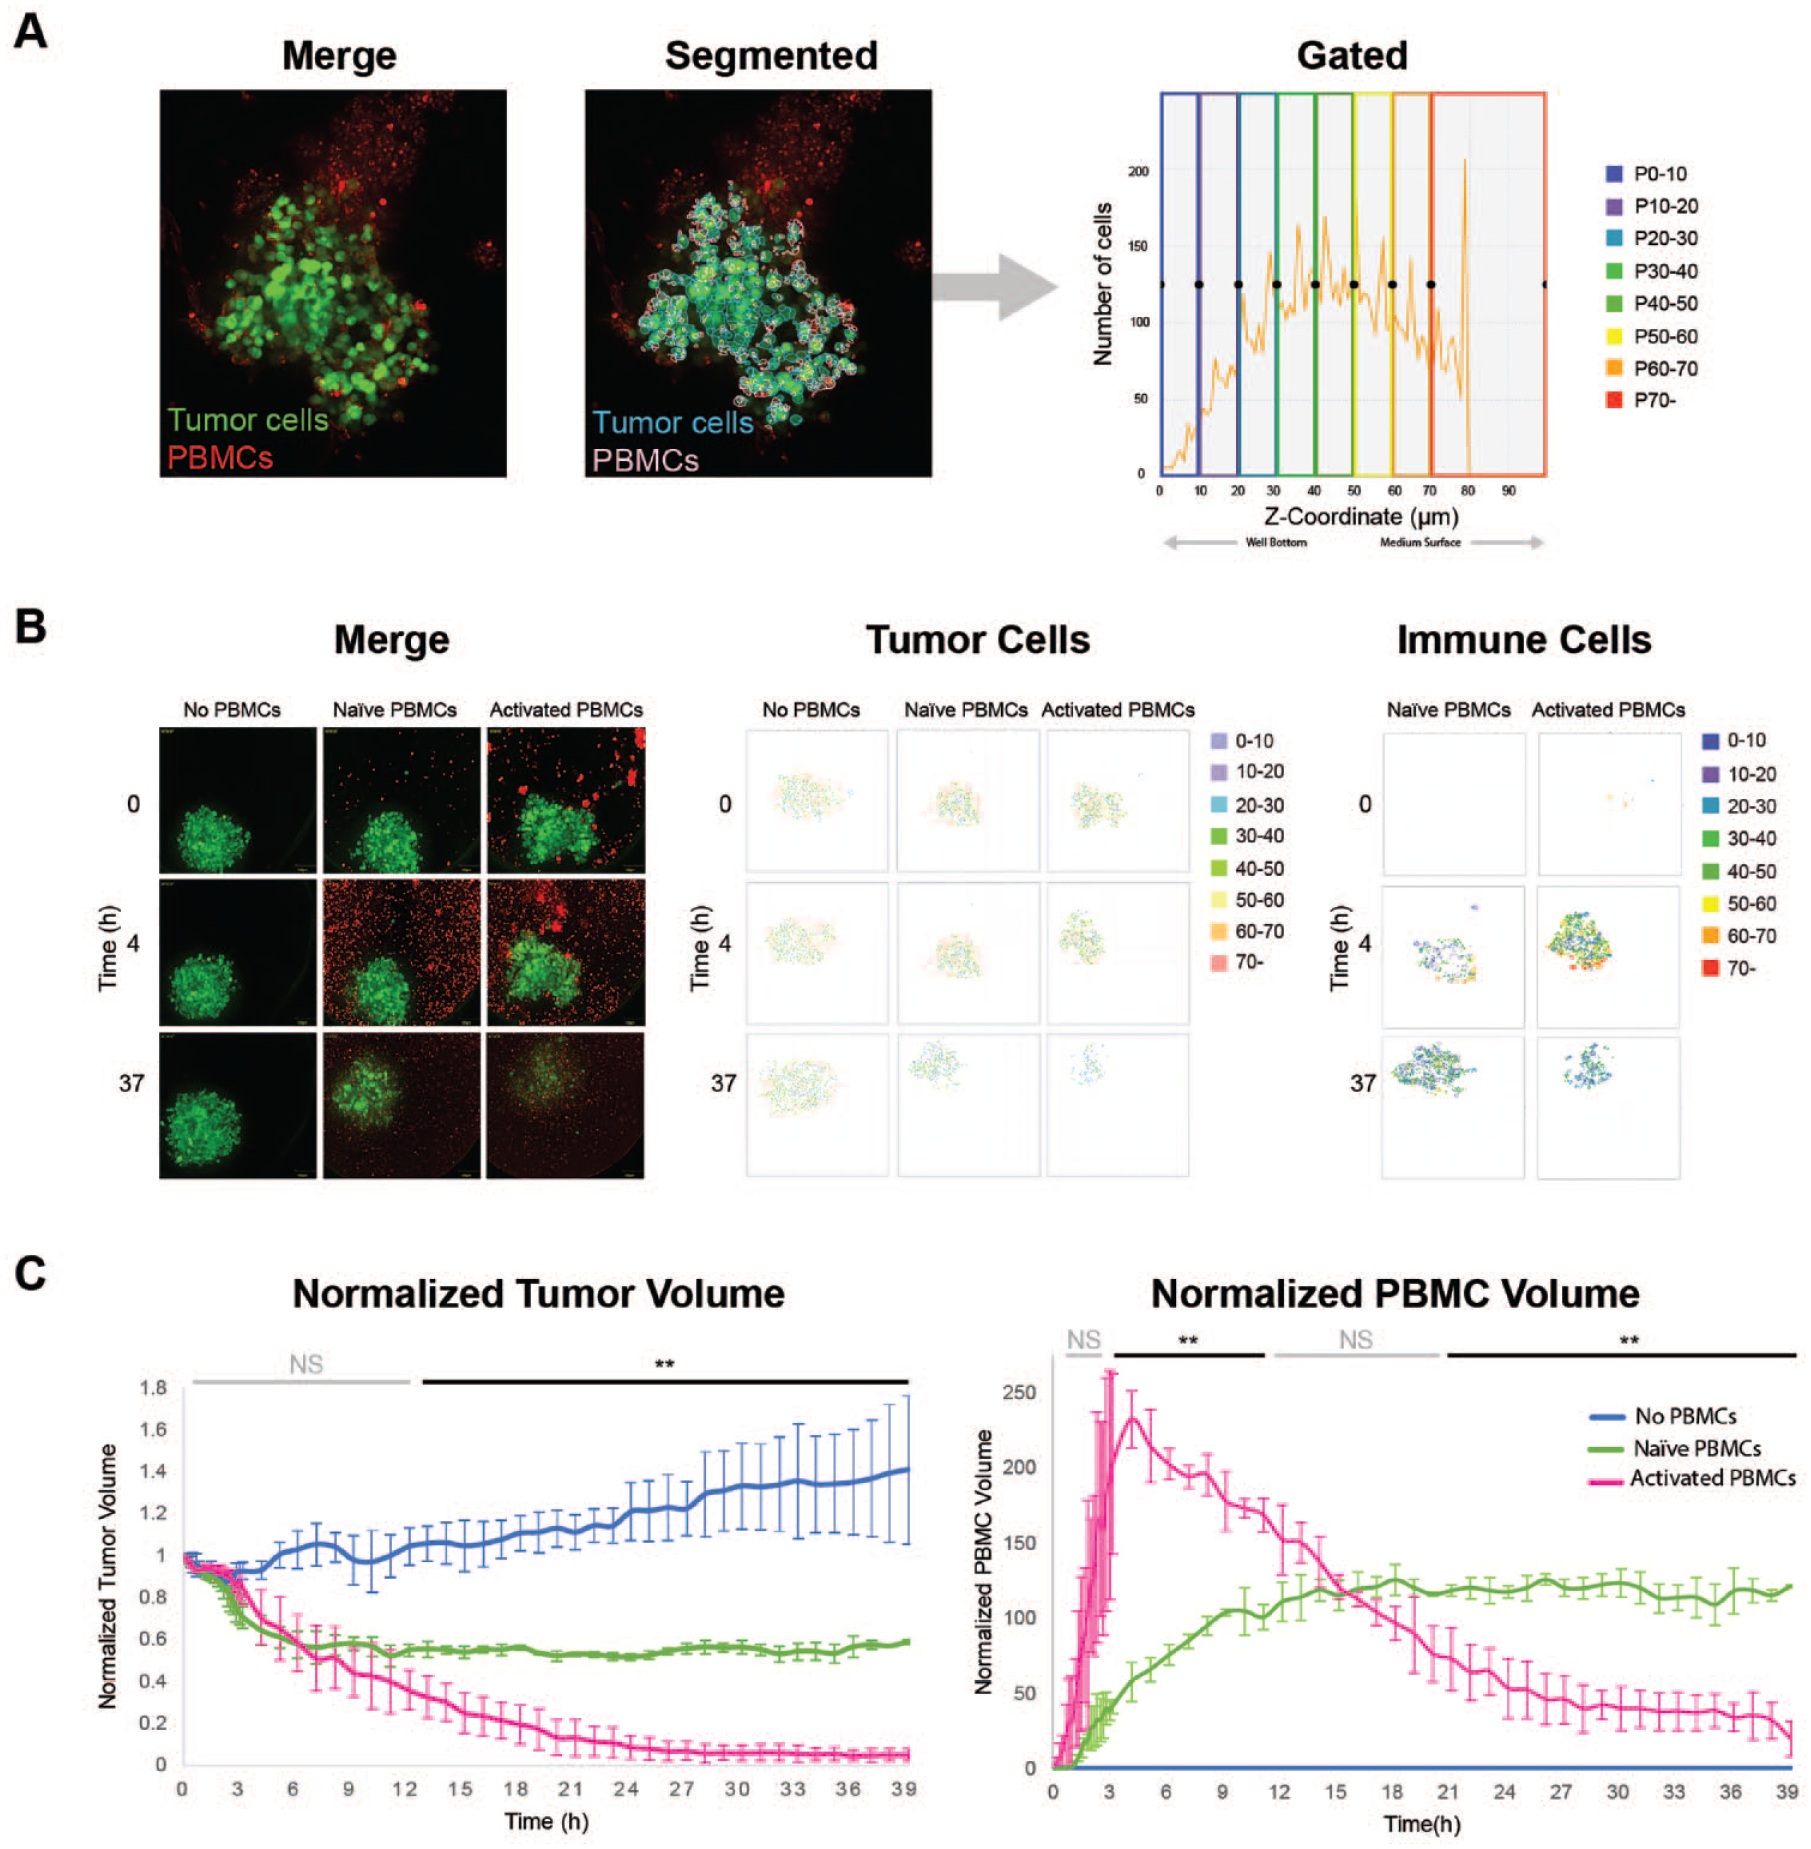
Visualizations of cell centroids were generated for both cell populations. Using centroid visualizations, it is possible to track the XYZ positions of cells belonging to each population in real time. In the untreated group, tumor cells were evenly distributed throughout the spheroid at all timepoints. In the Naïve PBMC group, tumor cells were initially evenly distributed but gradually decreased throughout time. By hour 37, only a small spheroid remained near the bottom of the well. PBMCs in the Naïve group could be observed at or near the microtissue periphery (dark blue and red dots) with the higher concentrations located near the well bottom (dark blue dots). This phenotype is consistent with incomplete immune cell infiltration and partial destruction of the tumor spheroid (
Z-stacks acquired at each timepoint were also used to determine the total volume occupied by both tumor cell and PBMC populations ( Fig. 5C ). The resulting volume data for each treatment group were normalized by dividing the volume measurement at each timepoint by the volume measurement at t = 0. We then plotted the normalized data. The tumor volume measurements followed expected trends: a slow increase in volume throughout time in the untreated group, a modest decrease in volume throughout time in the Naïve PBMC group, and a dramatic decrease in volume throughout time in the Activated PBMC group. By 14 h and continuing through 39 h, a statistically significant difference in tumor volume was observed (p < 0.01) between the Naïve and Activated PBMC groups.
In the immune cell population, the Naïve PBMC volume increased gradually throughout time, suggesting a slow migration of PBMCs to the tumor microtissue. In the Activated PBMC treatment group, the PBMC volume showed an initial sharp increase that peaked at hour 4, followed by a dramatic decrease in PBMC volume at later timepoints. The sharp spike in PBMC volume at the early timepoints was likely the combined effect of active migration of immune cells into the tumor spheroid and proliferation of T cells. The dramatic decrease in Activated PBMC volume at later timepoints may be the result of decreasing spheroid size and a corresponding decrease in tumor-associated PBMCs (i.e., PBMCs within 15 µm of a tumor cell). Alternatively, the loss of PBMC volume could be due to immune cell–specific apoptosis or collateral damage resulting from massive local tumor cell death.
In summary, we were able to monitor the fate of two cell populations in real time (56 timepoints) and in 3D (11 Z-sections/spheroid) without any discernable phototoxicity. Using cell centroid tools, we were able to map physical locations of individual cells belonging to each population that revealed interesting data on their relative positions and interactions. Finally, we were able to calculate tumor and immune cell volumes from individual image stacks that provided new insights regarding the fate of activated immune cells. This assay also sets the stage for additional I-O studies involving engineered T cells (e.g., CAR-T) as well as studies with immunomodulator agents such as bi-specific antibodies and immune checkpoint inhibitors.
A 3D Tumor Co-Culture Model and High-Content Assay for High-Throughput Screening
Identification of new chemical leads typically involves screening large libraries of chemically diverse compounds in a robust biochemical or cellular assay. Used in this context, multicellular 3D models have the potential to identify novel and potentially more efficacious tumor-specific leads. The increased content and resolution afforded by HCI assays (e.g., interrogation of individual cell types or regions within a spheroid and multiparametric output) can enable qualification and prioritization of resulting hits by parameters other than or in addition to potency.
To identify compounds that have tumor-killing and stroma-sparing properties, we developed a multicellular 3D tumor assay compatible with high-throughput screening.
For this screen, we selected a dual-fluorescent-protein-labeled 3D co-culture tumor spheroid model provided in an imaging-compatible 384-well plate. The GFP-labeled NCI-N87 gastric cancer cell line and RFP-labeled NIH3T3-L1 murine fibroblasts were allowed to self-assemble and formed slightly irregular-shaped spheroids with a non-homogeneous organization of tumor and fibroblast domains ( Fig. 6A ). The 384-well plate used for this study had a 25 µm Teflon film bottom designed for improved gas exchange and light transmission. The Yokogawa CV8000 autofocus routine and Olympus 20× objective accept a wide range of bottom thicknesses and were able to accommodate the ultrathin bottom, resulting in focused images for every well ( Fig. 6A ).
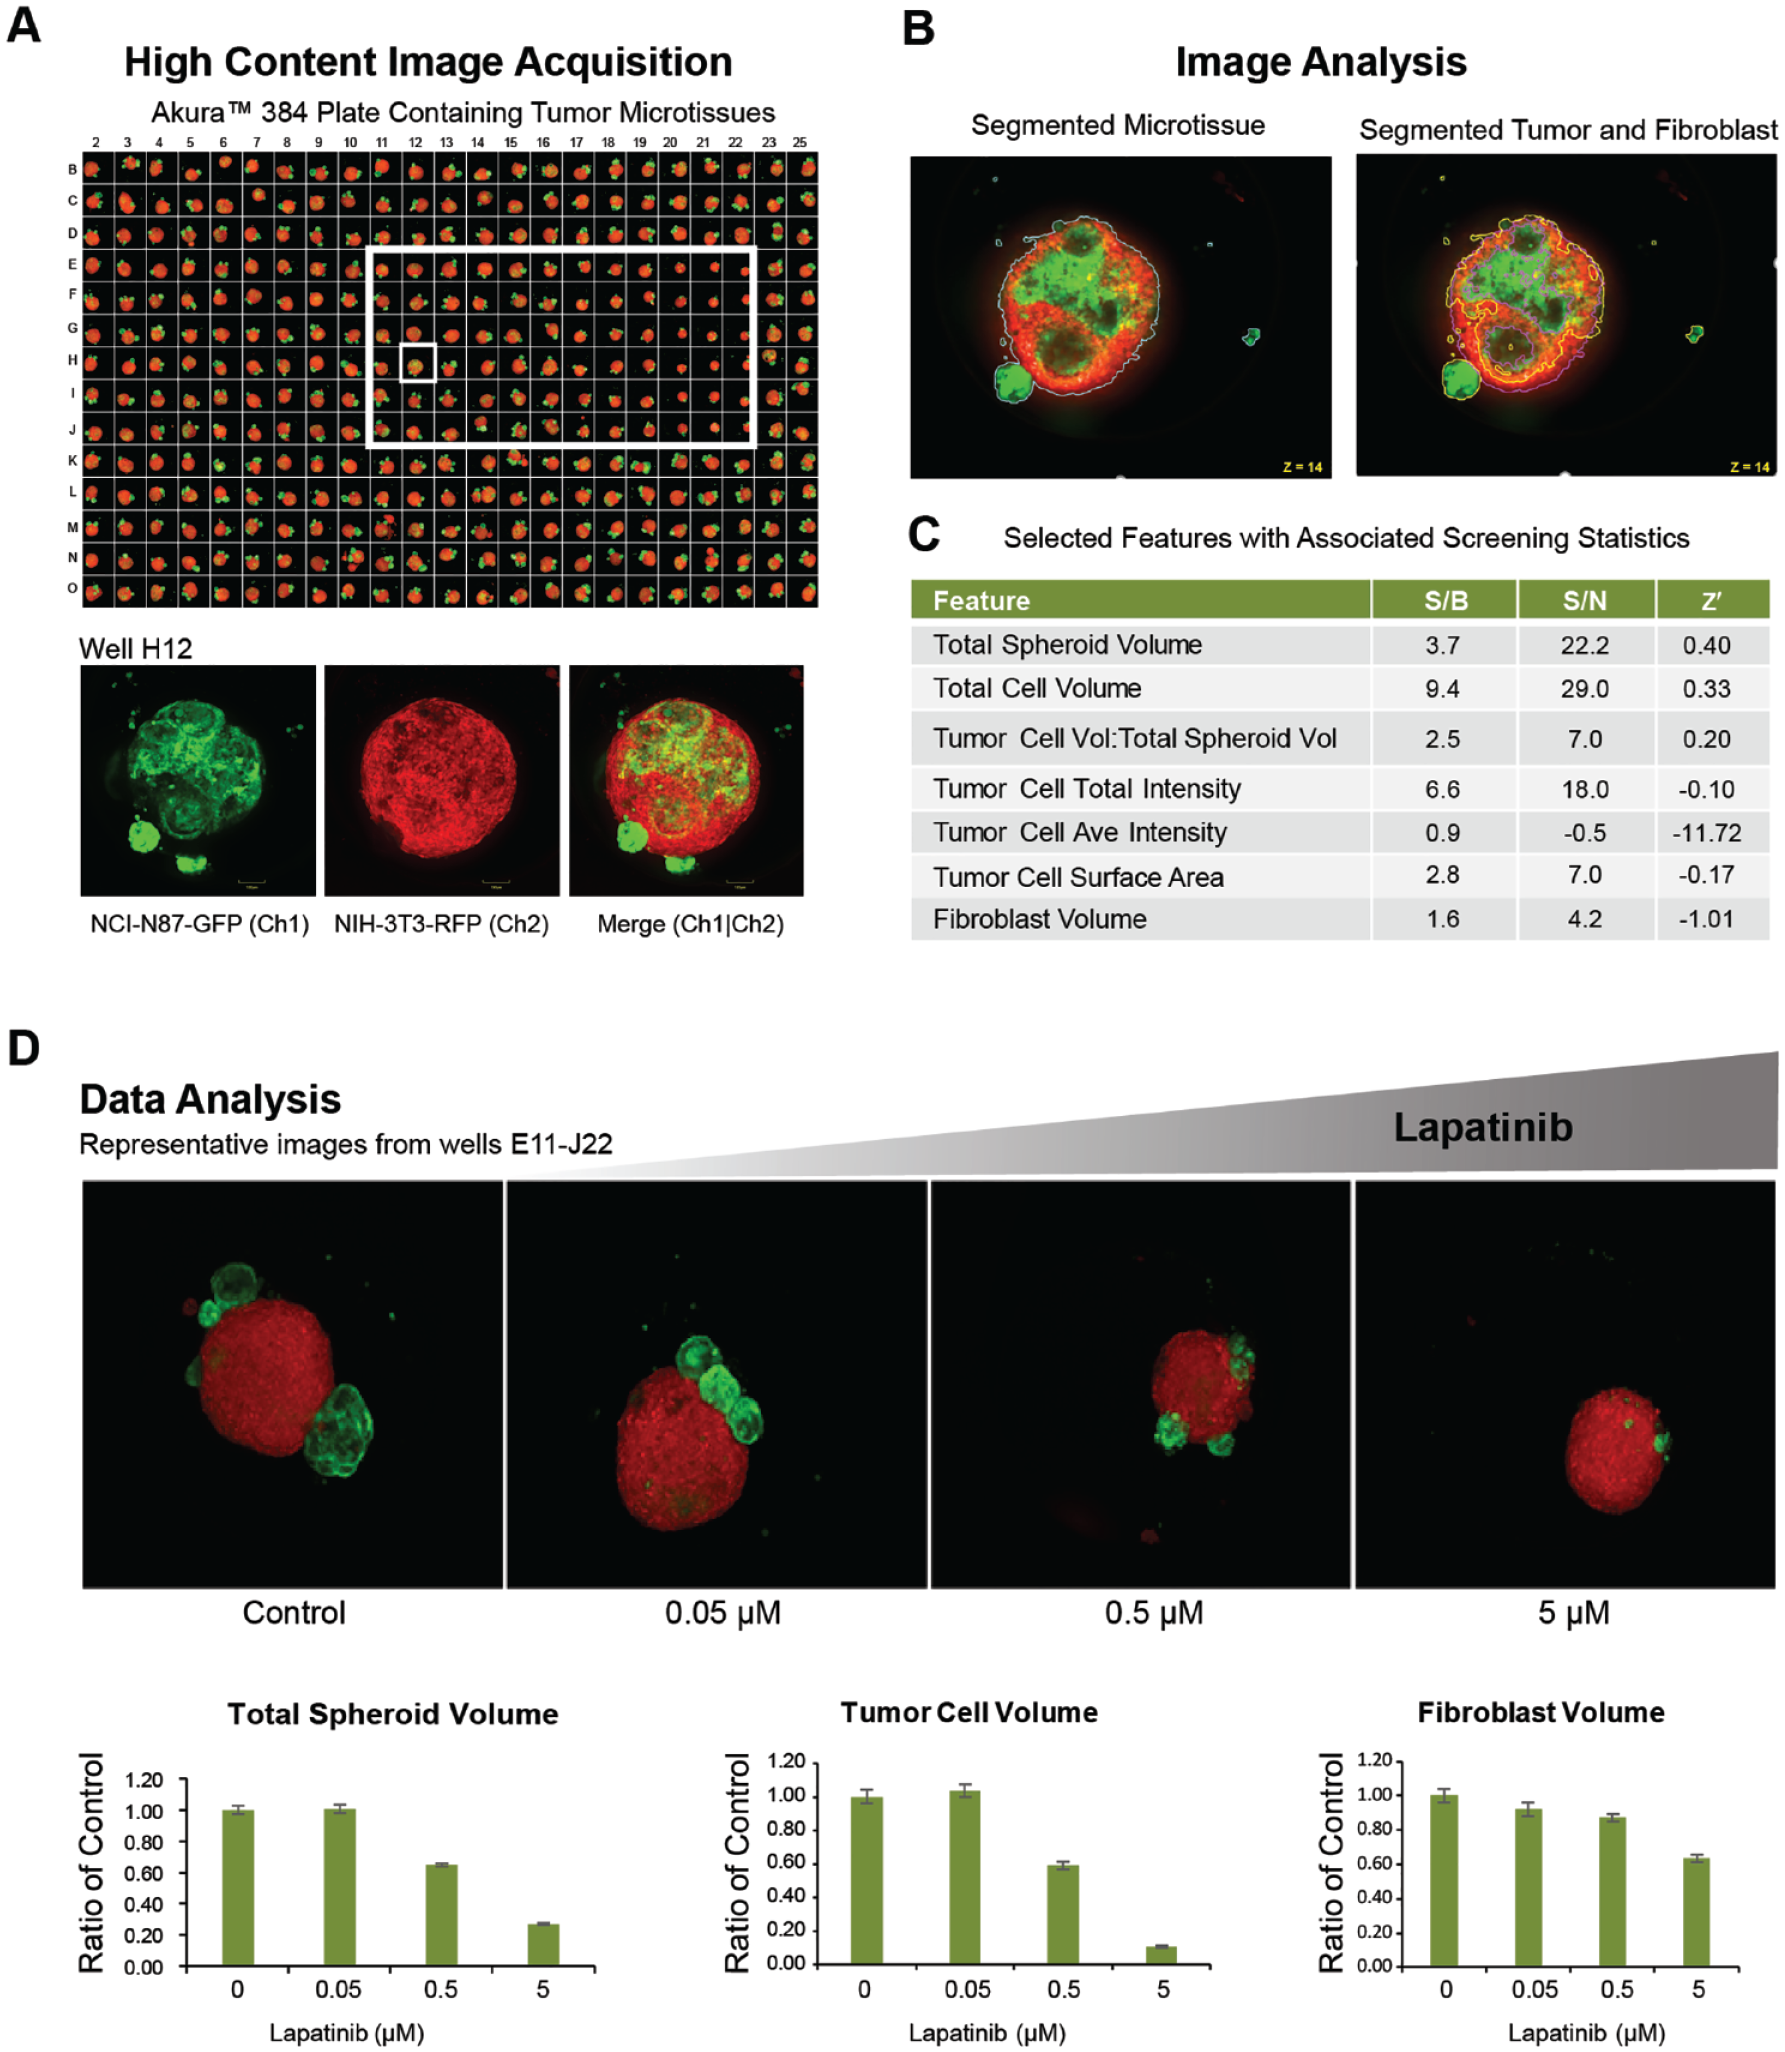
The segmentation of tumor cell regions (GFP positive) and fibroblast regions (RFP positive) was performed on individual Z-sections, and tumor cell and fibroblast cell regions were then merged to identify the total spheroid region (
The multiparametric output data included seven features. To select the most robust endpoint on which to base our assay performance metrics, we evaluated each of these features according to three commonly used screening metrics: Signal/Background, Signal/Noise, and Z prime (Z′). For assay performance calculations, we selected the highest dose of lapatinib to serve as positive control and the vehicle as negative control. Lapatinib showed excellent intraplate reproducibility, dose dependency, as well as tumor specificity in the N87 gastric carcinoma tumor model. According to Z′ calculations, total spheroid volume was the most robust feature and was selected as the assay performance metric for the screen. Lapatinib, a targeted cancer drug, is a dual tyrosine kinase inhibitor that interrupts HER2/neu and epidermal growth factor receptor pathways 39 ( Fig. 6C ).
In summary, the multicellular tumor spheroid model was compatible with the 384-well plate technology, automated processing, and automated 3D imaging (e.g., compatible with a 25 µm thick well bottom) and analysis, and therefore meets the minimum criteria for a screening campaign. The resulting assay meets performance guidelines for an acceptable high-content screen. For complex phenotypic assays, Z′ > 0.5 is considered an excellent assay, 0 < Z′ ≤ 0.5 is considered acceptable, and Z′ < 0 is unacceptable. 40 For the “total tumor volume” parameter, a Z′ = 0.4 was achieved, indicating that an HCA based on volumetric quantitation of specific cell populations in a multicellular 3D model is feasible, thus opening the door for high-resolution screens in complex 3D models.
Discussion
High-content screening in multicellular 3D spheroid models has the potential to improve our current methods of drug selection, but it also presents a unique set of challenges. Recognizing those challenges and then picking the appropriate model, tools, and instrumentation are paramount to the successful implementation of a 3D image-based platform.
Using three multicellular 3D models of varying complexity and imaging assays of varying resolution and throughput, we demonstrated that developing multicellular 3D assays for complex disease model screens is feasible. We used the Yokogawa Cell Voyager CQ1 and Cell Voyager CV8000 HCI analysis platforms for these studies because the instruments met nearly all the imaging specifications we defined. The applications we evaluated included segmentation and analysis of subcellular organelles in a multicellular 3D liver model, subpopulation analysis of tumor cells and infiltrating immune cells in a 4D (3D plus time lapse) assay, and subpopulation analysis of tumor and stroma cells in an assay adapted to a 384-well plate that is both 3D and imaging-compatible.
The successful application of high-resolution HCI to multicellular 3D spheroids opens the door to a plethora of new screening opportunities. Even so, there are limitations to the platform we describe in this article. Some tissues will have higher-order architecture, such as vascularization, specialized compartments, or barrier structures, which is integral to tissue function and cannot be adequately modeled by a 3D spheroid model (e.g., kidney). Disease states that involve multiple organs or the entire body (e.g., metabolic syndrome) may not be adequately modeled by a single tissue type. There also remain technical limitations with regard to light penetration in 3D samples that can compromise the ability to acquire image stacks representing the entire spheroid. Finally, HCI analysis algorithms were originally developed for 2D cell culture applications and can struggle to properly segment individual cells in compact 3D tissues.
Some of these limitations will be addressed by development of more advanced cell models, such as those that incorporate vasculature and “circulating” immune cells. Others will be resolved by the introduction of new technology platforms (e.g., organ-on-a-chip microphysiological systems) or new imaging modalities (e.g., light sheet microscopy and image analysis powered by artificial intelligence).
The driving force behind these technological advances will be the continued development of novel therapeutic approaches and modalities (e.g., biologicals that simultaneously engage more than one cell type or organ and require integrated cell signaling to elicit intended responses) coupled with the ongoing need to improve drug attrition rates. Future advances in all three areas—3D models, 3D culture platforms, and 3D imaging—will be required to more effectively evaluate drugs and drug combinations in the context of these complex responses.
Supplemental Material
Wardwell-Swanson-et-al_supplemental_materials – Supplemental material for A Framework for Optimizing High-Content Imaging of 3D Models for Drug Discovery
Supplemental material, Wardwell-Swanson-et-al_supplemental_materials for A Framework for Optimizing High-Content Imaging of 3D Models for Drug Discovery by Judith Wardwell-Swanson, Mahomi Suzuki, Karen G. Dowell, Manuela Bieri, Eva C. Thoma, Irina Agarkova, Francesca Chiovaro, Silvan Strebel, Nicole Buschmann, Frauke Greve and Olivier Frey in SLAS Discovery
Footnotes
Supplemental material is available online with this article.
Declaration of Conflicting Interests
The authors declared the following potential conflicts of interest with respect to the research, authorship, and/or publication of this article: JW-S, KGD, MB, ECT, IA, FC, SS, NB, FG, and OF are employed by InSphero AG, and their research and authorship of this article were completed within the scope of their employment with InSphero AG. MS is employed by Yokogawa Electric and her research and authorship of this article was completed within the scope of her employment with Yokogawa.
Funding
The authors received no financial support for the research, authorship, and/or publication of this article.
References
Supplementary Material
Please find the following supplemental material available below.
For Open Access articles published under a Creative Commons License, all supplemental material carries the same license as the article it is associated with.
For non-Open Access articles published, all supplemental material carries a non-exclusive license, and permission requests for re-use of supplemental material or any part of supplemental material shall be sent directly to the copyright owner as specified in the copyright notice associated with the article.