
Abstract
In this study, the development of an image-based high-content screening (HCS) binding assay for the seven-transmembrane (7TM) receptor Smoothened (Smo) is described. Using BacMam-based gene delivery of Smo, BODIPY-cyclopamine as a fluorescent probe, and a confocal imaging system, a robust 384-well assay that could be used for high-throughput compound profiling activities was developed. The statistically robust HCS binding assay was developed through optimization of multiple parameters, including cell transduction conditions, Smo expression levels, the image analysis algorithm, and staining procedures. Evaluation of structurally diverse compounds, including functional Smo activators, inhibitors, and related analogs, demonstrated good compound potency correlations between high-content imaging binding, membrane fluorescence polarization binding, and gene reporter assays. Statistical analysis of data from a screening test set of compounds at a single 10-µM concentration suggested that the high-content imaging Smo binding assay is amenable for use in hit identification. The 384-well HCS assay was rapidly developed and met statistical assay performance targets, thus demonstrating its utility as a fluorescent whole-cell binding assay suitable for compound screening and profiling.
Keywords
Introduction
The mammalian Hedgehog (Hh) signaling pathway has been implicated in a wide range of developmental processes, including cell proliferation, differentiation, stem cell maintenance, and regulation of adult tissue repair.1,2 The Hh pathway is therapeutically relevant because abnormally high Hh pathway activity has been implicated in several cancer types, such as basal cell carcinoma, medulloblastoma, pancreatic cancer, small cell lung carcinoma, and rhabdomyosarcoma.3,4 Of the three mammalian Hh proteins—Sonic Hedgehog (Shh), Indian Hedgehog (Ihh), and Desert Hedgehog (Dhh)—Shh has been the most widely studied. Hh proteins are small lipid-modified proteins that bind to Patched (Ptc), a 12-transmembrane (TM) receptor, whose inhibition of Smoothened (Smo) is relieved upon binding Shh. How Ptc regulates Smo, a 7-transmembrane (7TM) receptor, remains unclear, but it has been shown that the binding of Shh to Ptc allows Smo to transmit an intracellular signal resulting in the activation of Gli transcription factors. The Gli transcription factors regulate numerous target genes involved in cell growth, cell fate, stem cell maintenance, and the epithelial-to-mesenchymal transition. Although the Gli transcription factor pathway is the canonical Hh signaling pathway, numerous studies have been aimed at describing Smo G-protein signaling due to the 7TM G-protein-coupled receptor (GPCR)–like structure of Smo. The role for G-protein signaling pathways downstream of Smo remains somewhat unclear, perhaps because of cell type differences, differences between Drosophila and vertebrates, or because Smo results in ERK activation and not the typical Gαs, Gαi, or Gαq signals.5–8 As a result, assays used to detect the effect of agonists or antagonists on Hh signaling have been mainly focused on Gli transcription factor-based reporter assays and Smo ligand binding assays9–11 rather than on detection of classical GPCR signaling pathways.
We previously demonstrated that Smo ligands purmorphamine, SAG1.3, SANT-1, and SANT-2 were competitive with cyclopamine in classical radioligand binding assays and displayed similar activities in a 384-well high-content imaging assay using BODIPY-cyclopamine as the fluorescent probe. 12 The Smo antagonist cyclopamine has been shown to specifically inhibit Smo function by direct binding, 10 and BODIPY-labeled cyclopamine has been previously used to observe specific Smo expression with flow cytometry and fluorescence microscopy.10,13
In this study, we describe the details of the development of the 384-well high content screening (HCS) image-based whole cell binding assay using cells transiently expressing Smo. The image-based binding assay has several advantages over traditional radioligand binding assays, such as lower health risks, and avoiding the costs associated with radioactive waste disposal and the time required to produce membrane preparations. There was also potential utility in looking at the subcellular localization of the Smo receptor in the context of biological activity. An FP binding assay based on the same reagents as the imaging assay was also tested, to potentially extend the fluorescent binding assay capability to an even higher throughput format. Compound activities in the binding assays were compared to those in a Gli-reporter assay so that the correlation between binding and cellular functional activities could be determined.
BacMam, an effective gene delivery and expression system with a wide mammalian host cell range, was used to express Smo in HEK MSRII cells. BacMam is a modified recombinant baculovirus that we have frequently used as a finely titratable transient expression system to express drug discovery targets to develop statistically robust compound screening assays.14–16 The HCS assay procedure was further simplified and optimized with the use of assay-ready cryopreserved cells that could be thawed, directly transduced with BacMam, and plated for the assay.
To demonstrate the utility of the image-based competition binding assay for the evaluation of compound structure-activity relationships, additional analogs were synthesized around the purmorphamine, SAG, SANT-1, and SANT-2 compounds (shown in online
Materials and Methods
Materials
Fetal bovine serum was purchased from SAFC Biosciences (Lenexa, KS), and Cellgro penicillin/Streptomyces solution, Dulbecco’s modified Eagle’s medium (DMEM)/F12, and Hank’s buffered salt solution (HBSS) buffer were from Mediatech (Manassas, VA). Black-walled clear-bottom poly-D-lysine-coated plates and polypropylene V-bottom plates for compound preparation were purchased from Greiner Bio-One (Longwood, FL; cat. 781946 and 781280, respectively). DMSO (cat. D2438), casein (cat. C-4765), HEPES sodium salt (cat. H-3784), and pluronic F-127 were purchased from Sigma (St. Louis, MO).
BODIPY-cyclopamine was purchased from Toronto Research Chemicals (North York, Ontario, Canada; cat. B674800), and SYTO 63 was from Invitrogen (Carlsbad, CA; cat. S11345).
Compounds
GlaxoSmithKline (GSK) chemical compounds, SAG1.3, and SANT-2, were synthesized by Discovery Medicinal Chemistry Department at GlaxoSmithKline (Research Triangle Park, NC). SANT-1 was purchased from TOCRIS (Ellisville, MO), and purmorphamine was from Calbiochem (San Diego, CA). Compound structures are shown in online
BacMam Virus Generation and Cell Culture
The human Smo BacMam virus was constructed as previously described.12,17
The host HEK293-MSRII (MSRII) cell line used for Smo BacMam transduction for the image-based assay was derived at GSK from ATCC CRL-1573 18 ; it is also available commercially as GripTite from Invitrogen (cat. R795-07). These cells express the human macrophage scavenger receptor, which confers the ability of cells to strongly adhere to tissue culture flasks and assay plates. To prepare HEK293-MSRII assay-ready frozen cells, cells were propagated in cell stacks (14 × 6360; Corning, Corning, NY; cat. 3270) in DMEM/F12/10 mM HEPES supplemented with 10% fetal bovine serum (FBS), 0.365 g/L glutamine, and 400 µM G418; harvested with 0.25% trypsin/1 mM EDTA; and spun at 1100 rpm (250 g) for 10 min. Harvested cells were then centrifuged, frozen in a controlled rate freezer, and thawed for assays as previously described. 19 The NIH/3T3 Gli-β-lactamase cells for the reporter assay were grown as described previously. 12
HCS Binding Assay
MSRII frozen cells were thawed, washed, and diluted with cell culture medium to a density of 3 × 10⁵ cells/mL and transduced with Smo BacMam (titer 1.7 × 10⁸ plaque-forming units [PFUs]) by adding the indicated percent (volume virus/volume cell mixture) of Smo BacMam virus. The multiplicity of transduction (MOT) was 5.7 at the cell density plated in the presence of 1% virus. Cells plus virus were gently mixed, plated at 1.5 × 10⁴ cells/well with a multidrop (Thermo Scientific, Waltham, MA) into 384-well microplates (Greiner Bio-One, Monroe, NC; cat. 781280), and incubated 20 to 24 h at 37 °C and 5% CO2. The imaging assay was performed as follows: For the no-wash assays described in Figure 1A , C , media were removed, cells were fixed with 3.7% formaldehyde in HBSS, fixative was removed, and cells were stained with 2 µM SYTO 63 and 25 nM BODIPY-cyclopamine with compound or DMSO control (20 µL 4 µM SYTO 63, 10 µL 100 nM BODIPY-cyclopamine, 10 µL compound or DMSO per well). Plates were incubated for 2 h at room temperature and imaged on the Opera HCS system (PerkinElmer, Waltham, MA). For the wash protocol that gave specific BODIPY-cyclopamine binding to Smo, the SYTO 63 and BODIPY-cyclopamine were washed out after the 2-h incubation with four to five changes of 80 µL HBSS buffer over the course of 1 h before imaging. Stock solutions of 5 mM SYTO 63 in HBSS and 1 mM BODIPY-cyclopamine in 100% methanol were diluted in HBSS for working solutions. Then, 10-mM compound stocks in DMSO were serially diluted in DMSO threefold in 384-well polypropylene V-bottom plates, stamped as 1- or 2-µL daughter stamps, and diluted with 25 or 50 µL HBSS buffer for working assay plates. Aspiration steps for removal of media or buffer were done with a Tecan (Männedorf, Switzerland) washer and dispensing steps with a Multidrop (Thermo Electron Corporation, Waltham, MA) or Cybi-well (Cybio, Jena, Germany).
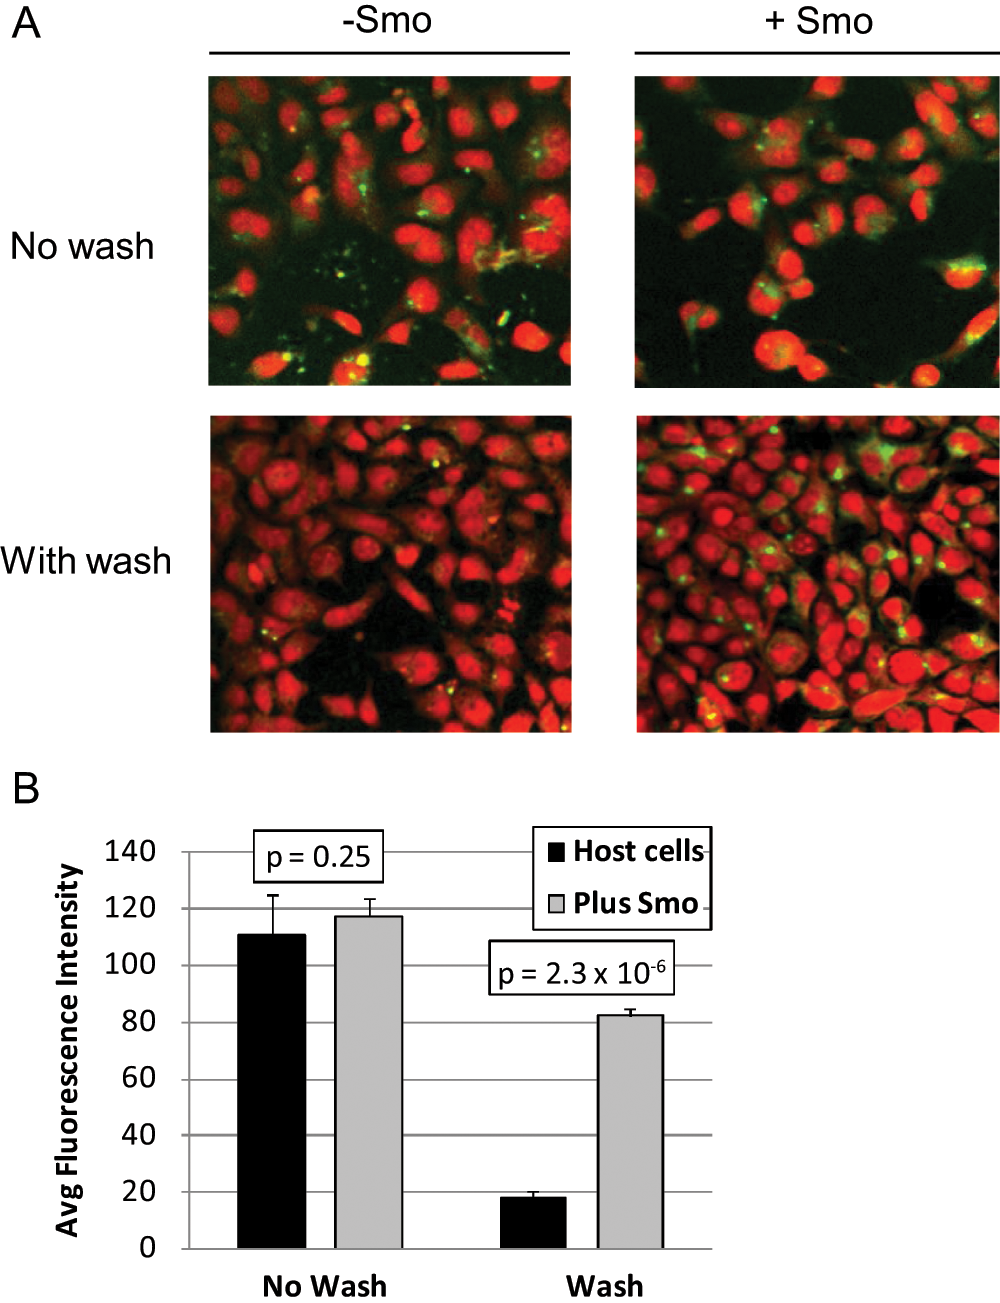
Development of specific BODIPY-cyclopamine staining conditions. Images were collected with a 20× objective. (
Images were captured on the Opera with one exposure and two lasers (488 nm and 635 nm), optimizing laser power and exposure times for image quality and avoiding saturation and crosstalk between color channels. One field for each well was imaged (average of approximately 600 cells per well for analysis with the 10× objective) unless otherwise indicated in the figure legends. The instrument’s Acapella software image analysis algorithm parameters were optimized with object selection rules to reject abnormal objects by size, intensity, and location within the image frames. It took approximately 12 min to complete the image acquisition and data output for one 384-well plate. Prepared plates were stable for up to 24 h at room temperature, so the 12-min plate read time did not adversely affect the results in terms of the difference in time between reading the first and last wells of each assay plate.
FP Binding Assay
Preparation of membranes was as described previously for radioligand binding assays. 12 For the FP assays: FP buffer contained 25 mM HEPES (pH 7.4), 0.01% Pluronic F-127, and 0.02% casein prepared from 1 M HEPES (pH 7.4), 5% Pluronic F-127 (weight/vol in water), and 5% casein (weight/volume in water) stock solutions. Then, 100-nL compounds from 10-mM stocks or 100 nL 0.5 mM SAG1.3 prepared in DMSO for 100% inhibition control wells were dispensed into black 384-well low-volume plates (Greiner Bio-One; cat. 784076) using a hummingbird (Digilab, Hollison, MA). Membranes were diluted in FP buffer to 0.04 mg/mL protein, and 5 µL/well was dispensed into plates onto the compounds with a Multidrop Micro (Thermo Electron Corporation). Next, 5 µL/well of 10 nM BODIPY-cyclopamine was added to each well with a Multidrop Micro. Plates were spun at 500 rpm for 1 min in a tabletop centrifuge and incubated at room temperature for 3.5 h, and the fluorescence polarization signal was read with an Analyst GT reader from Molecular Devices (Sunnyvale, CA). The mP values were used in a four-parameter logistic fit to calculate the compound IC50 data.
Gli-β-Lactamase Reporter Assay
The reporter assay was performed as previously described. 12 Compounds were prepared as 5-mM DMSO stocks and serially diluted threefold in DMSO in polypropylene 384-well plates (Greiner Bio-One; cat. 781280). Daughter plates were prepared from the source serial dilution plate (1 µL/well) with a Cybi-well (Cybio), and 50 µL HBSS buffer/well was added with a Multidrop. From this intermediate plate, 5 µL per well was added to the cell assay plate with a Cybi-well. Plates were then incubated for 40 to 48 h and treated as described.
Data Analysis
Dose-response curves were analyzed with GraphPad Prism (GraphPad Software, La Jolla, CA) or Excel XC50 module (Microsoft, Redmond, WA).
Z′ calculation was done with the following equation 20 :

where the highs and lows represent high and low assay signals, respectively. Robust Z′ (rZ′) values were calculated using 16 wells (1 column of a 384-well plate) for each high and low condition, where up to two outlier values were eliminated for the “robust” values. For the imaging assay, the highs were cells stained with BODIPY-cyclopamine, and the lows were cells stained with BODIPY-cyclopamine in the presence of 10 µM SAG1.3 competitor compound.
Percent inhibition cutoffs and hit rate determination were based on the following:

The hit rate was then calculated based on the number of compounds qualifying as hits out of 1408 total tested: hit rate = (# hits/1408) × 100.
Results
Establishing specific binding conditions for BODIPY- cyclopamine
To develop an image-based HCS binding assay using the fluorescent BODIPY-cyclopamine probe, it was important to establish assay conditions under which specific binding of the BODIPY-cyclopamine probe was observed. The BacMam expression system offered an advantage in that host cells and cells transduced with Smo BacMam could be compared. The MSRII cell line was chosen as a cell line host for Smo BacMam expression because it is an easily transduced human cell line and stably expresses MSRII, making it more adherent, allowing for better performance in plate-based assays involving wash steps. 18 In Figure 1A , results from both no-wash and wash protocols for BODIPY-cyclopamine staining are shown, where host cells or cells transduced overnight with 10% (vol/vol cell suspension) Smo BacMam were fixed and incubated with 25 nM BODIPY-cyclopamine probe. The cells were also counterstained with the red fluorescent nuclear stain SYTO 63 so that all cells could be identified. Example images ( Fig. 1A ) revealed that most cells were labeled in the cytoplasm by BODIPY-cyclopamine under no-wash conditions in the presence or absence of Smo BacMam. In contrast, under wash conditions, a greater number of cells with higher cytoplasmic BODIPY-cyclopamine staining were observed in the presence of Smo BacMam compared with untransduced cells. To quantify BODIPY-cyclopamine binding, an image analysis algorithm was used in which the cytoplasmic regions of the cells were identified based on the SYTO 63 counterstain, and the average intensity of the BODIPY-cyclopamine fluorescence in these regions was measured. In the quantified image data, a clear difference between the transduced and untransduced cells was observed when wash steps were added after incubation with BODIPY-cyclopamine, whereas no significant quantitative difference was observed in the absence of wash steps ( Fig. 1B ).
These experiments established the background fluorescence attributable to the host cells and allowed the fluorescence intensity thresholds to be set in the imaging assay. The background levels of fluorescence observed in the host cells were very low and were assumed to represent either very low or no expression of the Smo receptor in the untransduced host cells. The signal/background observed was greater than fourfold, which was sufficient for proceeding with the development of an image-based binding assay.
Binding competition experiments
Using the conditions under which specific binding of the fluorescent Smo probe was observed, a known Smo ligand was tested to show that the assay could be used for competition binding studies. In Figure 2A , B , SANT-2, a compound identified in a functional cell reporter assay and shown to compete with BODIPY-cyclopamine in a flow cytometric assay, 11 was tested in HCS binding competition experiments run under the no-wash and wash conditions. Although there was minimal difference between the Smo transduced and untransduced cell samples under no-wash conditions, specific SANT-2 binding competition was observed with the wash conditions ( Figure 2A vs 2B ).
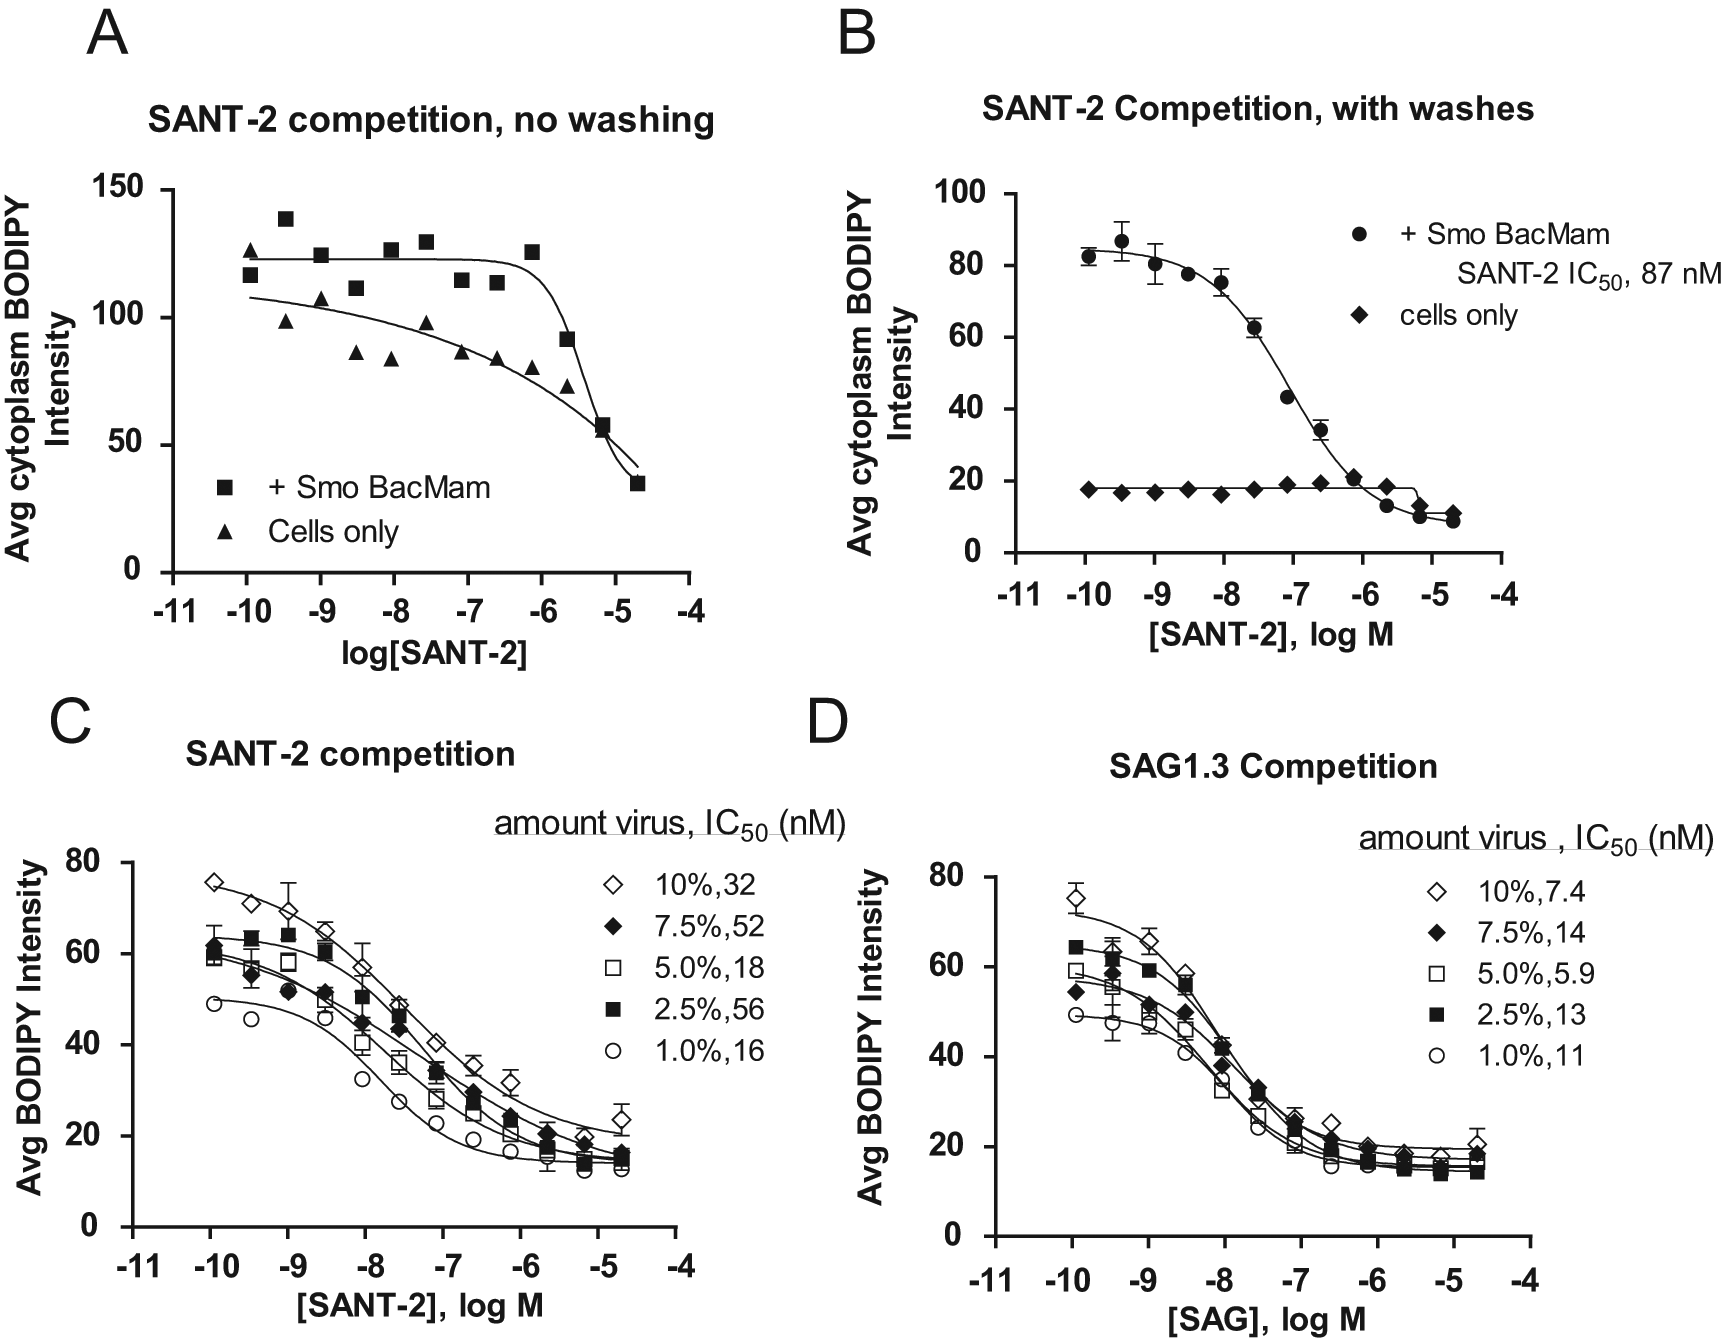
Optimization of compound competition binding assays. No-wash (
The data shown in Figure 2A also show the importance of establishing Smo-specific binding conditions before running a competition assay. In this case, the unlabeled SANT-2 compound appeared to “compete” off the BODIPY-cyclopamine in the untransduced cell sample in the no-wash condition, which could mislead one to believe that the binding was specific. In addition, it should be pointed out that with fluorescence imaging, there is always some background level of fluorescence composed of both autofluorescence from the biological sample and potentially some nonspecific binding of the probe. In these experiments, overexpression of Smo with BacMam was key in establishing experimental conditions that gave very specific binding of the BODIPY-cyclopamine to Smo. These initial experiments also suggested that the Smo BacMam reagent was giving rise to Smo receptor in cells, functionally able to bind known ligands.
BacMam titration experiments
HEK-293 and MSRII cells display high BacMam transduction efficiencies and target gene expression, which is titratable with BacMam virus concentrations and transduction conditions.14,15 Therefore, optimization of the BacMam transduction levels and conditions is an important step in assay development to identify pharmacologically relevant responses (potency and efficacy) and statistical reproducibility. To optimize the Smo BacMam transduction conditions, varying amounts of Smo BacMam virus were added to MSRII cells overnight, and results from HCS binding competition experiments with SANT-2 (Smo inhibitor) and SAG1.3 (Smo agonist) were compared ( Figs. 2C , D ). The data indicated that increased average fluorescence intensities were observed with the higher levels of Smo BacMam, from approximately 45 average intensity units at the 1% transduction level to approximately 75 in the 10% transduction samples. The SAG1.3 and SANT-2 IC50 potencies remained relatively similar at all Smo expression levels, ranging from 8.4 to 12 nM for SAG1.3 and from 16 to 64 nM for SANT-2 in the experiments shown. Although all of the BacMam transduction levels tested showed specific Smo binding results and similar signal over background ratios (not shown), the levels of Smo BacMam chosen for future experiments were within the 2.5% to 5% BacMam range (MOT of 14–29). Under those BacMam transduction conditions, excellent specific binding was observed, without any reduction in cell number per well, which was sometimes observed at BacMam transduction levels higher than 5% (data not shown).
Image analysis and image capture optimization
Many parameters for optimization of image analysis and image capture may be considered during the development of an HCS assay. The identification of subcellular compartments, rules for the selection of the objects analyzed, and the selection limits for objects in terms of size and fluorescence intensities (gating) must all be specified in the image analysis algorithms.
Two different options for image analysis were considered, based on the spotty appearance of the Smo receptor staining pattern in the cytoplasmic regions of cells ( Figs. 1A , 3A , F ). The BODIPY-cyclopamine intensity could be calculated based on the average intensity within the whole cytoplasmic region of the cells within a field of view, or on the average intensity only within the intracellular spots. The initial studies had been conducted using the entire cytoplasmic regions to calculate the average BODIPY-cyclopamine intensities. Using the Acapella software for the Opera instrument, a spot detection image analysis algorithm was developed, where spots smaller than whole cells and of higher intensity than background were identified and quantified. Figure 3 shows image analysis software views for the identification of the various subcellular regions. The red SYTO 63 counterstain was used to mask all cells and to identify the cytoplasmic and nuclear regions. Although SYTO 63 is a DNA stain, it sufficiently stained the cytoplasmic regions under the conditions used to allow cell borders to be outlined. Figure 3A shows a color overlay of the green (Smo receptor detected with BODIPY-cyclopamine) and red (SYTO 63 counterstain) channels, and Figure 3B , C shows the image analysis software identification of the cytoplasmic and spot regions after optimization of the image analysis algorithms. The different cellular regions were identified clearly and accurately, as shown by the outlines in contrasting colors in each panel. In Figure 3D , E , the BODIPY-cyclopamine average intensities were plotted with data from both the cytoplasmic and spot detection image analysis algorithms for SANT-1 and SANT-2 competition curves. The data showed that both image analysis approaches gave similar IC50 values for SANT-1 and SANT-2.
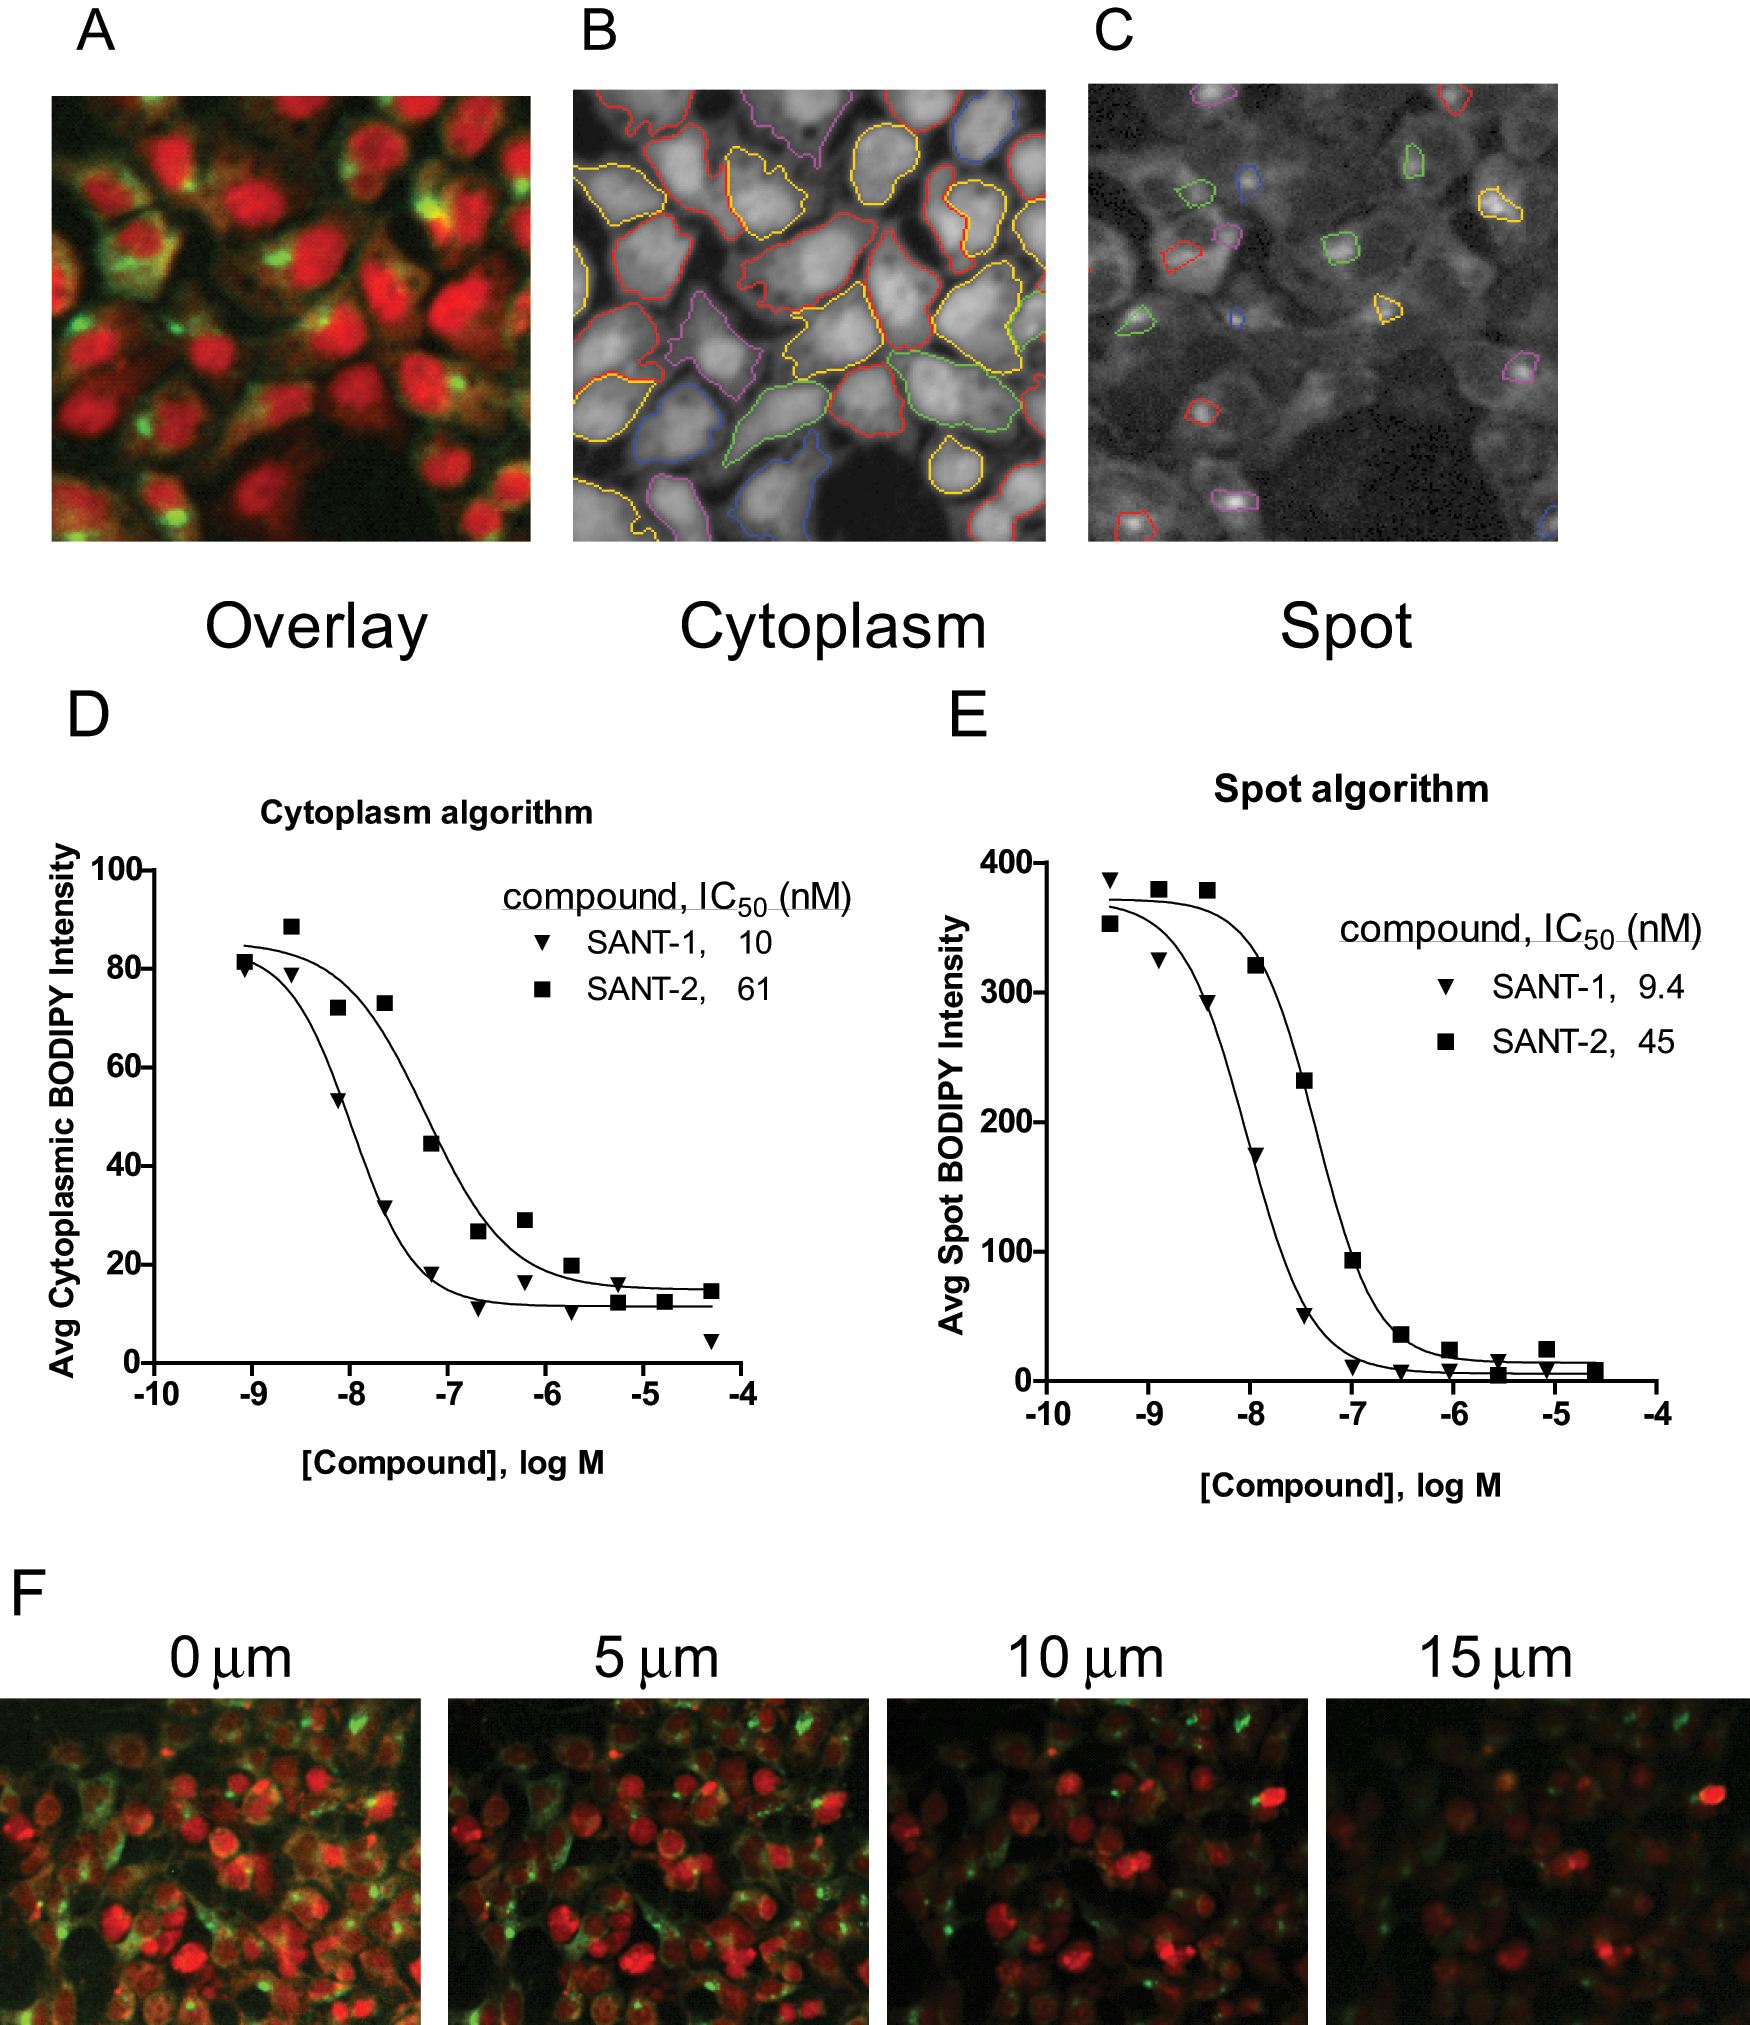
Image analysis optimization. Panels
In addition to testing the two image analysis methods, 10× and 20× magnification objectives were also compared. IC50, signal/background (S/B), and rZ′ data for SANT-2, KAAD-cyclopamine, SAG1.3, and HhAg1.5 from image analyses at the two magnifications tested are shown in Table 1 . The fluorescence intensities and S/B values were higher using the spot detection algorithm than with the cytoplasm analysis method, whereas the IC50 values obtained with the two methods were comparable. The data also showed higher robust rZ′ statistics with the 10× objective (0.71 and 0.69; spot and cytoplasmic analyses, respectively) compared with the 20× objective (0.50 and 0.44). Although all of the data met the rZ′ target of greater than 0.4, the spot detection algorithm using the 10× magnification objective was chosen for future image analyses because these conditions showed the highest S/B and rZ′ results regardless of the competitive ligand used.
Comparison of Spot and Cytoplasmic Analysis Algorithms
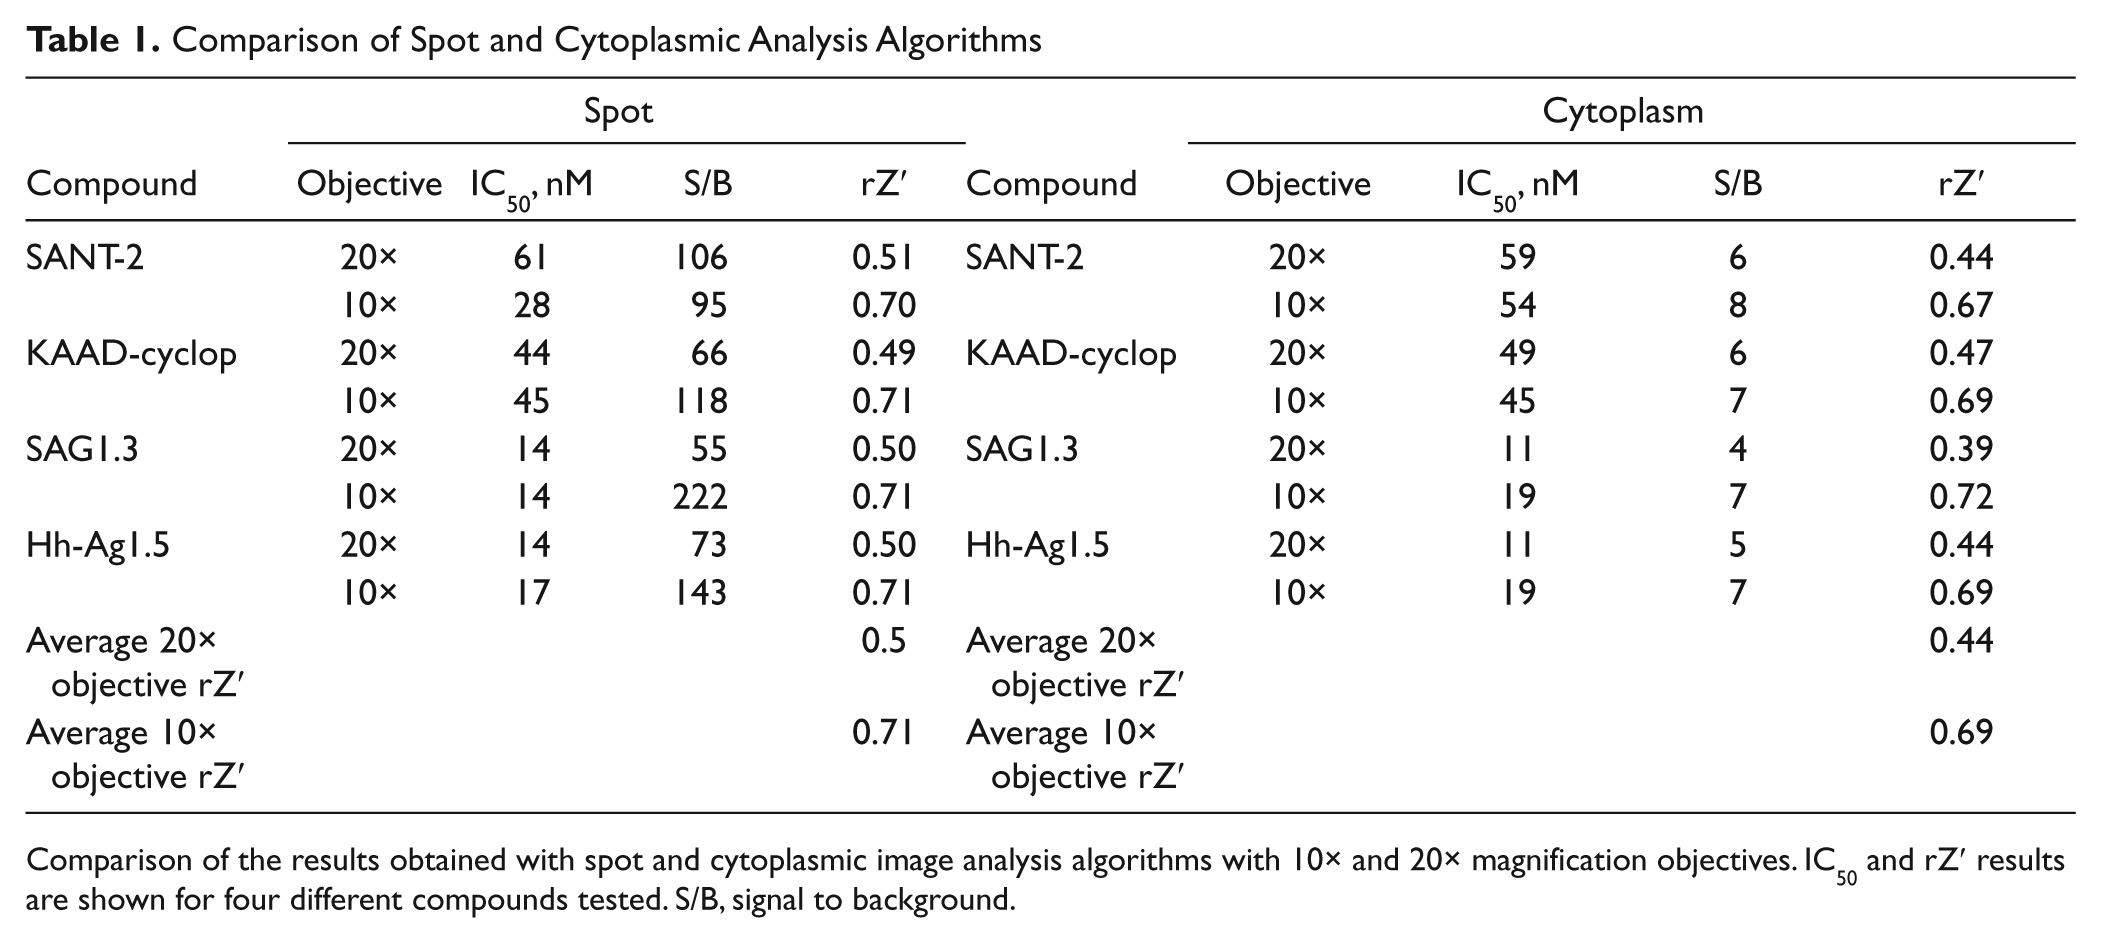
Comparison of the results obtained with spot and cytoplasmic image analysis algorithms with 10× and 20× magnification objectives. IC50 and rZ′ results are shown for four different compounds tested. S/B, signal to background.
In addition to optimization of the Smo expression level, it was also noted that the image acquisition focal height influenced the level of BODIPY-cyclopamine detected with the Opera instrument. The focal height instrument setting, although intended to reflect focal distance from the inside surface of the assay plate, did not precisely reflect an absolute position due to instrument drift over time but provided relative positioning information. Images taken from the same field of view but at different focal heights are shown in Figure 3F . In these images, the highest fluorescence levels were detected at the 0-µm height setting and the lowest fluorescence intensities at the 15-µm setting. With drifting in absolute position over time and different batches of 384-well plates, the focal height setting was adjusted periodically to obtain the highest fluorescence levels, which gave the best statistics and highest S/B values for the assay (data not shown).
Compounds synthesized
As is the case with most 7-TM proteins, structural/X-ray crystallographic information for Smo was not available to guide structure-based medicinal chemistry efforts. It had been previously established that the natural product cyclopamine could bind to the heptahelical transmembrane bundle of Smo, 10 and by inference, ligands competitive with cyclopamine presumably should bind to the same receptor domain. Binding data for SANT-1, SANT-2, and GDC-0449 and transmembrane region mutations in Smo that conferred cancer cell resistance to the Smo antagonist GDC-0449 are consistent with transmembrane region binding for these ligands.12,21 However, these data did not provide detailed structural information to guide chemistry optimization. To begin establishment of a basic structure-activity relationship (SAR) between Smo and its ligands, we prepared derivatives of the known Smo agonists (purmorphamine and SAG) and antagonists (SANT-1 and SANT-2) by minor variations of previously published procedures for these compounds.22–24
Compound profiling dose-response curves
The compounds of interest, including the parent compounds and the synthesized derivatives of two Smo activators, purmorphamine and SAG1.3, and two Smo inhibitors, SANT-1 and SANT-2, were profiled in dose-response curves. The IC50 imaging data shown in Table 2 showed that some compounds had similar potencies to those of their parent compounds, whereas others showed lower potencies than their parents. These competition experiments also provided the proof-of-concept data for nonradioactive binding approaches using BODIPY-cyclopamine as the probe. The parent compound potencies agreed with those previously reported using a classical radioligand binding assay. 12
Compound Activities in Imaging, Fluorescence Polarization, and Gli-β-Lactamase Reporter Assays
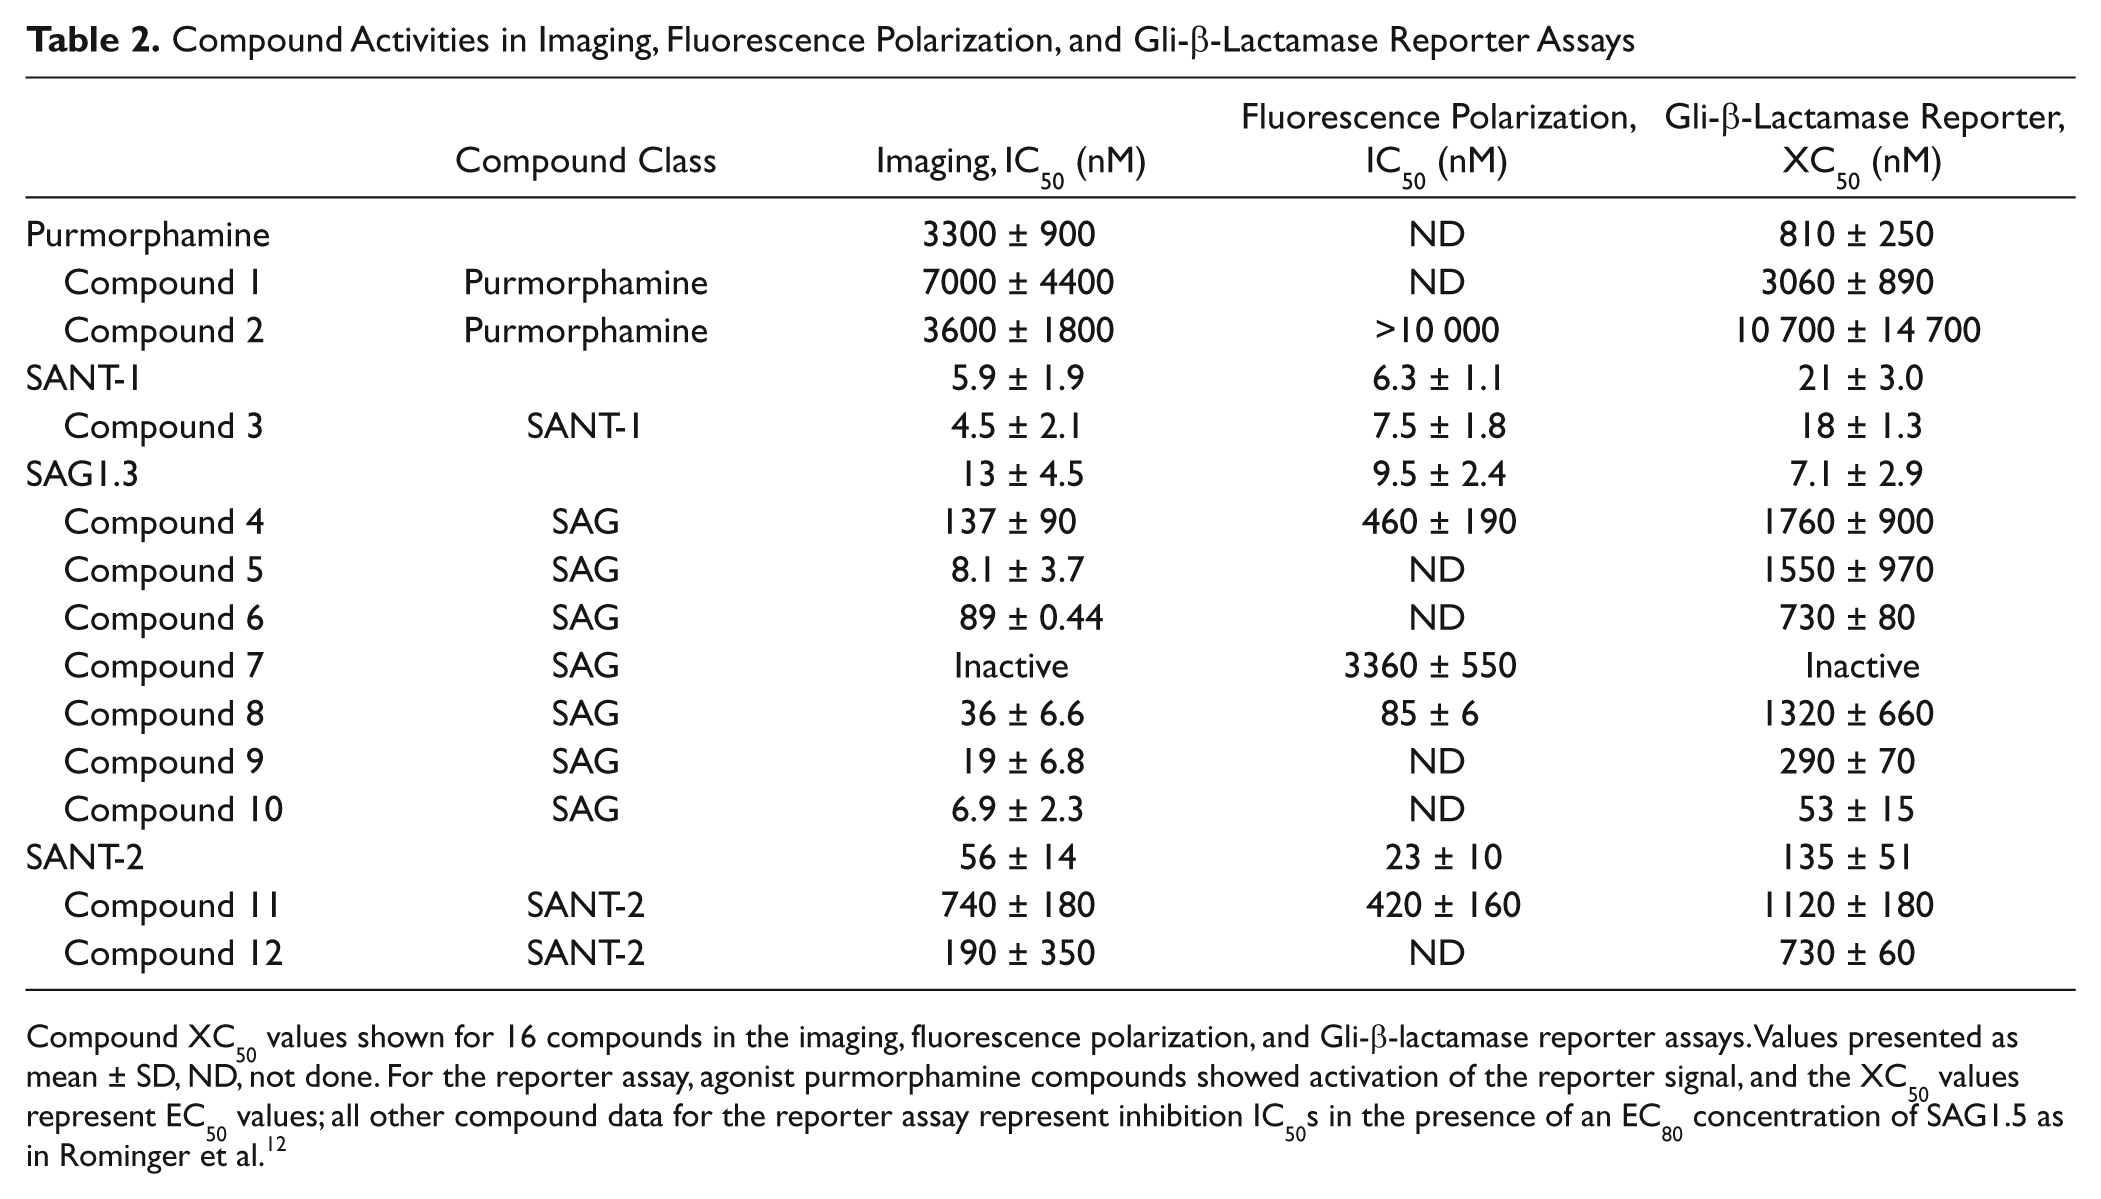
Compound XC50 values shown for 16 compounds in the imaging, fluorescence polarization, and Gli-β-lactamase reporter assays. Values presented as mean ± SD, ND, not done. For the reporter assay, agonist purmorphamine compounds showed activation of the reporter signal, and the XC50 values represent EC50 values; all other compound data for the reporter assay represent inhibition IC50s in the presence of an EC80 concentration of SAG1.5 as in Rominger et al. 12
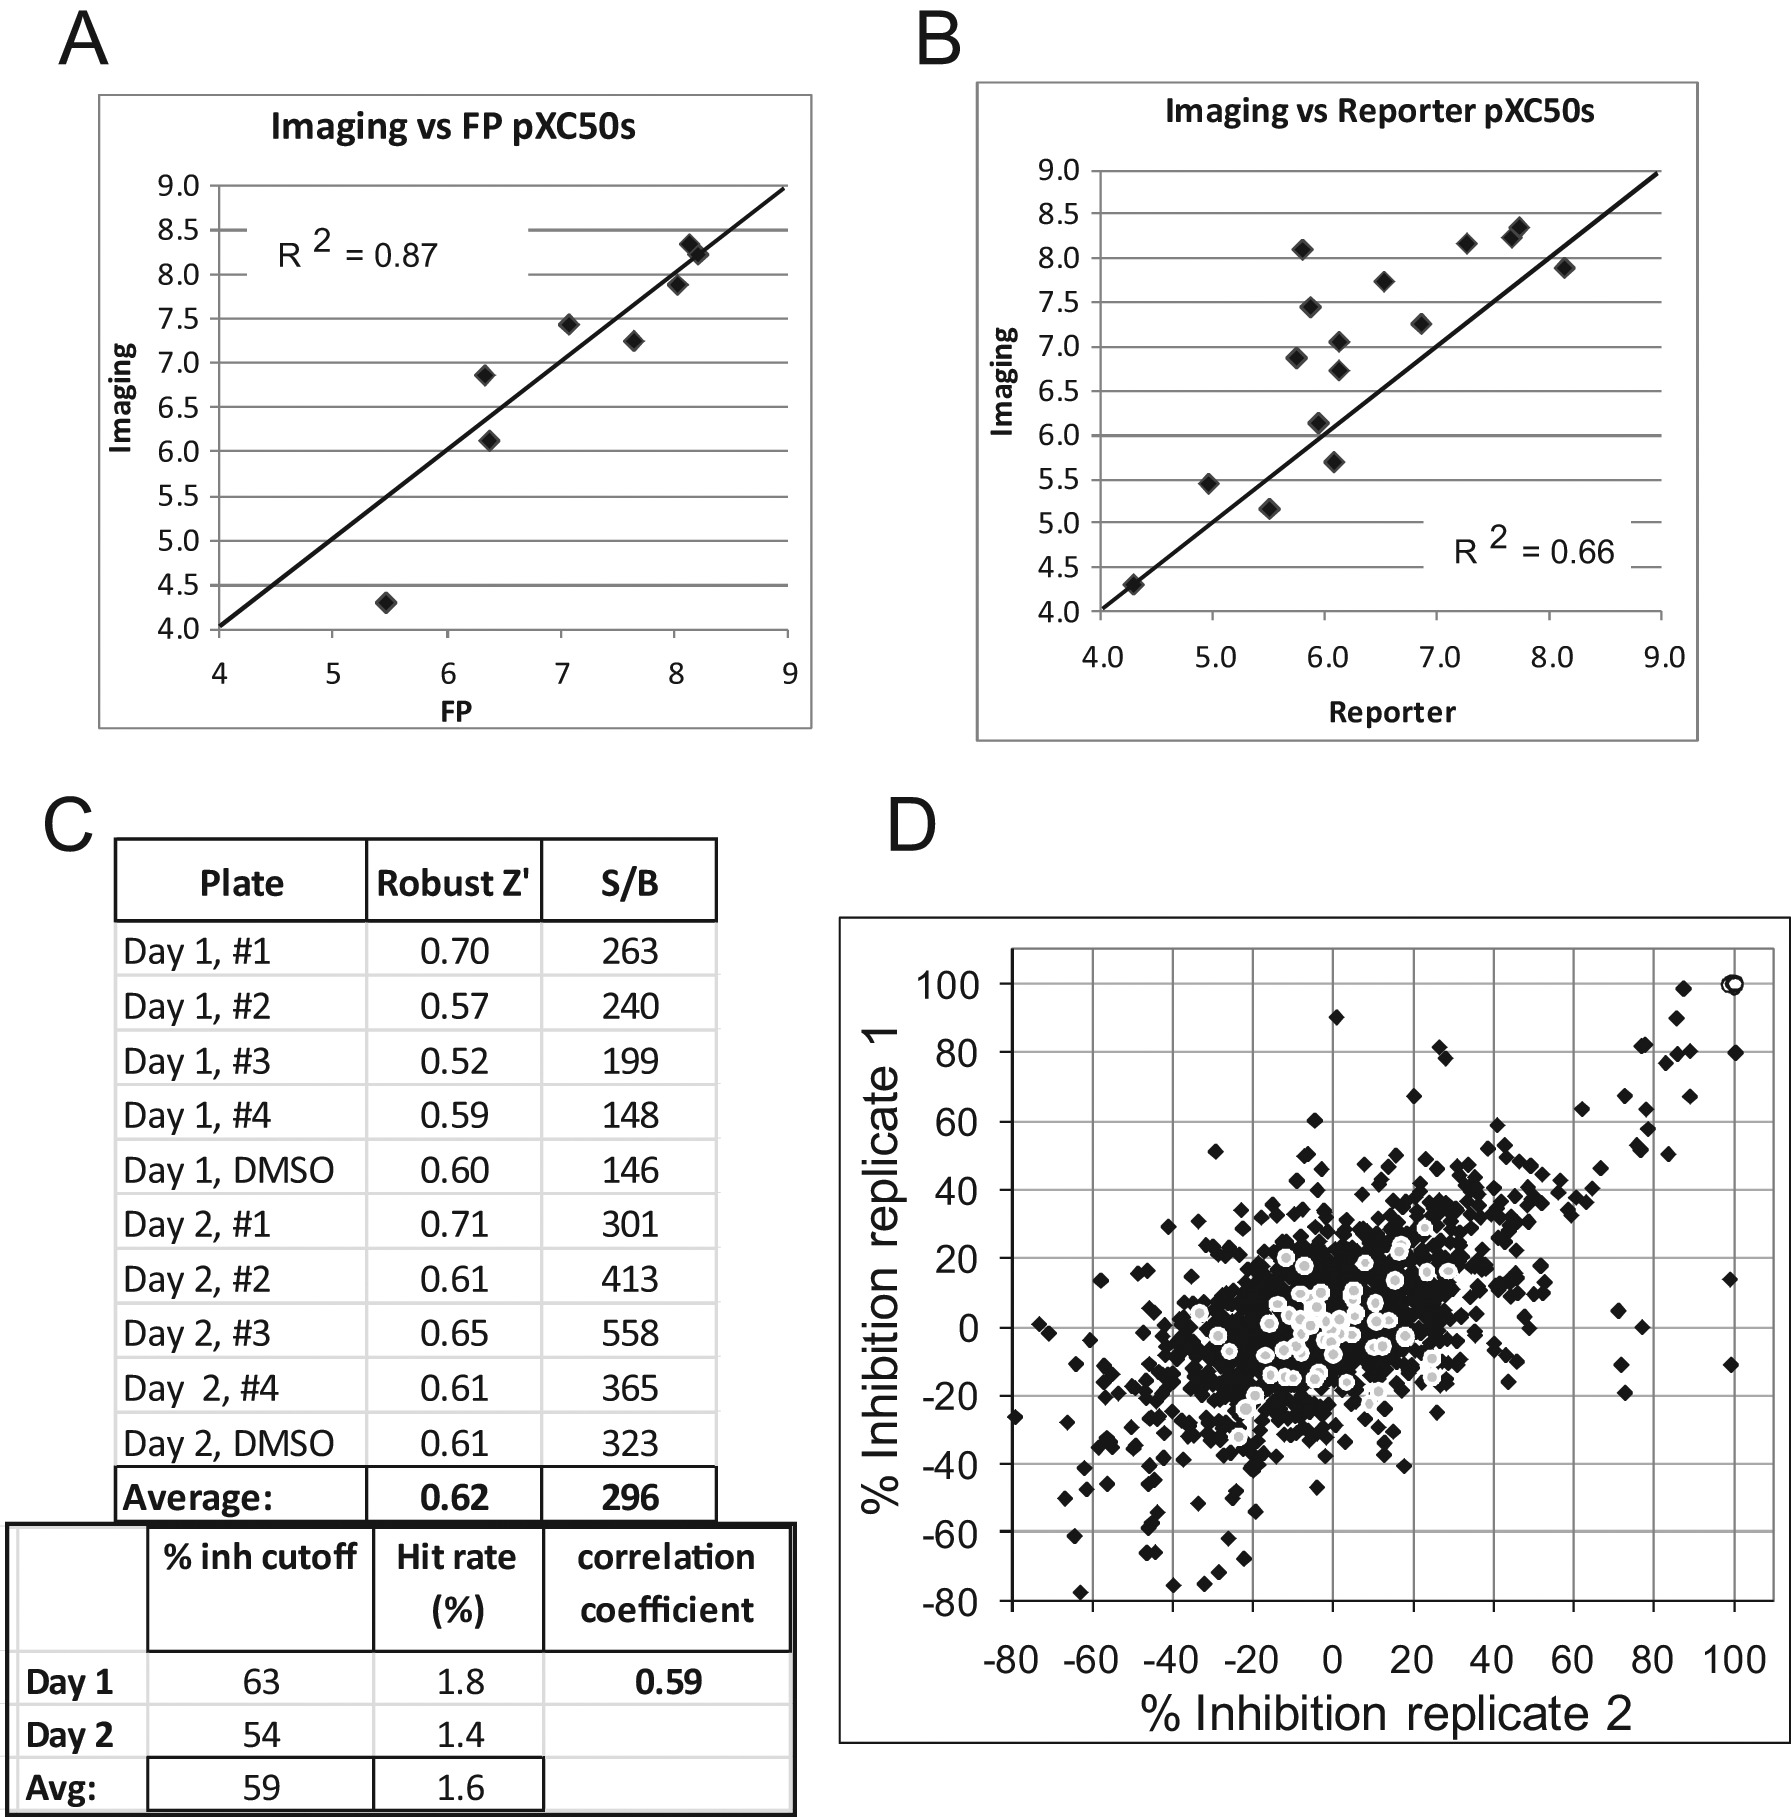
Although the imaging approach was a 384-well assay, when considering the wash steps and the instrumentation, it represents only a medium- to high-throughput format. The FP assay is a homogeneous mix-and-read protocol, which can be more easily run in high throughput and potentially developed for the 1536-well plate format if needed. With the validation of the Smo BacMam and BODIPY-cyclopamine reagents with imaging, membranes were prepared for the FP assay, and a subset of the Smo compounds was tested in dose-response curves using BODIPY-cyclopamine as the FP assay probe. The data shown in Table 2 and in the scatter plot in Figure 4A showed a good correlation between the HCS and FP binding assays, with an R2 value of 0.87 ( Fig. 4A ), suggesting that the FP approach could also be pursued as a nonradioactive binding assay format.
Panels
Compounds were also evaluated in the Gli-β-lactamase reporter assay to assess functional cellular activity. The IC50 data for the 16 compounds are shown in Table 2 , with a correlation plot presented in Figure 4B . The correlation between binding and functional transcriptional reporter assays was moderate, with an R2 value of 0.66. Understanding the differences between target binding and cellular functional activity is part of assessing overall compound SAR. Since binding affinity may not correlate with the functional activity of a compound, comparing binding and functional data is an important part of assessing and rationalizing compound activities. Overall, the data showed good correlations between the different assay formats, with the rank order of compound potencies across the four structurally diverse chemical templates generally well maintained between the different assays.
Single-shot compound statistics
Having developed the 384-well image-based binding assay and showing that it could be used to detect binding of compounds to Smo, we next assessed the performance of the assay in single-shot screening mode. A 1408-compound diverse random subset of the large screening collection was used to generate predictive statistics. The subset testing helps identify issues with assays, such as abnormally high hit rates, before assays are used for higher throughput single-shot testing or hit identification via single-shot screening. Hit rates below 5%, and rZ′ values greater than 0.4 were the performance targets for the assay.
The compound set was printed into four different 384-well plates containing the 1408 compounds, and one plate of DMSO compound solvent also was prepared for each assay day. Compounds were dispensed into assay wells to give a final compound concentration of 10 µM in the assay and a final DMSO concentration of 1%. The hit rate and robust Z′ statistics are shown in Figure 4C , along with a correlation scatter plot of the data from assays run on 2 different days ( Fig. 4D ). The average hit rate was 1.6% at an average hit identification cutoff rate of 59% inhibition, with hits defined as compounds showing a % inhibition above three times the standard deviation from the low controls. The average rZ′ was well above the desired cutoff of 0.4 at 0.62. The FP assay was also assessed with the robustness set, and the data showed an average rZ′ of 0.67 (ranging from 0.60–0.76; data not shown), which was also above the 0.4 minimum desired.
Overall, the statistics obtained for the 384-well imaging assay were within acceptable criteria, indicating that it could be used to screen larger compound sets for hit identification purposes and for dose-response curve profiling of compounds to determine compound potencies. The FP assay also met assay performance targets and thus represents an assay that is potentially amenable to ultra-high-throughput screening applications.
Discussion
As previously mentioned, the Smo localization pattern inside cells as detected by BODIPY-cyclopamine was intracellular and usually mostly contained within one large intracellular spot ( Figs. 1A , 3A , F ). This is not typical for most 7TMs, which generally tend to be mostly or partially outer cell membrane localized and internalize into endosomes upon activation, where they can be recycled or targeted for degradation. 25 Smo has been shown to localize in primary cilia in numerous cell types26–29; primary cilia are nonmotile microtubule structures that occur in most vertebrate epithelial cells and have recently been appreciated as functional signaling organelles rather than nonfunctional vestiges of motile flagella. Since HEK-293 cells do not form primary cilia, it is not clear what cellular structures the spots represent. It is interesting to note, however, that PKHD1 protein was shown to localize to basal bodies and primary cilia in polarized MDCK cells, as well as in basal bodies in HEK-293 cells. 30 The PKHD1 basal body staining pattern in HEK-293 cells was a single main large spot in each cell, similar to the Smo staining pattern we observed. In contrast, Smo staining looked evenly distributed in the cytoplasm as detected by BODIPY-cyclopamine in COS cells in a previous report. 10 In sum, the subcellular localization of the Smo receptor in different cell types is varied, and it is not clear which factors, beyond the ability of cells to form primary cilia, might influence this behavior.
The data obtained with the HCS assay were in good agreement with our prior binding data obtained from radioligand binding assays, not only from the standpoint of the IC50 values observed but also in that the compounds were able to completely displace the cyclopamine probe to nearly background levels ( Figs. 2A – D and 3D , E ; see also Rominger et al. 12 ). The SANT-1 and SANT-2 data previously reported for a flow cytometry–based BODIPY-cyclopamine binding assay and for a Gli-luciferase reporter assay were similar to those we report for the HCS and Gli-β-lactamase reporter assays, although some of the reported values were up to fivefold higher in potency than what we observed (compare Table 2 data with those reported in Chen et al. 11 ).
The HCS assay met statistical assay performance targets for both dose-response and single-shot compound screening applications. The BacMam overexpression approach simplified and expedited the assay development by allowing direct comparison of host cell and transduced cell samples under the same experimental conditions; this allowed the development of the image-based assay where it was clear that the signal detected was not simply due to background nonspecific staining. The plate washing conditions, Smo expression levels, and other experimental parameters such as the objective magnification and height settings were optimized to obtain the best assay statistics. Cytoplasmic and spot detection image analysis algorithms were tested and optimized to obtain the highest S/B and rZ statistics in the assay, with the spot detection method giving the best statistics.
In the identification and evaluation of compounds, multiple and parallel approaches can provide information on different aspects of compound activity. In the case of Smo, both binding assays and functional cellular assays were of interest. The image-based assay provided an advantage over the classical radioligand binding assay approach in that the safety hazards and expenses associated with the proper use and disposal of radioactive materials could be avoided. And although a membrane-based FP assay could potentially be a higher throughput assay format, there is a significant investment in time and resource required to produce high-quality cell membrane preparations expressing high levels of Smo for this approach. The HCS assay showed that functional Smo protein that could bind known ligands was expressed from the BacMam reagent and that the use of the fluorescent BODIPY-cyclopamine probe could be used in a competition binding assay to generate acceptable statistics. This paved the way toward generation of membranes and the development of the FP assay. In addition, the data showed that a statistically sound assay could be generated with the less commonly used image-based approach, showing its utility for other targets and programs. Imaging could also be used to study the biology and subcellular localization of the Smo receptor in the MSRII cells used herein or other more therapeutically relevant cellular models.
In conclusion, the HCS approach allowed rapid development of a binding assay for Smo and validated the BacMam reagents for use in preparing membranes for FP binding assays. The HCS assay allowed early testing of analogs of functionally active Smo-binding compounds, providing valued SAR information as newly synthesized Smo compounds were investigated. As a complement to the functional Gli-reporter assay, as well as other experiments that support the program, the HCS assay was a valued tool in the progression of this target.
Footnotes
Acknowledgements
The authors acknowledge Aidan Gilmartin, Chris Shelton, Dave Rominger, and Mark Richter for helpful discussions; Tom Sweitzer, Lisa Payne, Kathleen Gallagher, Da-Yuan Wang, and Quinn Lu, for frozen cells, the Smo clone, and BacMam virus generation; and Michelle Sano and other members of compound management at GSK for compound sample preparation.
Declaration of Conflicting Interests
The authors declared no potential conflicts of interest with respect to the research, authorship, and/or publication of this article.
Funding
The authors were fully supported for the research and publication of this article by GlaxoSmithKline.
References
Supplementary Material
Please find the following supplemental material available below.
For Open Access articles published under a Creative Commons License, all supplemental material carries the same license as the article it is associated with.
For non-Open Access articles published, all supplemental material carries a non-exclusive license, and permission requests for re-use of supplemental material or any part of supplemental material shall be sent directly to the copyright owner as specified in the copyright notice associated with the article.