
Abstract
The authors present an unsupervised, scalable, and interpretable cell profiling framework that is compatible with data gathered from high-content screening. They demonstrate the effectiveness of their framework by modeling drug differential effects of IC-21 macrophages treated with microtubule and actin disrupting drugs. They identify significant features of cell phenotypes for unsupervised learning based on maximum relevancy and minimum redundancy criteria. A 2-stage clustering approach annotates, clusters cells, and then merges them together to form super-clusters. An interpretable cell profile consisting of super-cluster proportions profiled at each drug treatment, concentration, or duration is obtained. Differential changes in super-cluster profiles are the basis for understanding the drug’s differential effect and biology. The authors’ method is validated by significant chi-squared statistics obtained from similar drug-treated super-cluster profiles from a 5-fold cross-validation. In addition, drug profiles of 2 microtubule drugs with equivalent mechanisms of action are statistically similar. Several distinct trends are identified for the 5 cytoskeletal drugs profiled under different conditions.
Introduction
H
Several drug profiling methods have been developed, including the use of principal components analysis, 4 factor analysis, 5 neural networks, 6 and support vector machines (SVM). 7 A drug profile vector based on the normal vector to the SVM hyperplane was able to accurately classify drugs with similar mechanisms of action. 7 However, the profiles 8,9 generated by these techniques can be “black boxes” when interpreting them in a larger context. Preferably, a profile should be related to cell-based information as a whole if we want to relate it to biological mechanisms. Moreover, techniques such as SVM or neural networks do not scale with the terabyte quantities of data.
Here we developed a framework for computing drug response profiles at the individual cell level across populations of cells. The method is computationally inexpensive, and we introduce an annotation technique that retains information in a biologically relevant manner so that the interpretability is not lost during the data-mining process. Our experiments show that the resulting morphology clusters are interpretable and provide a basis for determining drug profiles under different conditions. Thereafter, differences between drug-treated and control profiles identify morphological clusters that are enriched or depleted, providing a relevant biological framework in which hypotheses may be developed.
Materials and Methods
Overview of profiling method
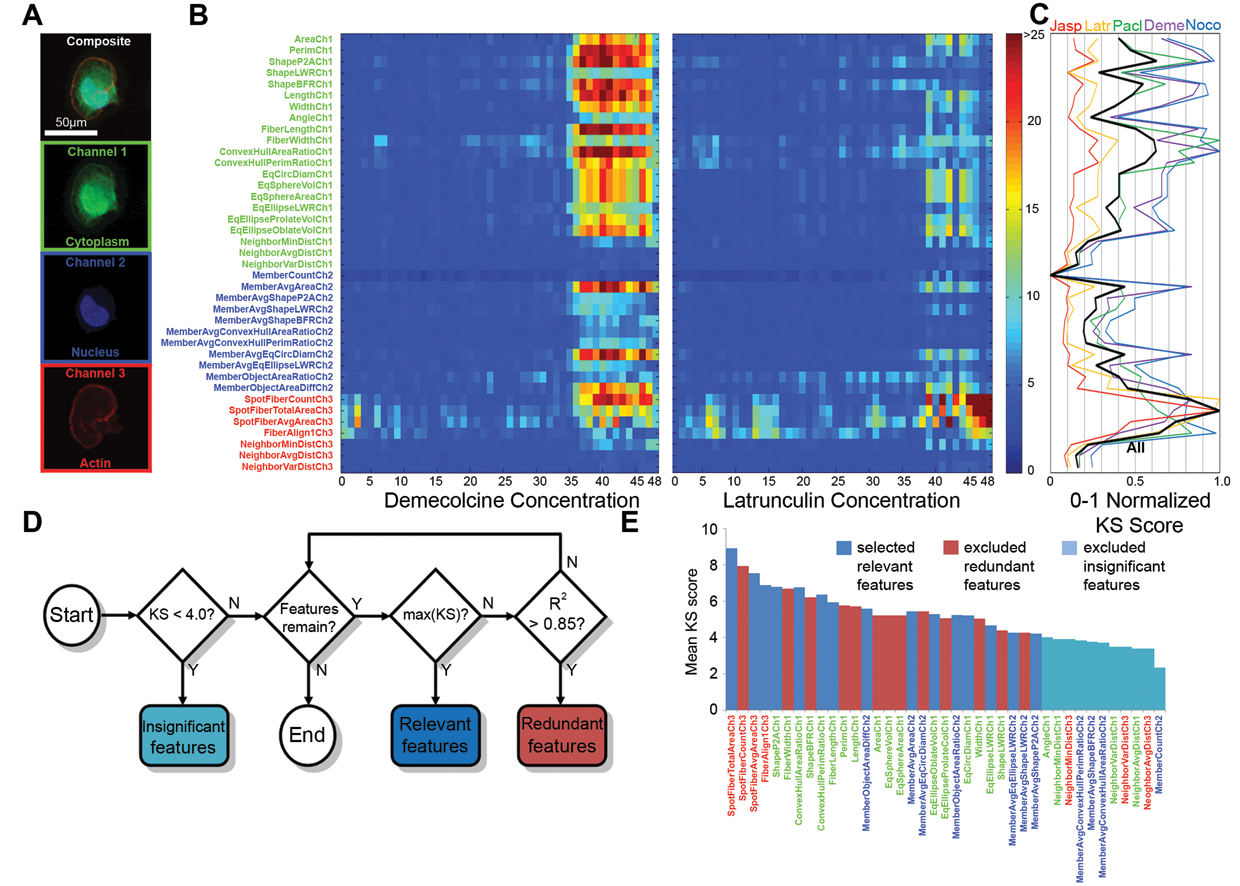
There are 4 basic steps in our approach. In the first step, we quantified morphological features that were generated via automated image segmentation algorithms from an HCS platform ( Fig. 1A ). For each morphological feature, we identified differential responses by calculating the Kolmogorov-Smirnov (KS) statistic 10 of its drug-treated cell feature distribution compared to its control distribution. A feature profile for each drug consists of KS statistics calculated per feature over the entire drug treatment range. This profile, when plotted as a heat map, shows the dosage-dependent feature response per drug ( Fig. 1B ). Features with high KS values are significant and more relevant in determining drug differential effects ( Fig. 1C ).
Feature profiling and feature selection strategy. (
In the second step, we implemented a feature selection algorithm that maximized relevant features and minimized redundant features ( Fig. 1D ). The feature with the highest KS statistic was selected, and remaining features that were correlated with a Pearson’s correlation coefficient over a specified threshold were removed. This iterative procedure selected an optimal set of features for unsupervised learning in the next step ( Fig. 1E ).
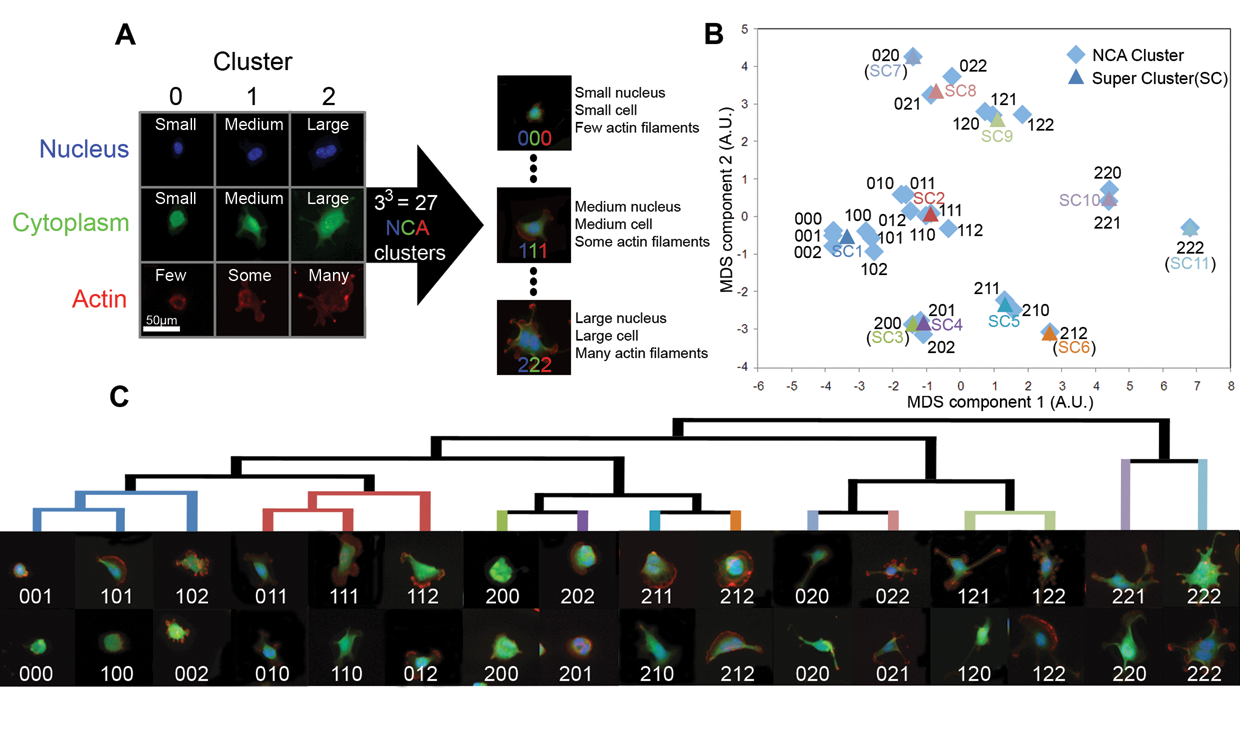
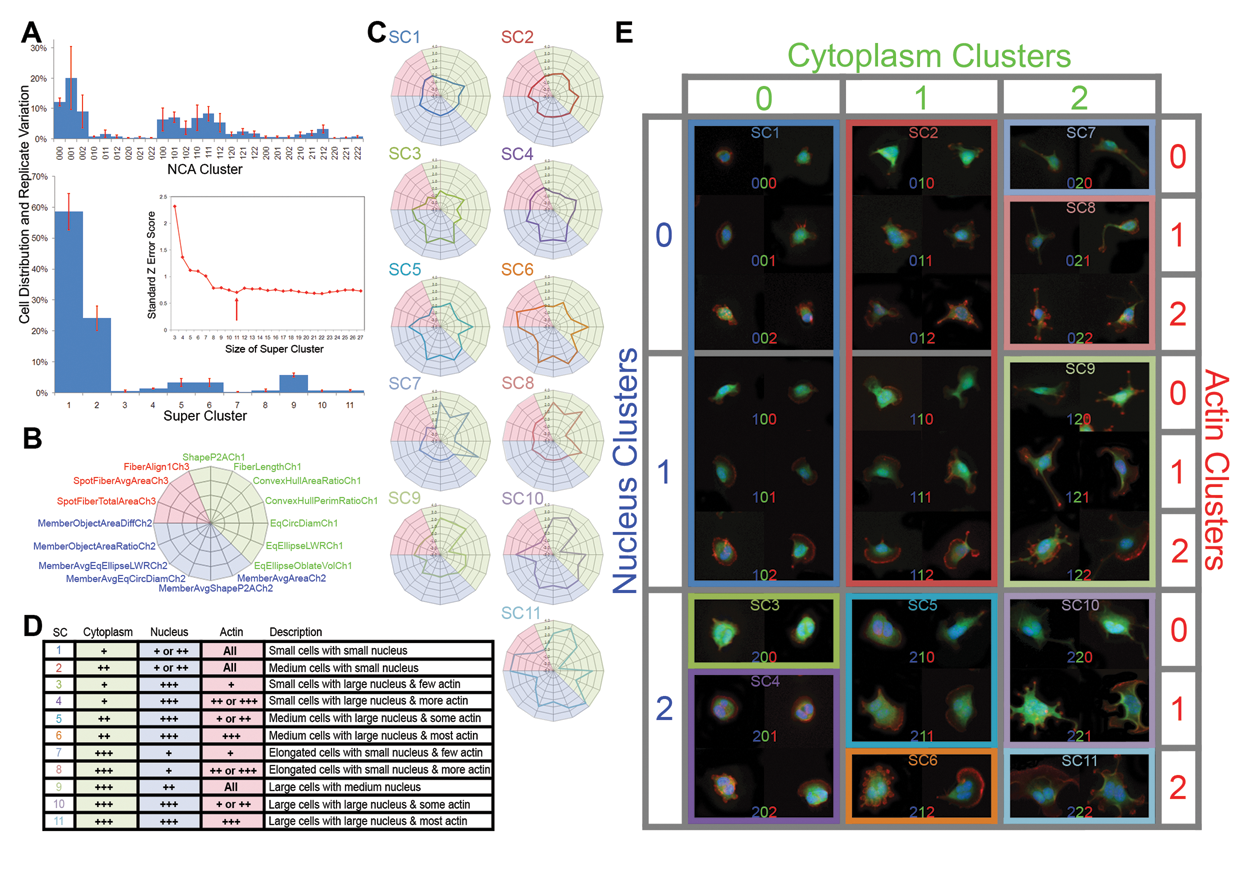
In the third step, we clustered all the cells by using the selected feature parameters. K-means clustering was used to cluster cells individually for each fluorescence channel, which demarked the nucleus, the whole cell, and the actin cytoskeleton. This approach reduced the dimensions of the large data set and, more important, decreased the likelihood that information related to each fluorescently labeled structure would be lost during the clustering process. Each cell was annotated with a 3-digit representation containing information of the 3 structural clusters to which it was allotted ( Fig. 2A ). This clustering approach identified the specific cell morphology clusters ( Fig. 2B ) that may or may not be influenced by a drug treatment. We used hierarchical clustering ( Fig. 2C ) as a basis to generalize these morphological clusters by merging closely related clusters to form a cluster super-set ( Fig. 2B ) with the minimum difference across replicates ( Fig. 3A ). These super-clusters were seen to be discriminative ( Fig. 3C ) and were given descriptive labels based on the 3-digit annotation of member subclusters ( Fig. 3D ). Representative cells from each super-cluster showed the morphological differences between cells together with their 3-digit relationships ( Fig. 3E ).
Clustering, annotation, and relationships. (
Super-cluster selection, formation, and annotation. (
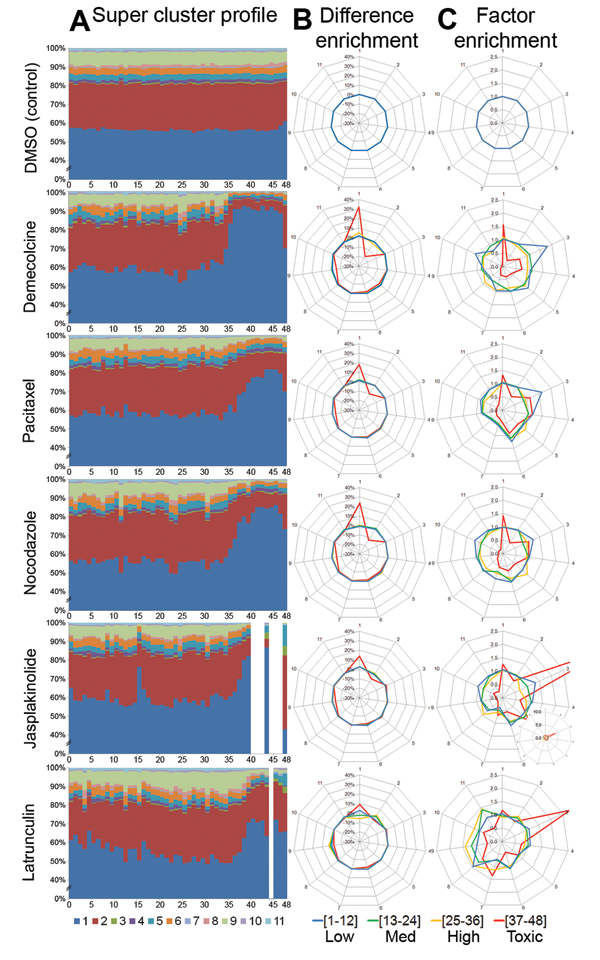
In the fourth and final step, we used super-cluster information from the previous step to profile cells. Each drug was profiled as a vector containing the proportions of each super-cluster over the concentration range ( Fig. 4A ). The difference of each super-cluster in a drug- and control-treated profile represented the differential effect of the drug ( Fig. 4B ). To normalize for different super-cluster sizes and to identify subtle population changes that may otherwise be difficult, we used the factor enrichment profile ( Fig. 4C ). We validated the accuracy of our method by comparing factor enrichment profiles of drugs with similar or contrasting mechanisms of action. Finally, we profiled ( Fig. 5A ) and identified distinct enriched and depleted cluster trends for the 5 drugs ( Fig. 5B ) at different drug concentrations and durations.
Super-cluster dosage profiles and enrichment star plots per drug. (
Factor enrichment heat map and observable super-cluster drug trends. (
Cell culture and drug treatment
IC-21 macrophages (ATCC, Manassas, VA) were cultured as described previously 8 and plated in black-walled 96-well Viewplates (PerkinElmer, Waltham, MA). Cells were stained with the whole cell stain CMFDA (Life Technologies, Eugene, OR) at 10 µg/mL for 30 min and left to recover for 12 h prior to treatment with cytoskeleton-disrupting drugs pacitaxel, demecolcine, nocodazole, jasplakinolide, and latrunculin A (Life Technologies) or the solvent DMSO (Sigma-Aldrich, St. Louis, MO). Cells were fixed as described previously 8,11 and stained with 10 µg/mL Hoechst 33342 and 2 µg/mL Texas red phalloidin (Life Technologies) for 1 h before imaging.
Data set and imaging
Fluorescence images were collected using an Arrayscan VTi (Thermo Scientific, Pittsburgh, PA) from an HCS of IC-21 macrophages treated with 3 microtubule-disrupting drugs (demecolcine, pacitaxel, nocodazole), 2 actin-disrupting drugs (jasplakinolide, latrunculin), or the solvent DMSO as a control. Each drug was used across a log2 serial dilution with 48 concentrations and 4 duration lengths (1, 10, 100, and 1000 min). A total of more than 10 million cells were imaged over 5 replicate 96-well plates. Fluorescent dyes were used to demarcate the cytoplasm (CMFDA; Life Technologies), nucleus (Hoechst 33342; Life Technologies), and actin filaments (Texas red phalloidin; Life Technologies). Automated image segmentation algorithms for the morphology explorer V3 bioapplications software (Thermo Scientific) extracted 65 morphological and intensity features per cell. We had conducted our initial analysis on cells treated at only the 100-min drug duration (2.7 million cells).
Image and data analysis
The 12-bit images with 0.5-micron pixels were collected and automatically segmented using the Arrayscan VTi automated microscope and the Morphology Explorer V3 software (Thermo Scientific). Images and data were exported and mined using Microsoft Access queries and LEADtools software (LEADtools, Charlotte, NC). Data and statistical analysis were performed using MATLAB 2007b (Mathworks, Natick, MA) and EXCEL 2007 (Microsoft, Redmond, WA).
Data normalization
All feature parameters used in analysis were normalized with respect to the control population counterpart. This ensures that the results are not dominated by certain features, and it assumes that all compounds are biologically active. Normalization with respect to a control distribution using morphological parameters (Area, LWR, P2A) is generally unaffected by biological artifacts (autofluorescence, plate edge effects). 12
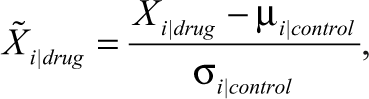
where i is the feature parameter, and µ and σ are the mean and standard deviation for feature i for the control distribution.
KS statistics calculation using bootstrap resampling
To normalize for the variation in the control feature populations, we implemented a bootstrap resampling strategy. Bootstrapping is the practice of estimating the properties of an estimator (KS statistic) by measuring the properties from samples taken from an empirical distribution. We first determined the number of samples to take by looking at how the features responded when the KS statistic was calculated based on the control-to-control feature populations. It was ascertained that 200 samples were sufficient to reduce the mean KS statistic score for all features to a value less than 4.0. The size of each sample was taken as 10% of the total distribution. The population KS statistic was determined as follows:
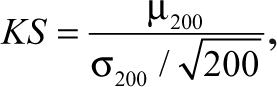
where µ200 and σ200 are the mean and standard deviation of KS statistics of the 200 obtained.
Statistical maps of features
KS statistic heat maps, based on a bootstrap sampling strategy, were generated for each drug to show the dose-dependent feature response of both microtubule- and actin-disrupting drugs (see Supplementary Methods). Intensity-based features were uniformly different at all concentrations and showed high KS scores. These features were expected to be noisy as they did not display a typical sigmoidal-type curve seen in most dosage-based drug responses (see Supplementary Methods). As a result, we removed all intensity-based features from further analysis. The revised KS heat maps ( Fig. 1B and Supplementary Methods) showed KS scores that began to increase at a concentration threshold around concentration index 36. Microtubule-targeting drugs displayed a profound cytoplasm and nuclear feature changes, whereas actin-targeting drugs displayed the expected actin-based feature changes with little cytoplasm and nuclear feature changes ( Fig. 1B ). To select representative features that account for these drug-based feature variations as a whole, we took the mean KS score per feature over all drug profiles and concentrations ( Fig. 1C ). A feature with a high KS score is relevant in its ability to discriminate drug-based morphological changes from the control morphologies.
Feature selection
To increase interpretability in our profiling strategy, we eliminated redundant or noninformative features. We had also decided to implement an unsupervised learning approach as there was a lack of information regarding the breadth of morphological classes. Feature selection in the unsupervised learning context is challenging to validate 13 as methods do not scale well for large data sets. 14 Therefore, we decided on a filter-based approach that selected features based on the distribution across the data set.
We developed an algorithm ( Fig. 1D ) motivated by the maximum relevancy and minimum redundancy (mRMR) criteria 5 used in feature selection. 15 We used the KS statistic to measure feature relevancy and Pearson’s correlation coefficient for redundancy. We compared features obtained from our algorithm with a variance inflation factor (VIF) and standard mRMR criteria on clustering results and found that our approach resulted in a more interpretable cluster relationship ( Fig. 2B and Supplementary Methods). Our algorithm first removes insignificant features that had KS scores less than the background observed in control-to-control bootstrap KS simulations (Supplementary Methods). Redundant features were next removed with a Pearson’s correlation coefficient greater than 0.85. We believe that this heuristically selected threshold was necessary to retain some redundant features needed for better cluster separability, which otherwise would be penalized and removed in the standard mRMR algorithm. Our approach selected 16 features in total: 6 from the cytoplasm channel, 7 from the nucleus channel, and 3 from the actin channel ( Fig. 1E ).
Clustering parameters
K-means clustering was performed together with the number of replicates set at 2 to reset initial cluster centroid positions to prevent convergence to a local minimum. The maximum number of iterations was set at 1000. Hierarchical clustering was then performed on NCA cluster centers produced by K-means, using a standard Euclidean distance measure and average linkage criteria. Other distance and linkage methods were attempted, but Euclidean and average linkage gave the best copohenetic correlation coefficient 16 for the hierarchical tree.
Multidimensional scaling (MDS)
The NCA cluster centers were represented as a 27 × 16 matrix in which each NCA cluster center was represented by 16 morphological parameters. To visualize the distribution of these 27 cluster centers in 2D, we used the MATLAB function mdscale and plotted the first 2 principal components in a scatter plot.
Enrichment calculation
Enrichment is defined as the change in the drug super-cluster proportions with respect to the control super-cluster rendering the interpretable drug differential effect. The difference enrichment is measured by the absolute difference in clusters, whereas quotient or factor enrichment takes into account the cluster size.
Chi-squared statistics
To validate the reproducibility of our method, we repeated the framework 5-fold each time, leaving out 1 experimental replicate. We used the chi-squared statistic to measure the similarity between the training and validation super-cluster (SC) distributions.
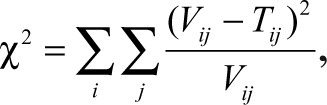
where V and T are the validation and training SC distributions, i is the number of super-clusters, and j is the number of drug concentration ranges. We calculate chi-square based on (i − 1)(j − 1) = (10)(3) = 30 degrees of freedom.
Additional methods
Methods for determining the sample size for bootstrap analysis for normalizing the KS statistic, the different methods used for feature selection, and the optimal k in K-means clustering, as well as a description of super-clusters, are given in the Supplementary Methods.
Results
Cell profiling
Cells exist as a heterogeneous mixture of cellular morphologies, and the advent of HCS has allowed automated imaging of these diverse cellular states. 1 This is especially true when imaging and segmenting highly plastic cells such as macrophages, which exhibit a diverse range of shapes and sizes. We hypothesized that this heterogeneous mixture can be discretized into several distinct morphology subpopulations, and these morphologies would be present in various proportions when externally perturbed by the addition of drugs. 9
We introduced a clustering strategy to identify these subpopulations while retaining the fluorescence information related to biological states. We used a heuristic approach to determine the optimal cluster number, which was found to be 3 for each channel (see Supplementary Methods). K-means clustering was performed on each fluorescence channel, and each cell was assigned a digit representing its cluster membership. Each cell was next annotated with a 3-digit representation. The first digit represents the nuclear (N) cluster, the second the cell cytoplasm (C) cluster, and the final digit the actin (A) cluster. Each digit was assigned a value of 0 to 2 according to the relative magnitudes of features contributing to the cluster centers. Brought together, these clusters can be abbreviated as 27 NCA clusters with digits ranging from 000 to 222. The 000 cells have a small nucleus, small cytoplasm, and few actin-rich structures, whereas 222 cells have a large nucleus, a large cell size, and many actin-rich structures ( Fig. 2A ).
We visualized the relationships between the 27 NCA clustered by a multidimensional scaling (MDS) plot of the first 2 principal components of the 16 features that described each cluster center ( Fig. 2B ). We observed that cell clusters with close NCA affiliations are clustered together as expected. For example, the small cells with small nucleus (0 or 1 in the first NCA digits) are seen in left middle of the plot. Similarly, large cells (2 in the middle NCA digit) are at the top, large nucleus cells (2 in the first NCA digit) are at the bottom, and large cells with a large nucleus (2 in the first 2 NCA digits) are on the right. We further validated the NCA clusters by inspecting representative cells from the same cluster. It was observed that cells within the same NCA cluster were morphologically consistent. Next, a hierarchical cluster tree of NCA clusters was built on their distance relationships and demonstrated a progression from smaller cells with a simpler nucleus and actin structures to larger cells with a more complicated nucleus and actin structure ( Fig. 2C ).
However, we observed that several NCA clusters with close affiliations such as 000 and 001 were indistinguishable. In addition, the distribution of NCA clusters between replicate sets of similar treatment showed a high degree of variation ( Fig. 3A ). To investigate this difference, we hypothesized that the NCA notation described the localized morphological information of the cell, which was not necessarily similar to a drug-induced cell morphology. Drug morphologies should have an identical distribution under each experimental replicate. Therefore, some redundant NCA clusters were consolidated together to form a super set or super-clusters.
Hierarchical clustering was performed to map distances between NCA clusters and sequentially merge closely related clusters. At each merging step, a normalized Z error score for all super-clusters across the 5 replicates was calculated. This score was plotted as a graph ( Fig. 3A , insert), and the most parsimonious model with 11 super-clusters was chosen with the lowest replicate error. We visualized the new super-cluster centers by plotting the 16 feature contributions in a star plot ( Fig. 3B ). These star plots showed that the super-clusters were mostly discriminative, although there were minor actin cluster variations in several of the super-clusters ( Fig. 3C ). A description of each super-cluster was provided by its NCA members ( Fig. 3D ). For example, super-cluster 1 was made up of NCA members with 0 in the cytoplasm digit, 0 or 1 in the nucleus digit, and all actin digits, and therefore this super-cluster contained cells that are described as small in size with a small nucleus. Representative cells from each NCA cluster were tabulated according to their NCA cluster membership ( Fig. 3E ) together with outlines that formed each super-cluster. We validated that most cell morphologies that made up the super-clusters were consistent with the descriptions provided. However, we retermed super-clusters 7 and 8 as “elongated cells” as their representative images and star plots showed a different cytoplasm feature contribution from the “large-sized cells” seen in super-clusters 9 to 10.
Modeling drug responses
Super-clusters provide the basis for the subpopulation modeling. Each cell was characterized by its membership to a super-cluster, and its proportion calculated at each drug treatment or concentration formed an interpretable cell profile vector. The dosage-based super-cluster profile for the 3 microtubule drugs and 2 actin drugs ( Fig. 4A ) showed a large shift in cell distribution among super-clusters at approximately concentration index 36. This trend was similar to that observed in the KS statistical feature profiles ( Fig. 1B ). To visualize the dosage based trends more concisely, we discretized the drug concentrations into 4 ranges: low for concentrations 1 to 12, medium for concentrations 13 to 24, high (orange) for concentrations 25 to 36, and toxic (red) for concentrations 37 to 48.
To investigate the super-clusters that were enriched or depleted as a result of the drug effect, we calculated difference and factor enrichment profiles for each concentration range. The difference enrichment profile details the difference between the drug-treated and control super-clusters ( Fig. 4B ). We observed a similar shift in super-cluster 1 for all drugs at the toxic range. This trend was caused by the dominance of super-cluster 1. To view subtle changes that are more representative of cell population changes as a result of drug effects, we calculated the factor enrichment profile that takes the quotient between the drug-treated and control super-clusters ( Fig. 4C ). The factor enrichment profiles for microtubule- and actin-disrupting drugs showed different enrichment trends. At the toxic concentration range, microtubule drugs showed enrichment of small cells (super-clusters 1, 3, and 4) and depletion of all others. Actin drugs showed a distinct enrichment of small cells with a large nucleus (super-cluster 3).
We profiled the remaining samples that were treated over drug durations of 1, 10, and 1000 min. An additional 7.5 million cells were profiled according to the cluster centers of the 11 super-clusters defined previously. Dosage-dependent super-cluster profiles (Suppl. Fig. S10), difference (Suppl. Fig. S11), and factor enrichment star plots (Suppl. Fig. S12) show the temporal enrichment and depletion profiles for the 5 cytoskeletal drugs at all concentrations and durations.
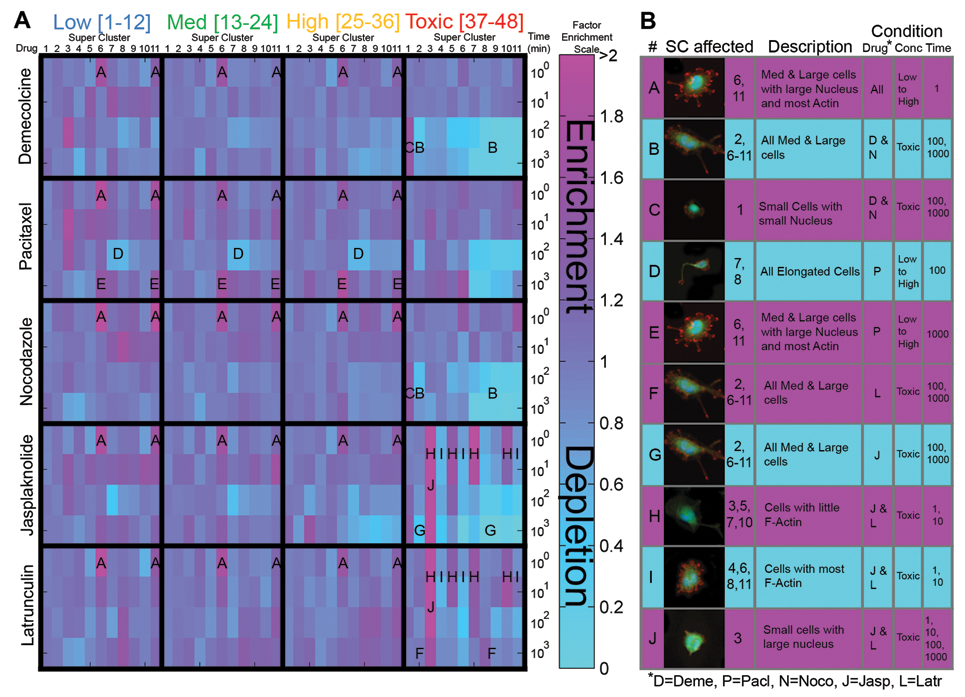
Trends and validation
Factor enrichment profiles were plotted over 5 cytoskeletal drugs, 4 concentration ranges, and 4 durations in a heat map ( Fig. 5A ). Several noticeable trends that span several drugs or conditions are highlighted in a table ( Fig. 5B ). Microtubule depolymerizing drugs, demecolcine and nocodazole, were observed to exhibit similar profiles at toxic concentration ranges and at durations of 100 and 1000 min. Both of these drug treatments resulted in a depletion of medium and large cells (trend B) and an enrichment of small cells with small nuclei (trend C).
On the other hand, actin-disrupting drugs, jasplakinolide and latrunculin, are observed to exhibit similar profiles at low durations (1 and 10 min) and contrasting profiles at high durations (100 and 1000 min) at the toxic range. At low durations, we observed an enrichment of cells with little actin filaments (trend H) and a coincident depletion of cells with most actin filaments (trend I). At high durations, we observed the depletion of medium and large cells with jasplakinolide (trend G) and a contrasting enrichment of medium and large cells with latrunculin (trend I). Trends G and I tie in with the contrasting mechanisms of action of these 2 actin polymerization disrupting drugs.
Several other noticeable and interesting trends were observed. At low durations (1 min), it was observed that all 5 drugs had an enrichment of medium and large cells with large nucleus and most actin filaments (trend A). Pacitaxel, a microtubule stabilizing drug, had a depletion of elongated cells (trend D) from low to high concentrations at 100 min.
We compared the statistical significance of each drug profile by doing a 5-fold cross-validation. In each validation step, we left out one of the replicates (validation set) and performed the drug profiling framework on the remaining 4 replicates (training set). We calculated and compared the drug enrichment profiles for each drug in training and validation sets using the chi-squared statistic. Table 1 lists the mean chi-squared value obtained. We observed that the drug enrichment profiles are highly similar and significant (p < 0.001) when compared to the validation set. In addition, drug profiles of similar mechanisms of action (demecolcine and nocodazole) also displayed a highly similar and significant (p < 0.001) super-cluster distribution. On the contrary, drug profiles for different drugs of contrasting mechanisms (demecolcine and latrunculin) are not significant.
Comparing the Significance of the Drug Profiles Using a 5-Fold Cross-Validation and the Chi-Squared Statistic
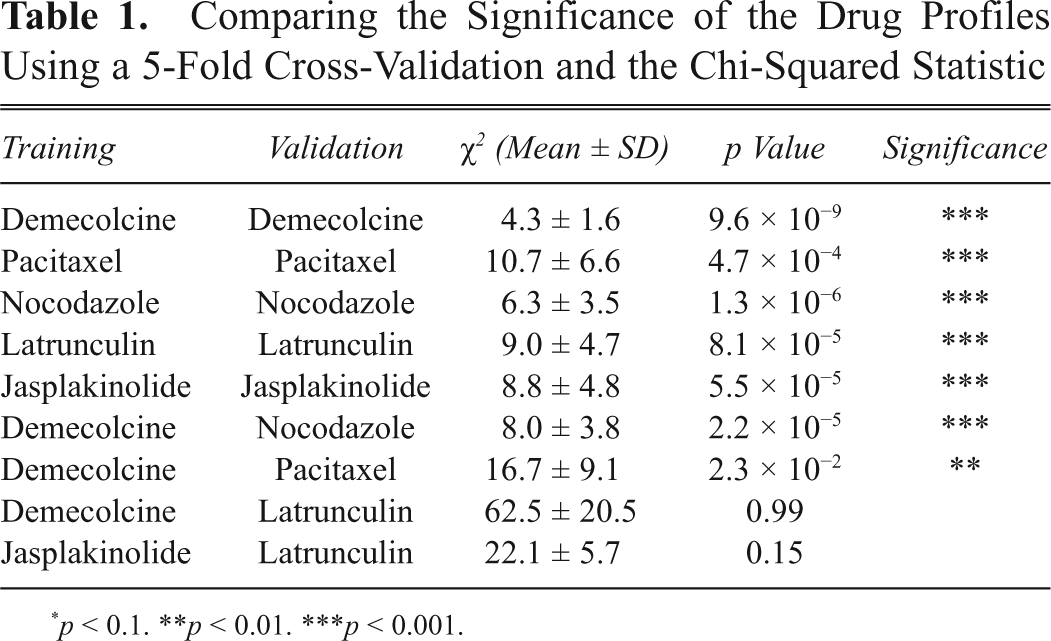
p < 0.1. **p < 0.01. ***p < 0.001.
Discussion
Our profiling framework selected features based on their significance in discriminating drug-treated and control cell populations. The feature selection leads to separable and biologically interpretable clusters. The validity of clusters was determined from similar and statistically significant trends observed in drug profiles with similar drug mechanisms of action.
IC-21s are a motility cell line. Therefore, they can assume diverse cellular morphologies that could have complicated our analysis. However, we were still able to observe significant trends with our approach. We would expect that our approach would fare better or as well with less heterogeneous cell types.
Our approach used automated segmentation algorithms provided by the Cellomics™ Morphology Explorer toolbox. We believe that more cell-type-specific segmentation algorithms will be able to enhance our result. However, these are less accessible to the general HCS user. We attempted to minimize the variance of a large data set by maintaining identical instrumentation and segmentation settings during imaging and data collection.
The annotation method we chose retained the structural information of cells, which is critical for understanding HCS analysis by biologists. Essentially, all fluorescent dye information collected is not lost at any stage throughout the analysis. This annotation method is scalable with multiplexed images with more than 3 biomarkers. However, as seen in the results, as the number of biomarkers increases, “overfitting” and redundant clusters can occur. Therefore, second-stage clustering that merges clusters together to form more biologically relevant super-clusters was necessary.
We chose methods in our framework that are computationally efficient but interpretable by the HCS community. 17 One reason for doing this was to incorporate as much raw data into our analysis so that we could maintain a statistical advantage when dealing with large data sets. More important, this statistical advantage was necessary for assuming similarity in replicates and for calculating the replicate error, which formed the basis of the drug-induced morphologies or super-clusters. Furthermore, our approach is scalable to terabyte-level data sets.
The factor enrichment profiles for demecolcine and nocodazole show similar trends, whereas jasplakinolide and latrunculin profiles show contrasting trends. Demecolcine and nocodazole both inhibit microtubule polymerization, whereas jasplakinolide stabilizes actin filaments and latrunculin inhibits actin polymerization.
Many trends can be identified in a factor enrichment profile of the 5 drugs that may be significant or otherwise. We identify trends over a concentration range to minimize localized variation that may be present at individual concentrations. In addition, we pick global trends that are present at several drug and conditions. An interesting trend we observed was that some drugs behaved differently not only in a dosage-dependent fashion but also in a temporal-dependent fashion. Jasplakinolide and latrunculin are seen to behave similarly (trends H and I) at low drug durations but in a contrasting fashion (trends G and F) at higher drug durations. Another interesting observation at low drug durations is an enrichment of large cells with a large nucleus and many actin filaments (trend A) for all drugs, which could be a morphology similar to a G2/M cell cycle arrested cell. 18 We further validated the significance of drug profiles by performing a 5-fold cross-validation using the chi-squared statistic.
In conclusion, we have demonstrated a framework for analysis of HCS based on image data that can be readily applied to different cell-level-type screens. This method sieved, analyzed, and summarized biological knowledge from millions of spatial and temporal cell-level records and provided an unbiased, scalable, and biological interpretable framework for analyzing HCS image data. The biological trends observed in these experiments lead to a better understanding of drug mechanics and the conditions under which they occur.
Footnotes
Acknowledgements
We thank the Singapore MIT Alliance (SMA) for its funding for this research. We also thank Brian McKenna and Victor Chest for their computational support during data mining.