
Abstract
High-content screening (HCS) is a powerful tool for drug discovery being capable of measuring cellular responses to chemical disturbance in a high-throughput manner. HCS provides an image-based readout of cellular phenotypes, including features such as shape, intensity, or texture in a highly multiplexed and quantitative manner. The corresponding feature vectors can be used to characterize phenotypes and are thus defined as HCS fingerprints. Systematic analyses of HCS fingerprints allow for objective computational comparisons of cellular responses. Such comparisons therefore facilitate the detection of different compounds with different phenotypic outcomes from high-throughput HCS campaigns. Feature selection methods and similarity measures, as a basis for phenotype identification and clustering, are critical for the quality of such computational analyses. We systematically evaluated 16 different similarity measures in combination with linear and nonlinear feature selection methods for their potential to capture biologically relevant image features. Nonlinear correlation-based similarity measures such as Kendall’s τ and Spearman’s ρ perform well in most evaluation scenarios, outperforming other frequently used metrics (such as the Euclidian distance). We also present four novel modifications of the connectivity map similarity that surpass the original version, in our experiments. This study provides a basis for generic phenotypic analysis in future HCS campaigns.
Introduction
High-content screening (HCS) using automated microscopy allows for detailed analysis of cellular phenotypic responses to a large number of perturbations such as RNA interference or small molecules. 1 Phenotypic screening with HCS technology has increasingly been applied for drug discovery, complementing target-based high-throughput screening (HTS) approaches. 2 Various HCS campaigns have been reported that successfully identified compounds with effects in the corresponding imaging assay. Such compounds have helped to provide tools with which the mechanism bringing about the observed phenotypes could be explored.3–5 A key advantage of HCS is the image-based multiparametric readout, which provides rich phenotypic information. When analyzed properly, this information can be used to support holistic identification of hits with the desired mode of action (MoA). It has been shown that hit identification with multiple HCS readouts can lead to lower rates of false positives and therefore reduced attrition rates at the hit verification stage.6,7
Image-based readouts are composed of morphological, geometric, intensity, and texture-based features that can be combined to create a mathematical vector. This feature vector represents the treatment-induced phenotypic effect and provides a biologically relevant descriptor of a compound, which can be regarded as a signature or fingerprint and is thus named HCS fingerprint here. Clustering HCS fingerprints across treatments allows for the identification of compounds hitting the same targets or pathways and can therefore support compound set enrichment or the characterization of the compound’s MoA.8–10 A central prerequisite for clustering analysis is the availability of an appropriate similarity/dissimilarity measure between HCS fingerprints that detects relevant phenotypic similarities and differences. Due to the complexity and high dimensionality of HCS fingerprints (with up to 600 readouts 11 ), this is not trivial. Feature selection, or dimension reduction methods prior to comparing HCS fingerprints, may help to improve the robustness of similarity measures. Previous studies have performed feature reduction using linear methods such as principal component analysis (PCA),12,13 factor analysis, 14 or linear discriminant analysis, 15 as well as nonlinear methods. 16 Euclidean distance has often been selected as the similarity measure in such studies.9,14,17,18 Although individual HCS campaigns have been successful, statistical evaluation of different feature reduction and similarity measures has not yet been comprehensively explored. Which similarity method to select and how to optimize their parameters in analyzing an HCS fingerprint data set remain elusive.
In this article, we compare feature reduction and similarity measures using a large-scale HCS fingerprint data set to evaluate their performances in HCS fingerprint analysis. In total, 16 different multiparametric similarity measures, including Euclidean, Manhattan, and Mahalanobis distances, as well as Pearson correlation, cosine similarity, distance correlation, 19 maximal information coefficient (MIC), 20 Kendall’s τ, Spearman’s ρ, the Tanimoto index, the Dice coefficient, the connectivity map (CMAP) similarity, 21 and four novel variants of the latter, are combined with the two unsupervised dimension reduction methods of PCA and random forest scaling (RFS) 22 and tested for their ability to detect relevant similarities and dissimilarities among HCS fingerprints. Our results can help to select analysis methods in further HCS studies and serve as a starting point for method evaluation in the HCS community.
Methods
HCS Fingerprint Generation
As a basis for our analysis, we have generated multiparametric readouts for a large-scale, high-content screen in which more than 1 million different compounds were tested ( Fig. 1 ). The screen was set up to image U2OS cells stably transfected with a green fluorescent protein (GFP) in order to measure protein processing upon compound treatment. For each well, readouts were derived by automatic image analysis in the Acapella software environment (PerkinElmer, Waltham, MA) with a customized script developed by Ghislain Bonamy, Genomics Institute of the Novartis Research Foundation. The analysis script is available on http://code.google.com/p/operahci/. Images were processed with standard nuclei segmentation (DRAQ5 channel) and cytoplasm segmentation (GFP channel). Geometric, morphological, intensity, and texture readouts were measured on both channels. The medians of these cellular readouts were used for well aggregation. We analyzed plate-based Mahalanobis distance distributions between neutral and positive controls and did not observe significant variation between plates. Therefore, the readout vectors from image analysis were normalized using z score transformation with separately calculated median and median average deviation (MAD) values for all readouts from neutral control wells across all plates. Previous studies have shown that methods such as the Box-Cox transformation, for obtaining normal-distributed data, do not improve performance. 23 To keep the data transformation simple, we therefore refrained from using such a transformation. Finally, the derived HCS fingerprints contain 290 different readouts (see supplementary material for the full list).
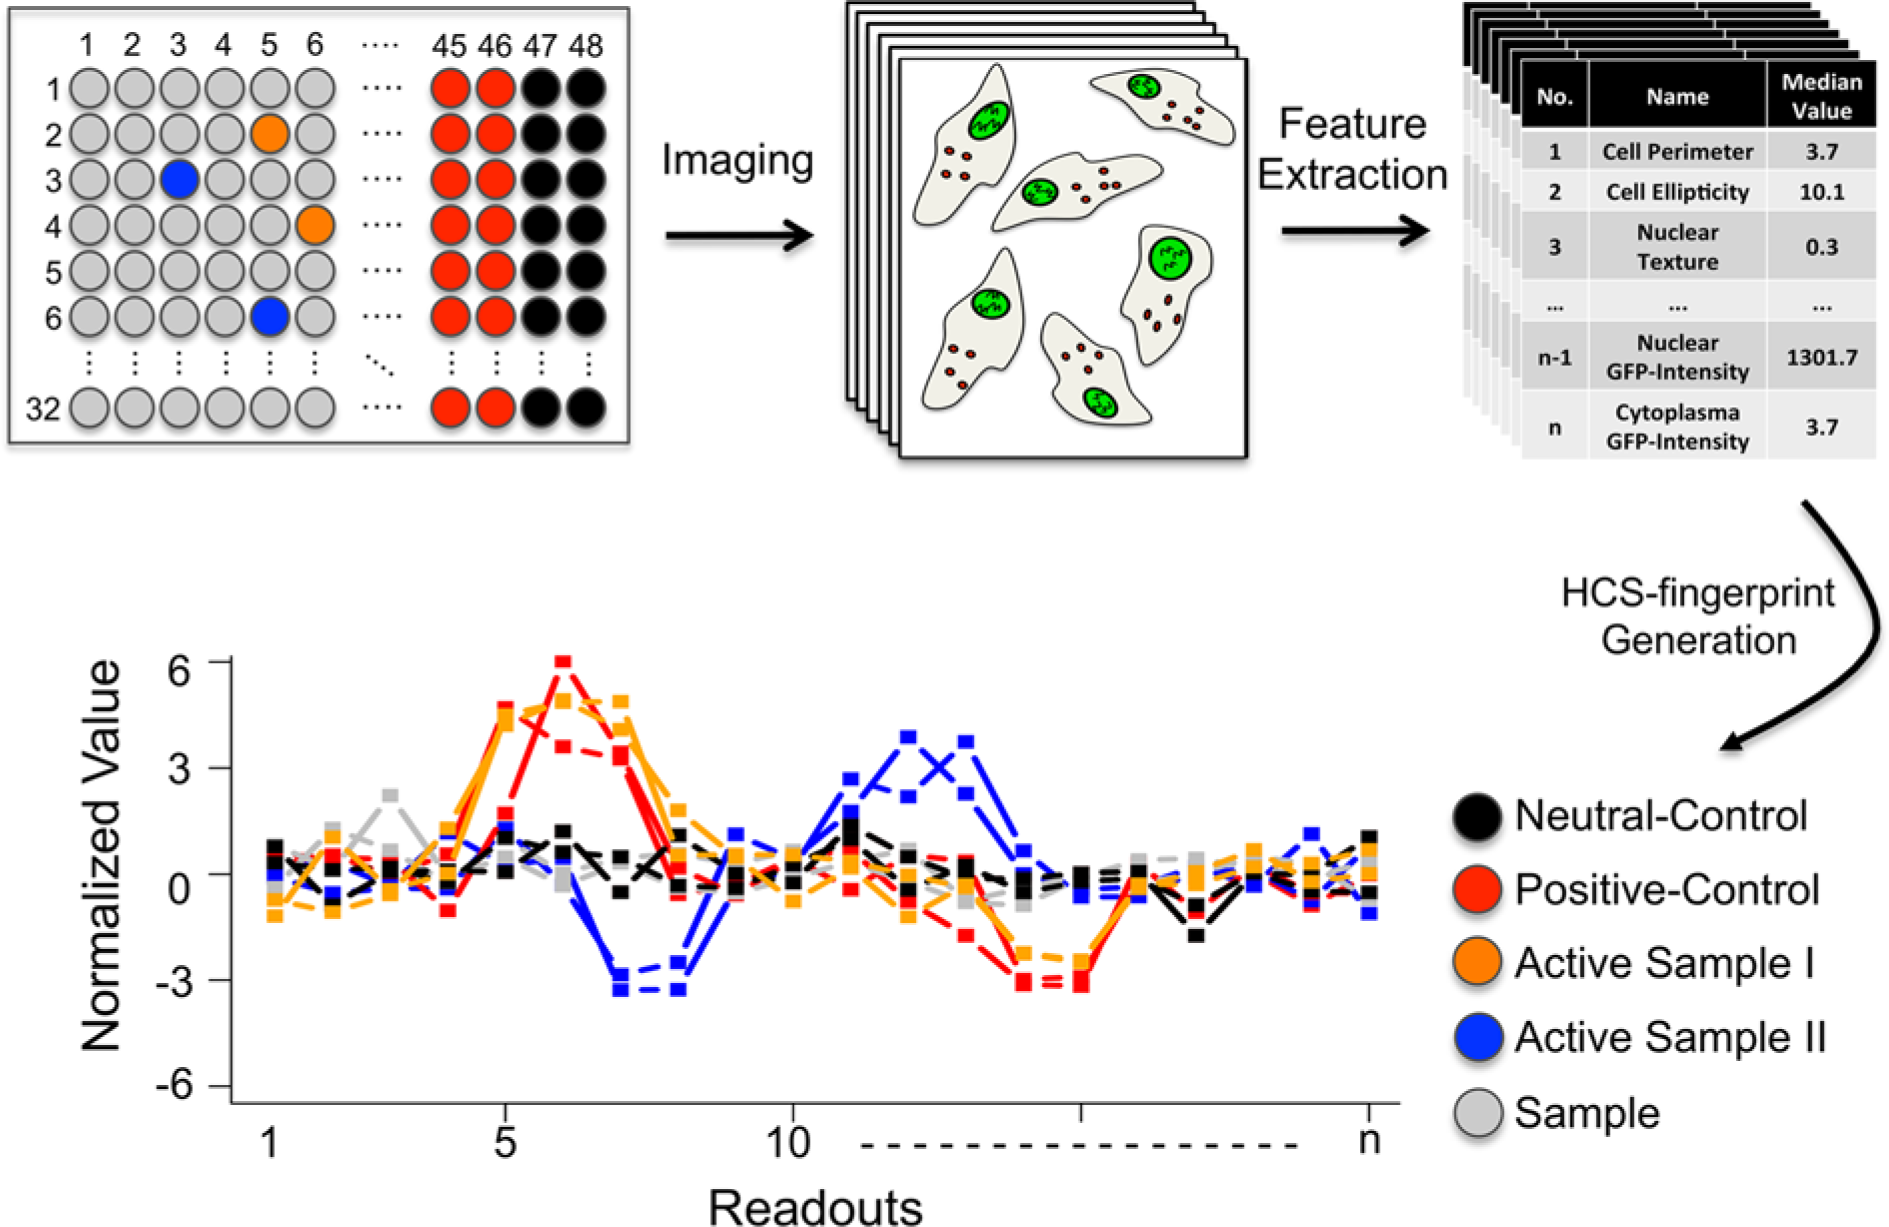
High-content screening (HCS) fingerprint generation. The high-throughput high-content screen was conducted in 1536-well plates with 64 neutral control wells (black), 64 positive controls wells (red), and 1408 samples per plate. Samples show a neutral control–like phenotype (gray), a positive control–like phenotype (orange), or phenotypes differing from the controls (blue). After imaging of the wells, raw feature vectors (median cell readouts per well) are extracted describing the phenotypic responses to the treatments. The z transformation of each readout using medians and median average deviations of all neutral control wells yields final HCS fingerprints. Similar phenotypic readouts lead to similar HCS fingerprints.
All similarity measures were tested on the 290-dimensional HCS fingerprints (full-length HCS fingerprints). The similarity measures were also measured on compressed HCS fingerprints, which have been transformed into new coordinate systems with a reduced number of dimensions. For these transformations, a linear and a nonlinear approach were evaluated. The linear technique is the widely used PCA. The nonlinear technique is based on unsupervised random forest similarity calculation and subsequent multidimensional scaling, which we call RFS.22,24 For both PCA and RFS, 21 compression levels were used, differing in the final number of dimensions. For the generation of the 21 PCA-compressed HCS fingerprints, PCA was performed on all full-length HCS fingerprints in the test set under consideration. From the principal components that were sorted by their eigenvalues, the top x% principal component scores were kept (x = 1, 5, 10, 15, 20, . . . ., 100). For the generation of the 21 RFS-compressed HCS fingerprints, unsupervised random forest similarities between all full-length HCS fingerprints in the test set under consideration were calculated. The resulting similarity matrix was used as input to multidimensional scaling. Again, x% of the original number of readouts (x = 1, 5, 10, 15, 20, . . . ., 100) were retained in this step.
Similarity Measures
We evaluated the performance of a variety of similarity and distance measures (from now on, both are called similarity measures) for their ability to identify relevant patterns in multivariate HCS fingerprints. Regarding the mathematical theory behind these methods, they can be grouped into six categories: (1) distance measures, (2) linear and (3) nonlinear correlation measures on a ratio scale, (4) nonlinear correlation measures on an ordinal scale, (5) measures comparing sets of up- and downregulated features using a threshold for set definition, and (6) CMAP-like similarity measures comparing mutual distributions of a predefined number of up- and downregulated features. Table 1 gives an overview of all tested methods with the respective parameter space. A detailed description of the similarity measures is given in the supplementary material.
Overview of the Six Tested Similarity Measure Types with Evaluated Parameters.
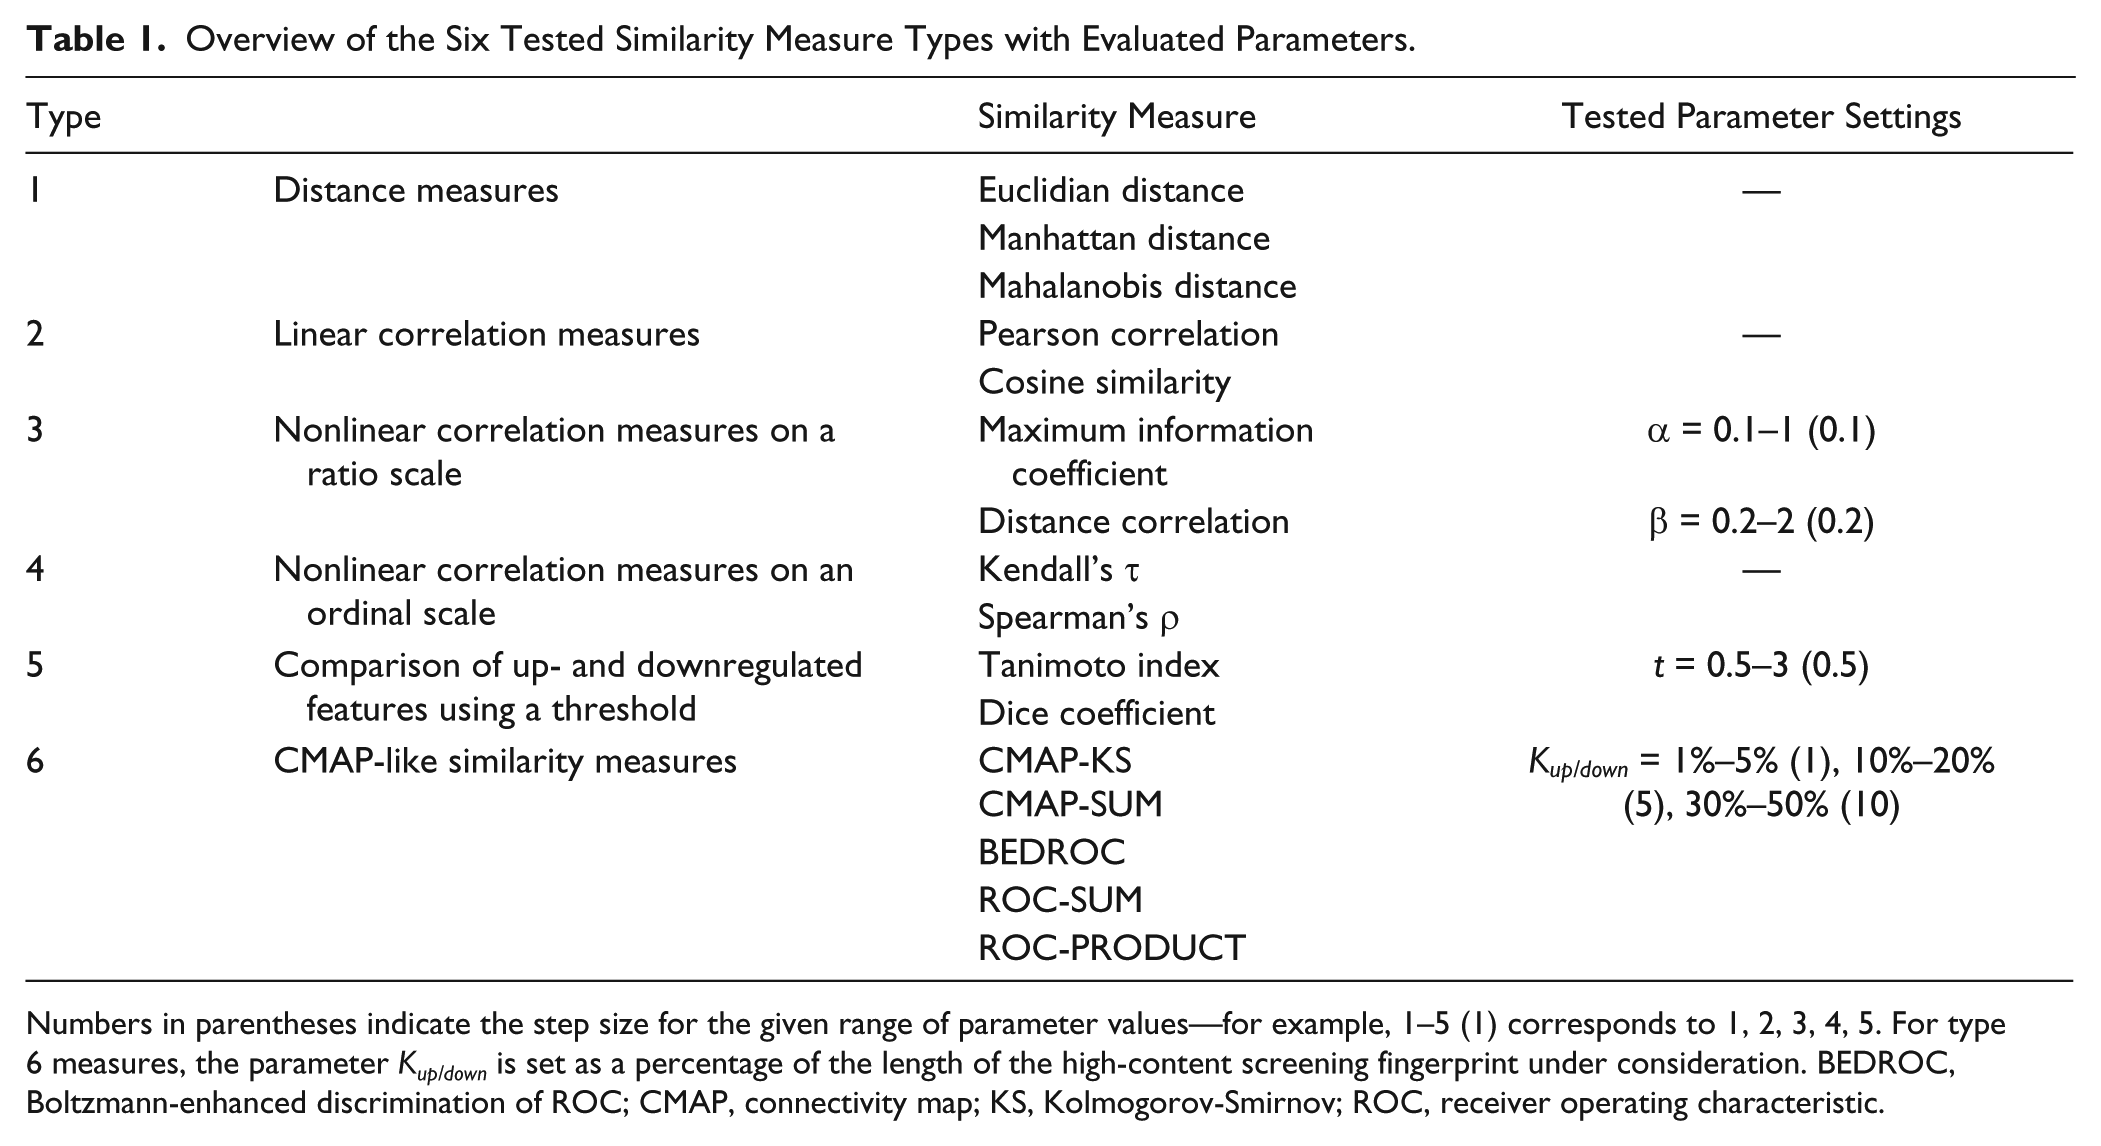
Numbers in parentheses indicate the step size for the given range of parameter values—for example, 1–5 (1) corresponds to 1, 2, 3, 4, 5. For type 6 measures, the parameter Kup/down is set as a percentage of the length of the high-content screening fingerprint under consideration. BEDROC, Boltzmann-enhanced discrimination of ROC; CMAP, connectivity map; KS, Kolmogorov-Smirnov; ROC, receiver operating characteristic.
Performance Evaluations
For the evaluation of the HCS fingerprint comparison performance, we applied combinations of similarity measures and feature reduction methods in four different evaluation settings. The first two performance evaluations focus on the separation of neutral and positive controls. Performance evaluation 3 assesses the methods’ abilities to discriminate between various kinds of phenotypes that occur in the assay. The fourth evaluation analyses phenotype chemotype correlations (i.e., the methods’ abilities to find phenotype similarities of cells treated with chemically related compounds).
Separation of neutral and positive controls I (performance evaluation 1)
For the first performance evaluation, pairwise similarities within neutral controls (neutral intraclass similarities) and between positive and neutral controls (interclass similarities) ( Fig. 2A ) were calculated. By intuition, calculated intraclass similarities should be higher than interclass similarities. The quality of the separation between these distributions depends on the measure of similarity and the feature reduction method used. This performance evaluation corresponds to finding phenotypes that are different from the neutral control phenotype. A widely used index in this context is the Z′ factor (Z′). 25 Depending on the normalization of the data and the used similarity measure, a good separation can be hampered: correlation-based methods are not able to detect similarity within a control group if this group was used for normalizing the data. Thus, high Z′ values are not expected.
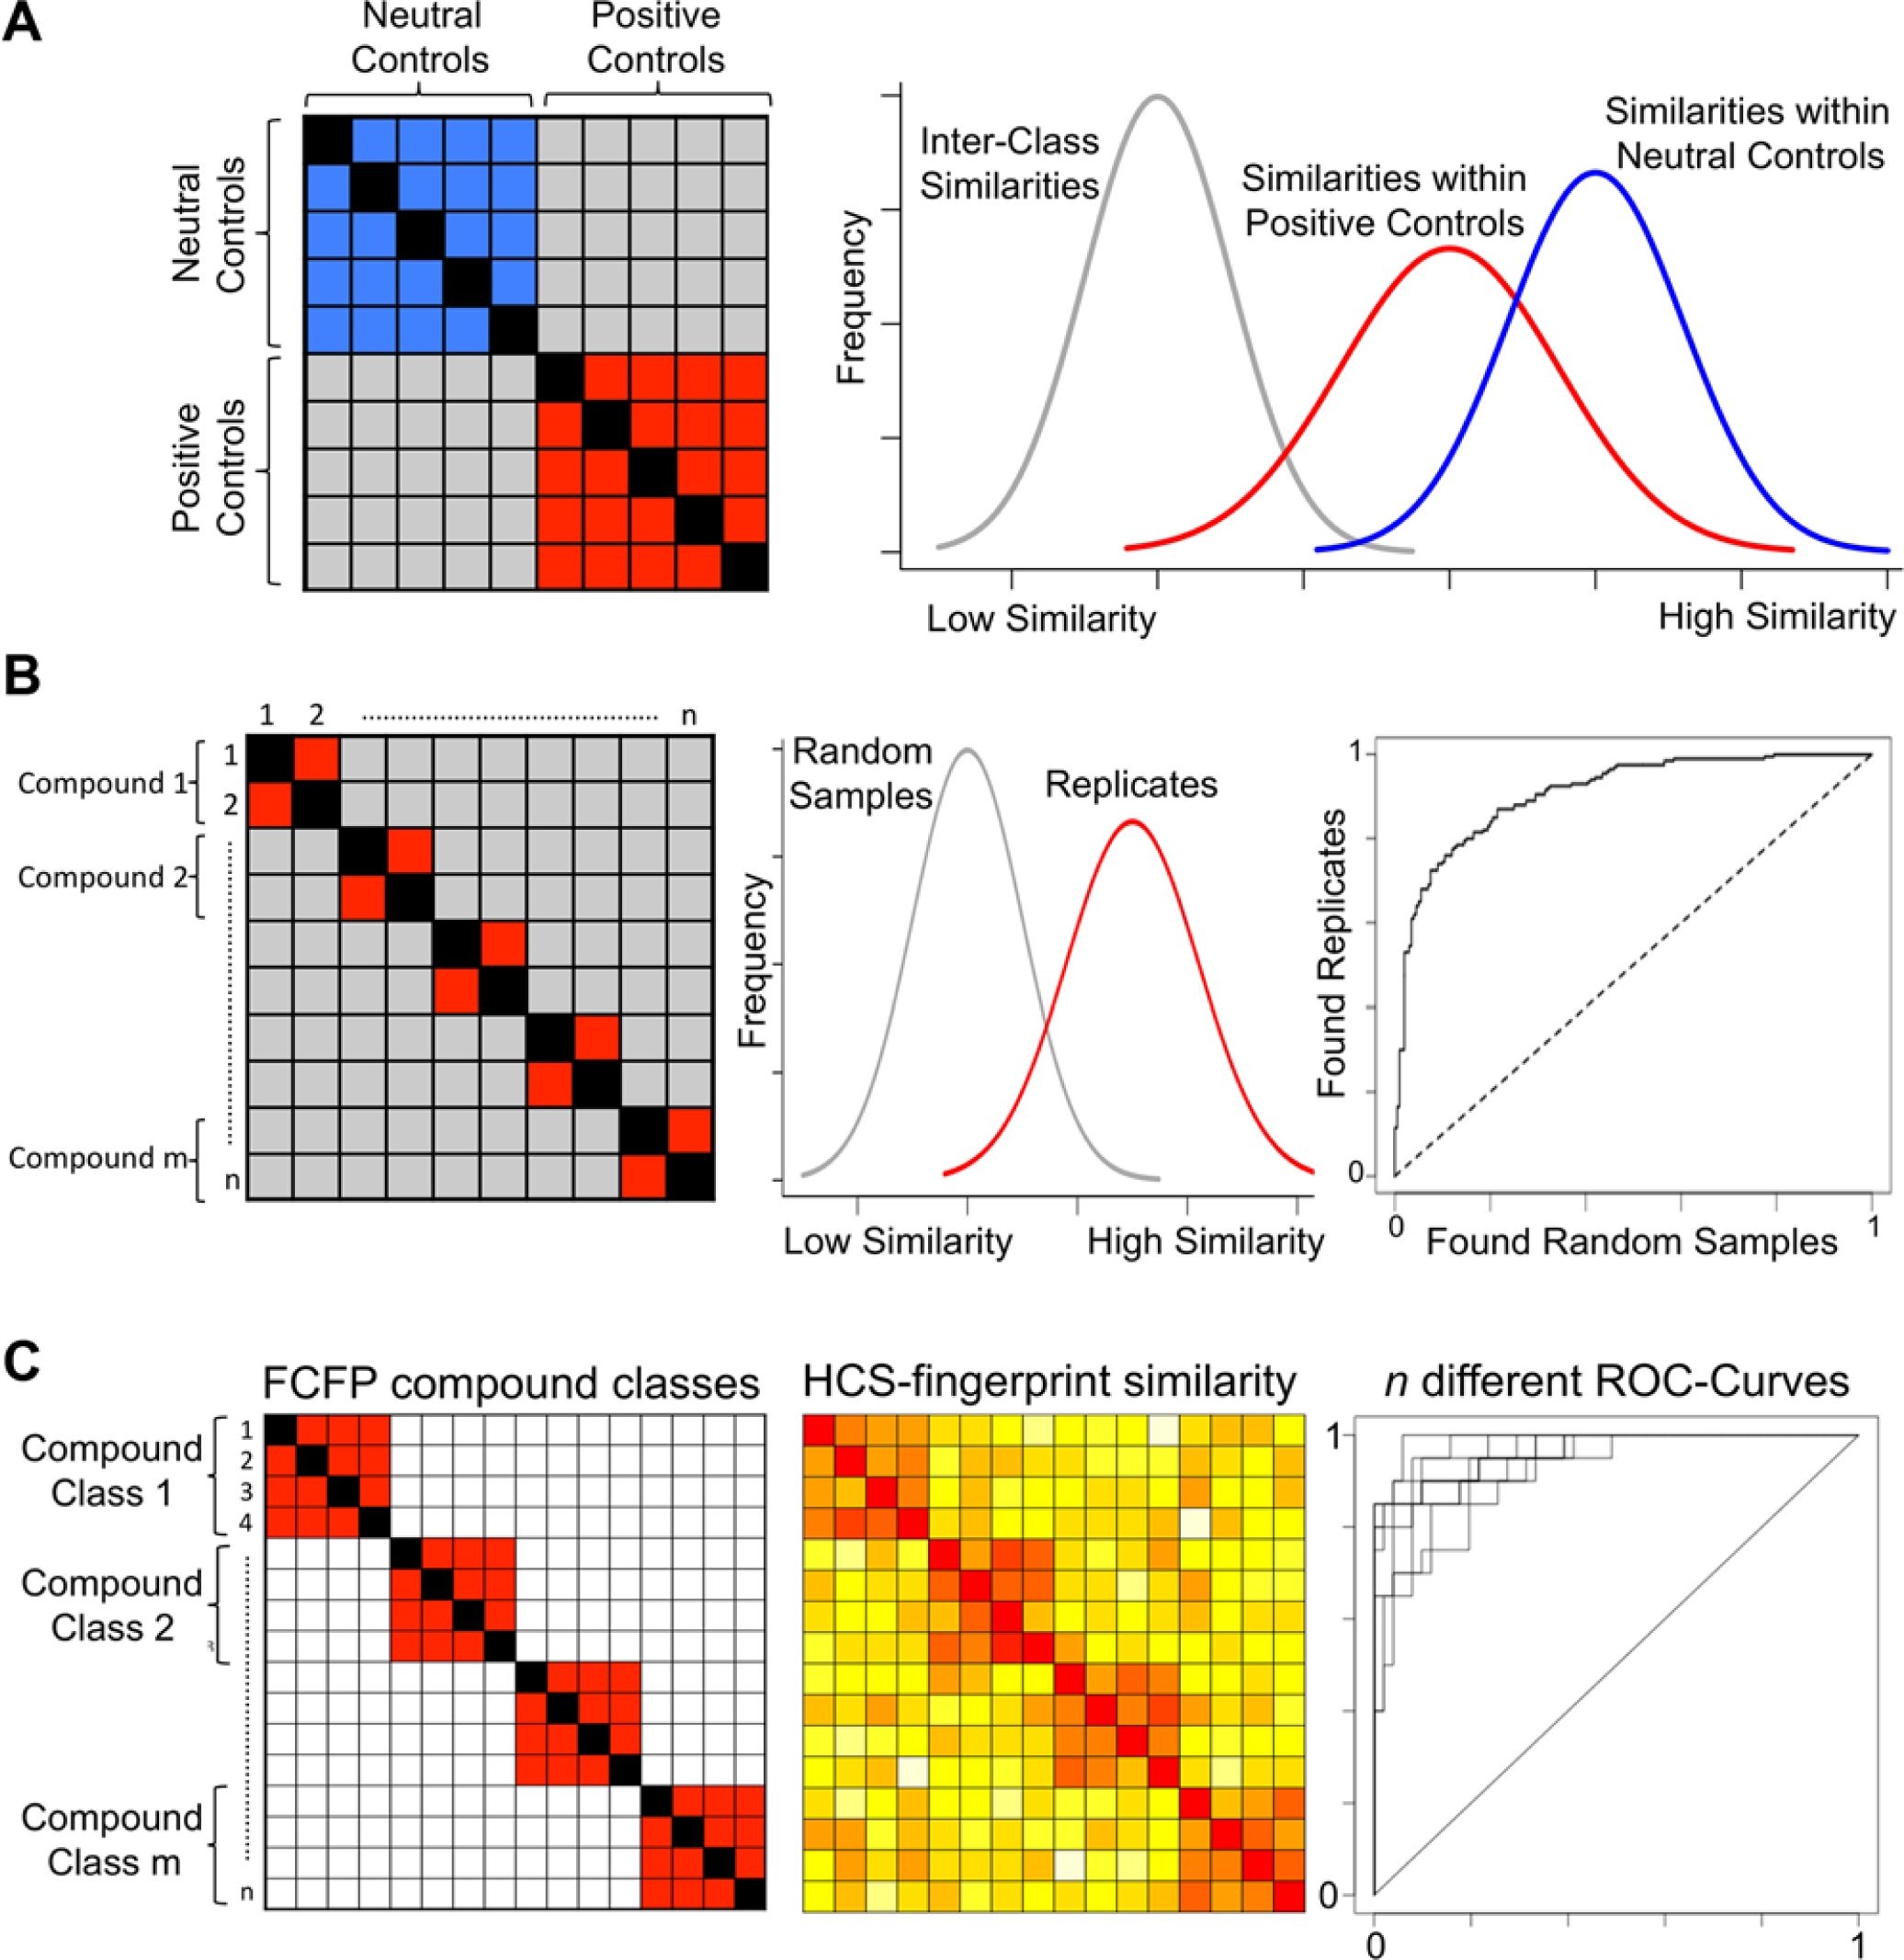
Different types of performance evaluations for high-content screening (HCS) fingerprint similarity measures. (
For the evaluation, 1000 neutral and 1000 positive controls were randomly selected from the overall 120,000 control wells. Neutral intraclass similarities were calculated on the basis of 500 pairs of neutral control wells. These were compared with interclass similarities between 500 mixed well pairs, each consisting of a positive and a neutral control well (the 500 remaining positive controls were used in performance evaluation 2). For each tested parameterization of the similarity measures in combination with each compression level of the different feature reduction methods, we obtained the interclass and intraclass similarity distributions and calculated the corresponding Z′ values. To estimate the reproducibility of the similarity measure performances and reduce the risk of overfitting, we repeated these calculations 10 times on 10 different sets of randomly chosen 1000 neutral and 1000 positive controls. For each combination between a similarity measure and a feature reduction method, we determined the best parameter combination (similarity measure parameter and compression level) using average Z′ values across the 10 repetitions as a selection criterion. The different combinations between similarity measures and feature reduction methods were finally compared using Z′ distributions of the best parameterization. In Figure 3 , each boxplot shows the Z′ distribution of the best parameterization for the respective combination of similarity measure and feature reduction methods.
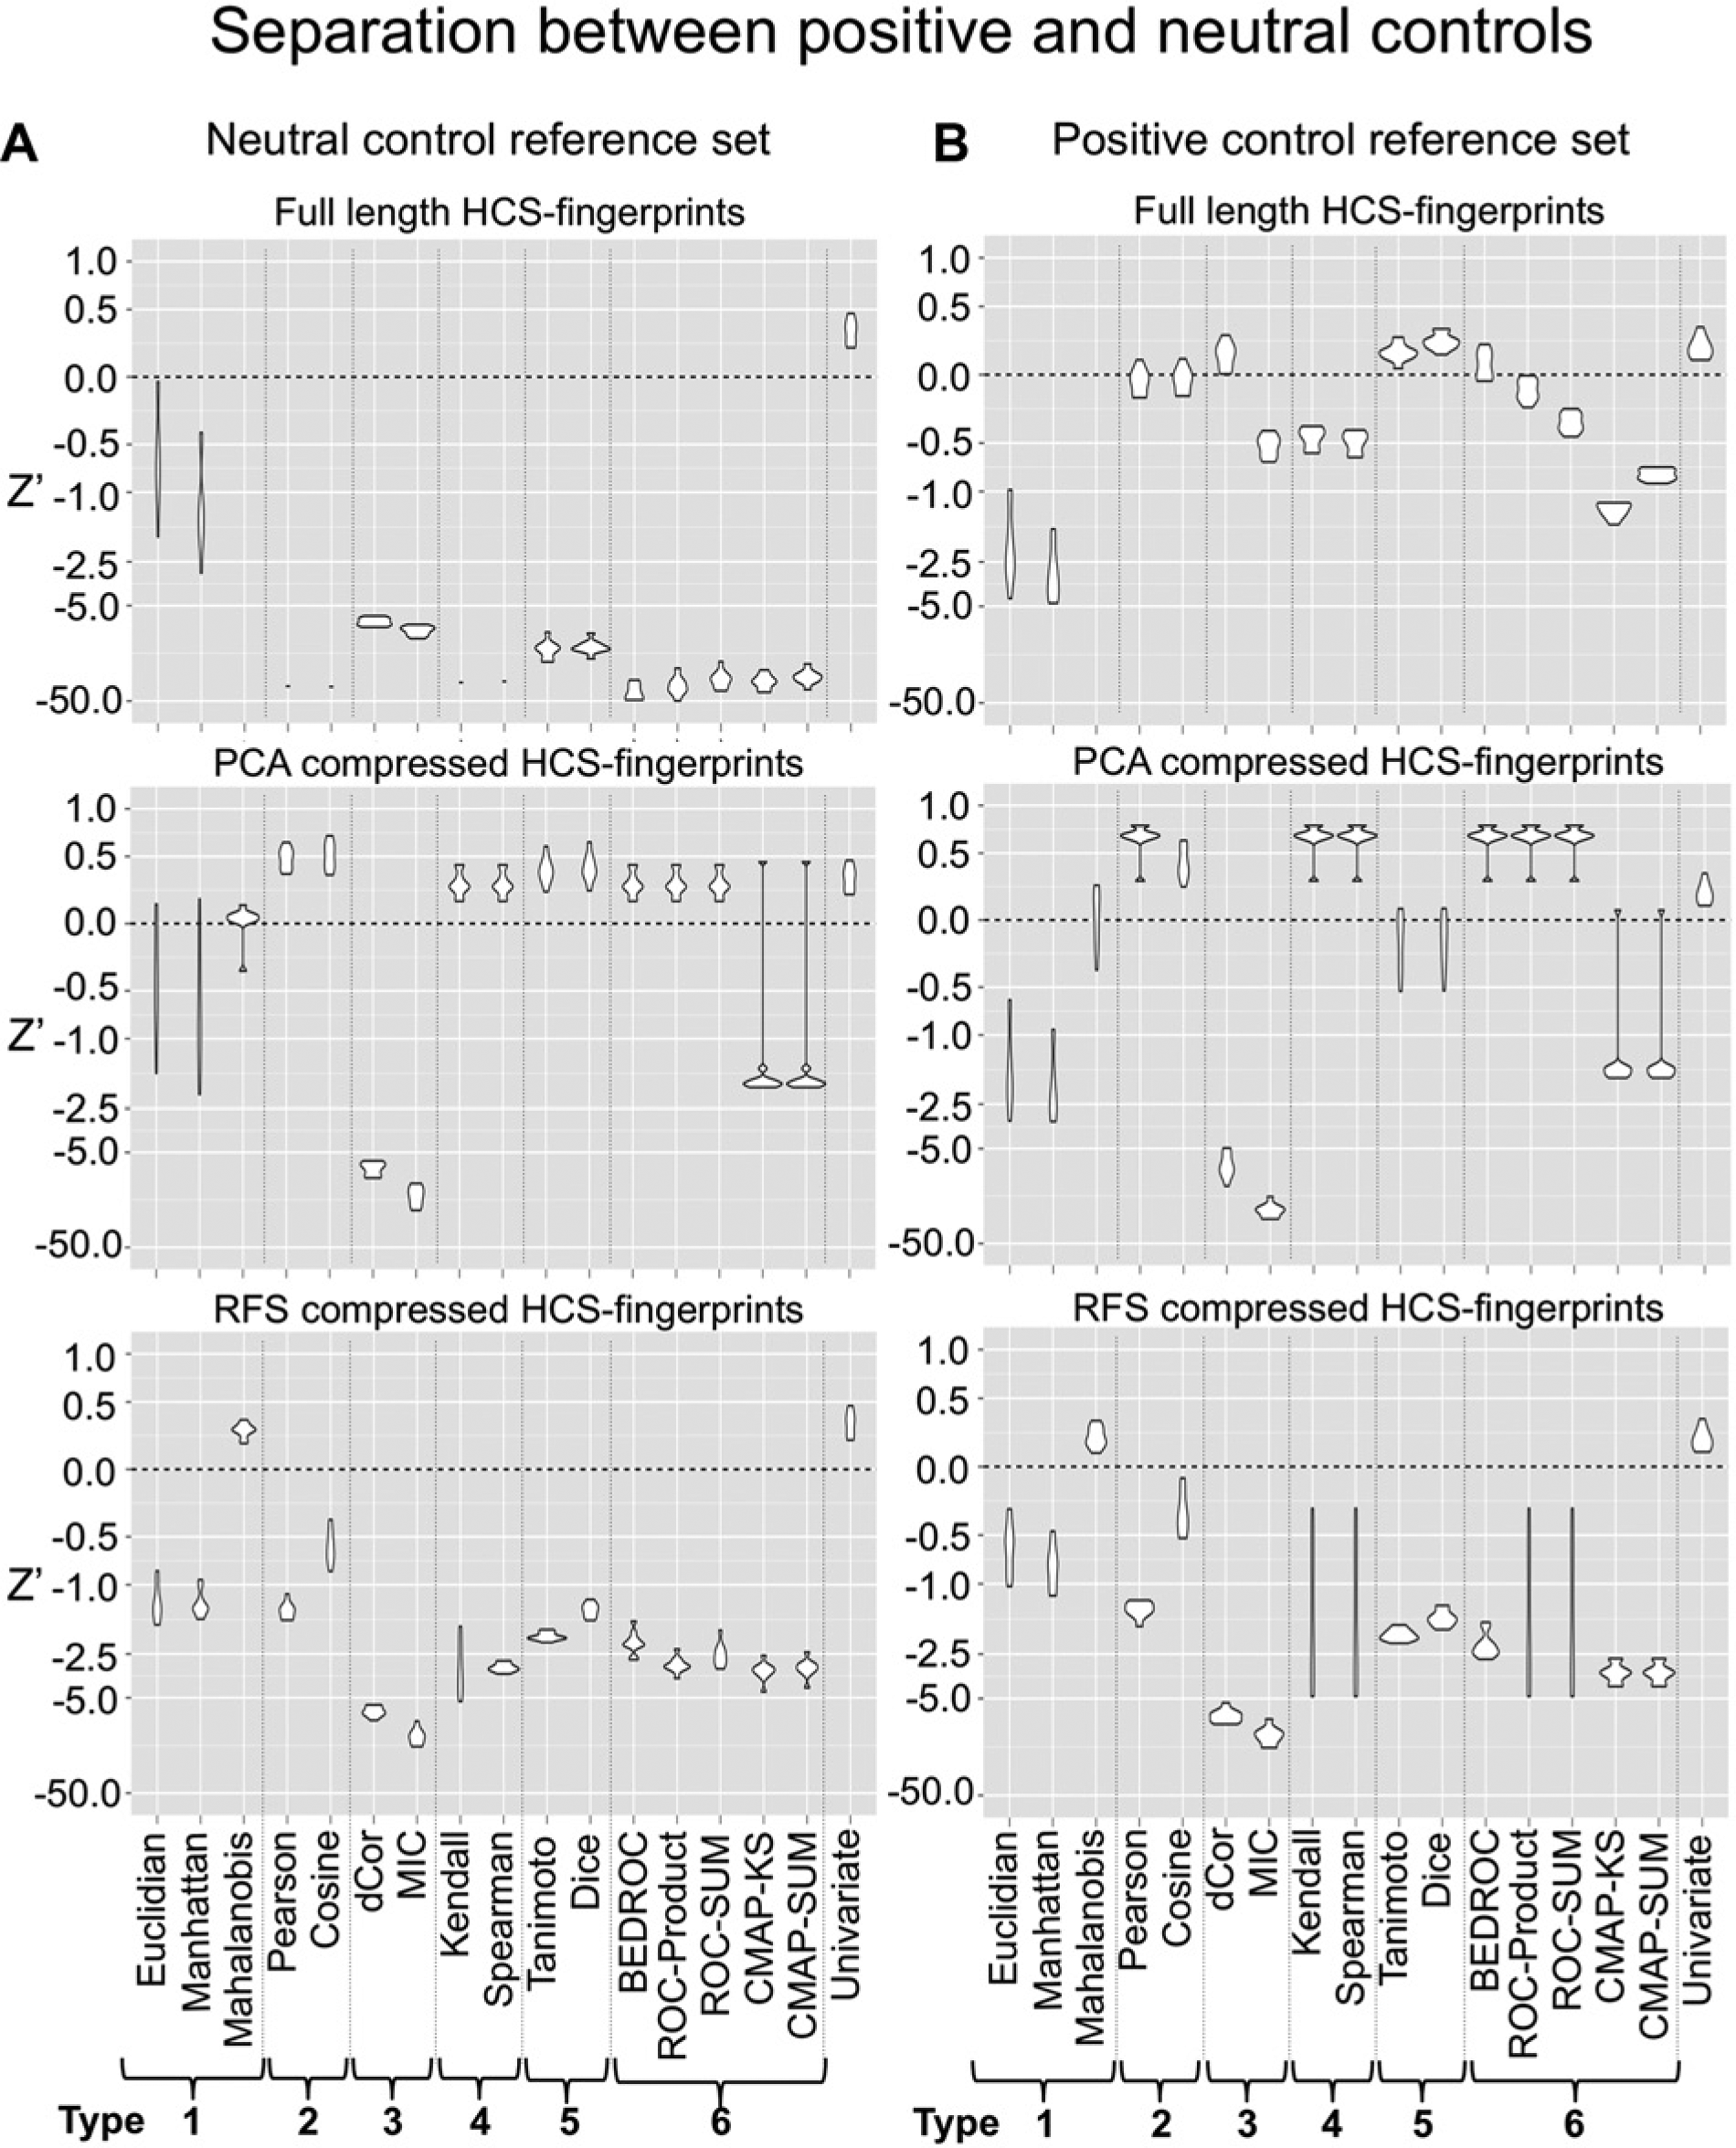
Separation between positive and neutral controls. (
For the determination of the best univariate performance, for each readout, 10 Z′ values were calculated on the same 10 test sets as for the HCS fingerprint comparison evaluation. Again, the best univariate readout was determined using average Z′ values across the 10 repetitions as a selection criterion. The shown univariate performance in Figure 3 corresponds to the performance of the average best individual readout.
Separation of neutral and positive controls II (performance evaluation 2)
For the second performance evaluation, pairwise similarities between positive controls (positive intraclass similarities) and between positive and neutral controls (interclass similarities) ( Fig. 2A ) were calculated. This evaluation setting could be seen as a way for assessing the methods’ abilities to detect compounds leading to phenotypes that are similar to the positive control. As in the previous section, the quality of the separation was assessed with Z′ distributions across 10 different test sets. These 10 test sets are identical to the 10 test sets in performance evaluation 1, but intraclass similarities are now calculated using 500 randomly picked pairs of positive control wells. The univariate performance was calculated in analogy to performance evaluation 1, but again the positive intraclass similarities were compared with the interclass similarities.
Separation of multiple phenotypes using replicates (performance evaluation 3)
In the third performance evaluation, the similarity measures were tested according to their ability to separate various sample phenotypes. This analysis was based on active replicates (i.e., compounds that were measured twice in the assay and induced phenotypes different from the neutral control phenotype). Similarities were calculated between pairs of replicates and pairs of randomly picked active compounds ( Fig. 2B ). It is expected that replicates lead to approximately the same phenotypic response across different wells. The calculated HCS fingerprint similarities between replicates should by trend be higher than similarities between randomly picked phenotypes. However, a small fraction of randomly picked phenotypic responses can also be similar so that no perfect discrimination between the two similarity distributions can be expected. For this reason, the receiver operating characteristic area under the curve value (ROC-AUC) 26 was applied for measuring the performance between the two similarity distributions: all calculated similarities for pairwise replicates are marked as true positives, and all calculated similarities for randomly picked HCS fingerprint pairs are marked as true negatives. In this rank-based statistic, which is highly related to the Wilcoxon rank sum statistic, 26 an ROC-AUC value of 1 corresponds to a perfect separation, while an ROC-AUC value of 0.5 indicates that the separation performance is random.
We extracted all active compounds that were measured twice in the assay, leading to a set of 53,106 wells or rather 26,553 different compounds. From these, we calculated for each combination of similarity measures and feature reduction methods pairwise similarities between 1000 randomly chosen replicates and between 1000 well pairs that were treated with different active compounds. With the obtained similarity distributions, we calculated ROC-AUC values for each combination between the similarity measure and feature reduction method. As for the previous performance evaluations, we repeated these calculations 10 times on different sets and determined the average best parameterization for each combination of the similarity measure and feature reduction method. These different combinations were finally compared using ROC-AUC distributions of the best parameterization. The univariate performance was calculated in analogy to performance evaluations 1 and 2.
In performance evaluation 3, all wells having a Mahalanobis distance to the median of the neutral controls greater than a threshold t were treated as active. t was chosen so that 99% of neutral control wells had a distance below this threshold. For determining the Mahalanobis distance, PCA was performed on the full-length HCS fingerprints of all wells. The principal components were sorted according to their eigenvalues, and the minimum number of top-ranked principal components was retained so that their cumulated explained variance was greater than 99%.
Chemotype-phenotype correlations (performance evaluation 4)
In the last performance evaluation, the similarity measures and feature reduction methods are tested for their ability to detect a potential correlation between chemical similarity and HCS fingerprint similarity. Assuming that compounds with related chemical structures have similar activity 27 and therefore induce similar cellular responses, HCS fingerprints from wells treated with similar compounds are expected to be more similar than HCS fingerprints from wells treated with compounds that show low chemical similarity.10,14 In other words, compounds with similar structure are expected to have similar HCS fingerprints.
For testing this hypothesis, we randomly selected 1000 active compounds and calculated pairwise chemical similarities as the Tanimoto coefficient of the FCFP-4 fingerprints.
28
FCFP-4 was chosen for its consistent performance across various target classes,
29
but other chemical descriptors capturing different aspects of molecular structure could be employed analogously.
30
Next, we selected from these compounds a subset so that each compound shared high chemical similarity (>0.7) with at least three other compounds in the subset. Then, we calculated all pairwise HCS fingerprint similarities within this subset and sorted for each compound all other compounds of the subset according to this HCS fingerprint similarity. Subsequently, we calculated the resemblance between chemical fingerprints and HCS fingerprints by determining ROC-AUC values for each compound based on the compound orderings. Compounds with chemical similarity >0.7 were regarded as true positives, whereas all other compounds were regarded as false positives (
Fig. 2C
and
Software
All calculations on the HCS fingerprints and statistical tests were done with R v2.15.2 (R Foundation for Statistical Computing, Vienna, Austria). The following R-packages were used: “enrichvs” for calculation of ROC and Boltzmann-enhanced discrimination of ROC (BEDROC) values required for the similarity measures and the evaluation of the results, “energy” for calculating the distance correlation, “minerva” for calculating the MIC, the cor function of the stats package for calculating Kendall’s τ and Spearman’s ρ, and “randomForest” for RFS feature reduction. Chemical similarity using FCFP-4 was calculated with Pipeline Pilot v. 8.0.1.500 (Accelrys Software, San Diego, CA).
Results
Separation of Neutral and Positive Controls I (Performance Evaluation 1)
In the first performance evaluation setting, we analyzed the methods’ potential to discriminate between neutral control–like phenotypes and positive control–like phenotypes by calculating intraclass similarities within neutral controls and comparing them with interclass similarities between neutral and positive controls (see Materials and Methods for details). As a criterion for the separation quality, we calculated Z′ on the basis of these two similarity distributions.
Full length HCS fingerprints
Using full-length HCS fingerprints, none of the multiparametric similarity measures is able to achieve Z′ values, indicating reasonable separation performance (
Fig. 3A
, top). The Euclidian distance performs best with a median Z′ of –0.67. Even though this corresponds to an almost perfect separation of both similarity distributions (
While a good multiparametric distinction between positive and neutral controls with full-length HCS fingerprints seems difficult to achieve, univariate readouts are able to separate both sets: the best individual readout achieves a median Z′ of 0.34 (see
PCA-compressed HCS fingerprints
We found that data transformation with PCA can lead to improved performance of almost all similarity measures (
Fig. 3A
, middle). In particular, type 2 methods—namely, Pearson correlation and cosine similarity—lead to an excellent separation between both sets as indicated by median Z′ values of 0.5 for both methods. With the exception of CMAP–Kolmogorov-Smirnov (KS) and CMAP-SUM, nonlinear correlation methods (types 3, 4, 5, and 6) also perform well. Interestingly, all similarity measures that achieve a Z′ of 0 or greater show optimal performance on the maximum PCA compression level in which only 1% of the principal components are kept (1% of the original feature space ~2 principal components; see
RFS-compressed HCS fingerprints
The nonlinear feature reduction method using random forests enables improved discrimination of positive and neutral controls for correlation-based methods, even though the effect is not as apparent as on the PCA-compressed data ( Fig. 3A , bottom) since separation with Z′ values greater than 0 is not possible. The Euclidean and Manhattan distances again do not benefit from the data transformation or the feature reduction. Only in combination with Mahalanobis distance is a good separation between positive and neutral controls possible (median Z′ = 0.28).
The reason for differences in similarity measure performance between PCA and RFS can be explained by comparing the distribution of positive and neutral controls in the corresponding 2D spaces (
Separation of Neutral and Positive Controls II (Performance Evaluation 2)
The second performance evaluation of the similarity measure methods was conducted in analogy to the first performance evaluation, with the only difference that intraclass similarities among positive controls were taken as a reference set and compared with interclass similarities (see Materials and Methods).
Full-length HCS fingerprints
When using full-length HCS fingerprints, the results strongly differ from performance evaluation 1. In the second performance evaluation, the correlation-based methods clearly outperform distance-based methods with Z′ values that are comparable to the performance of the best individual readout ( Fig. 3B , top). With median Z′ values of 0.15 and 0.23, group 5 similarity measures—namely, the Tanimoto index and Dice coefficient—perform best. Also, distance correlation (median Z′ = 0.15) and the BEDROC similarity (median Z′ = 0.06) show potential for distinguishing samples from positive and neutral controls. Also, all other correlation-based methods (types 2, 3, 4, 5, and 6) perform superior to the Euclidian and Manhattan distances, even though they would not be regarded as suitable for screening purposes (Z′ < 0). In contrast to performance analysis 1, the dimensions of the full-length HCS fingerprints are not normalized to the reference set and therefore do not contain approximately random distributed values. This makes the application of correlation-based methods on the full-length HCS fingerprints possible. Distance-based type 1 measures exhibit a slightly lower performance than in performance evaluation 1, which might be explained by a higher variance within positive control intraclass similarities when compared with neutral control intraclass similarities.
PCA- and RFS-compressed HCS fingerprints
The results on compressed data using PCA and RFS are comparable to the results in the first performance evaluation ( Fig. 3B , bottom and middle). Again, a strong performance increase can be observed for type 2, 4, and 6 similarity measures with HCS fingerprint compression by PCA. With median Z′ values of up to 0.67, these three similarity measure types show excellent separation between positive and neutral controls that exceeds the performance of the best univariate readout (median Z′ = 0.19). Among type 1 distance measures, again only Mahalanobis distance is able to achieve a reasonable separation between both control groups (median Z′ = 0.08). Also, with RFS-compressed HCS fingerprints, the Mahalanobis distance performs well (median Z′ = 0.19), while all other similarity measures are not able to achieve Z′ values greater than 0. In general, the trends of the median performances on RFS-compressed HCS fingerprints in the first two performance evaluations are comparable.
Separation of Multiple Phenotypes Using Replicates (Performance Evaluation 3)
In the first two performance evaluations, the similarity measures were compared by their ability to optimize the assay window between positive and neutral controls as typically done for high-throughput screens. Even though this assay window is also very important in HCS campaigns, this type of evaluation does not capture multiple potential phenotypic outcomes that might affect successful hit calling. In performance evaluation 3, we tested the similarity measures’ abilities to distinguish between multiple phenotypes (see Materials and Methods).
Full-length HCS fingerprints
In combination with full-length HCS fingerprints, correlation-based methods (types 2, 3, 4, 5, and 6) outperform distance-based measures and also the best individual readout ( Fig. 4A , top). In particular, the nonlinear correlation measures MIC and distance correlation (type 3) and Spearman’s ρ and Kendall’s τ similarity measures (type 4) with median ROC-AUC values of 0.90 are able to discriminate well between similar and nonsimilar phenotypes. Interestingly, CMAP-KS (median ROC-AUC = 0.79) is clearly outperformed by the other CMAP-like methods (type 6), indicating that all proposed variants of the CMAP similarity possess a significantly better discriminative potential than the Kolmogorov-Smirnov statistic-based CMAP similarity itself (t test: all p < 2.2*10–16). This might be due to the fact that the BEDROC, ROC-SUM, ROC-PRODUCT, and CMAP-SUM similarity measures do not rely on single supremum values of up- or downregulated feature distributions but integrate all distribution values of the features under consideration. This might add to the robustness and therefore improved performance of the measures (see supplementary material for details).
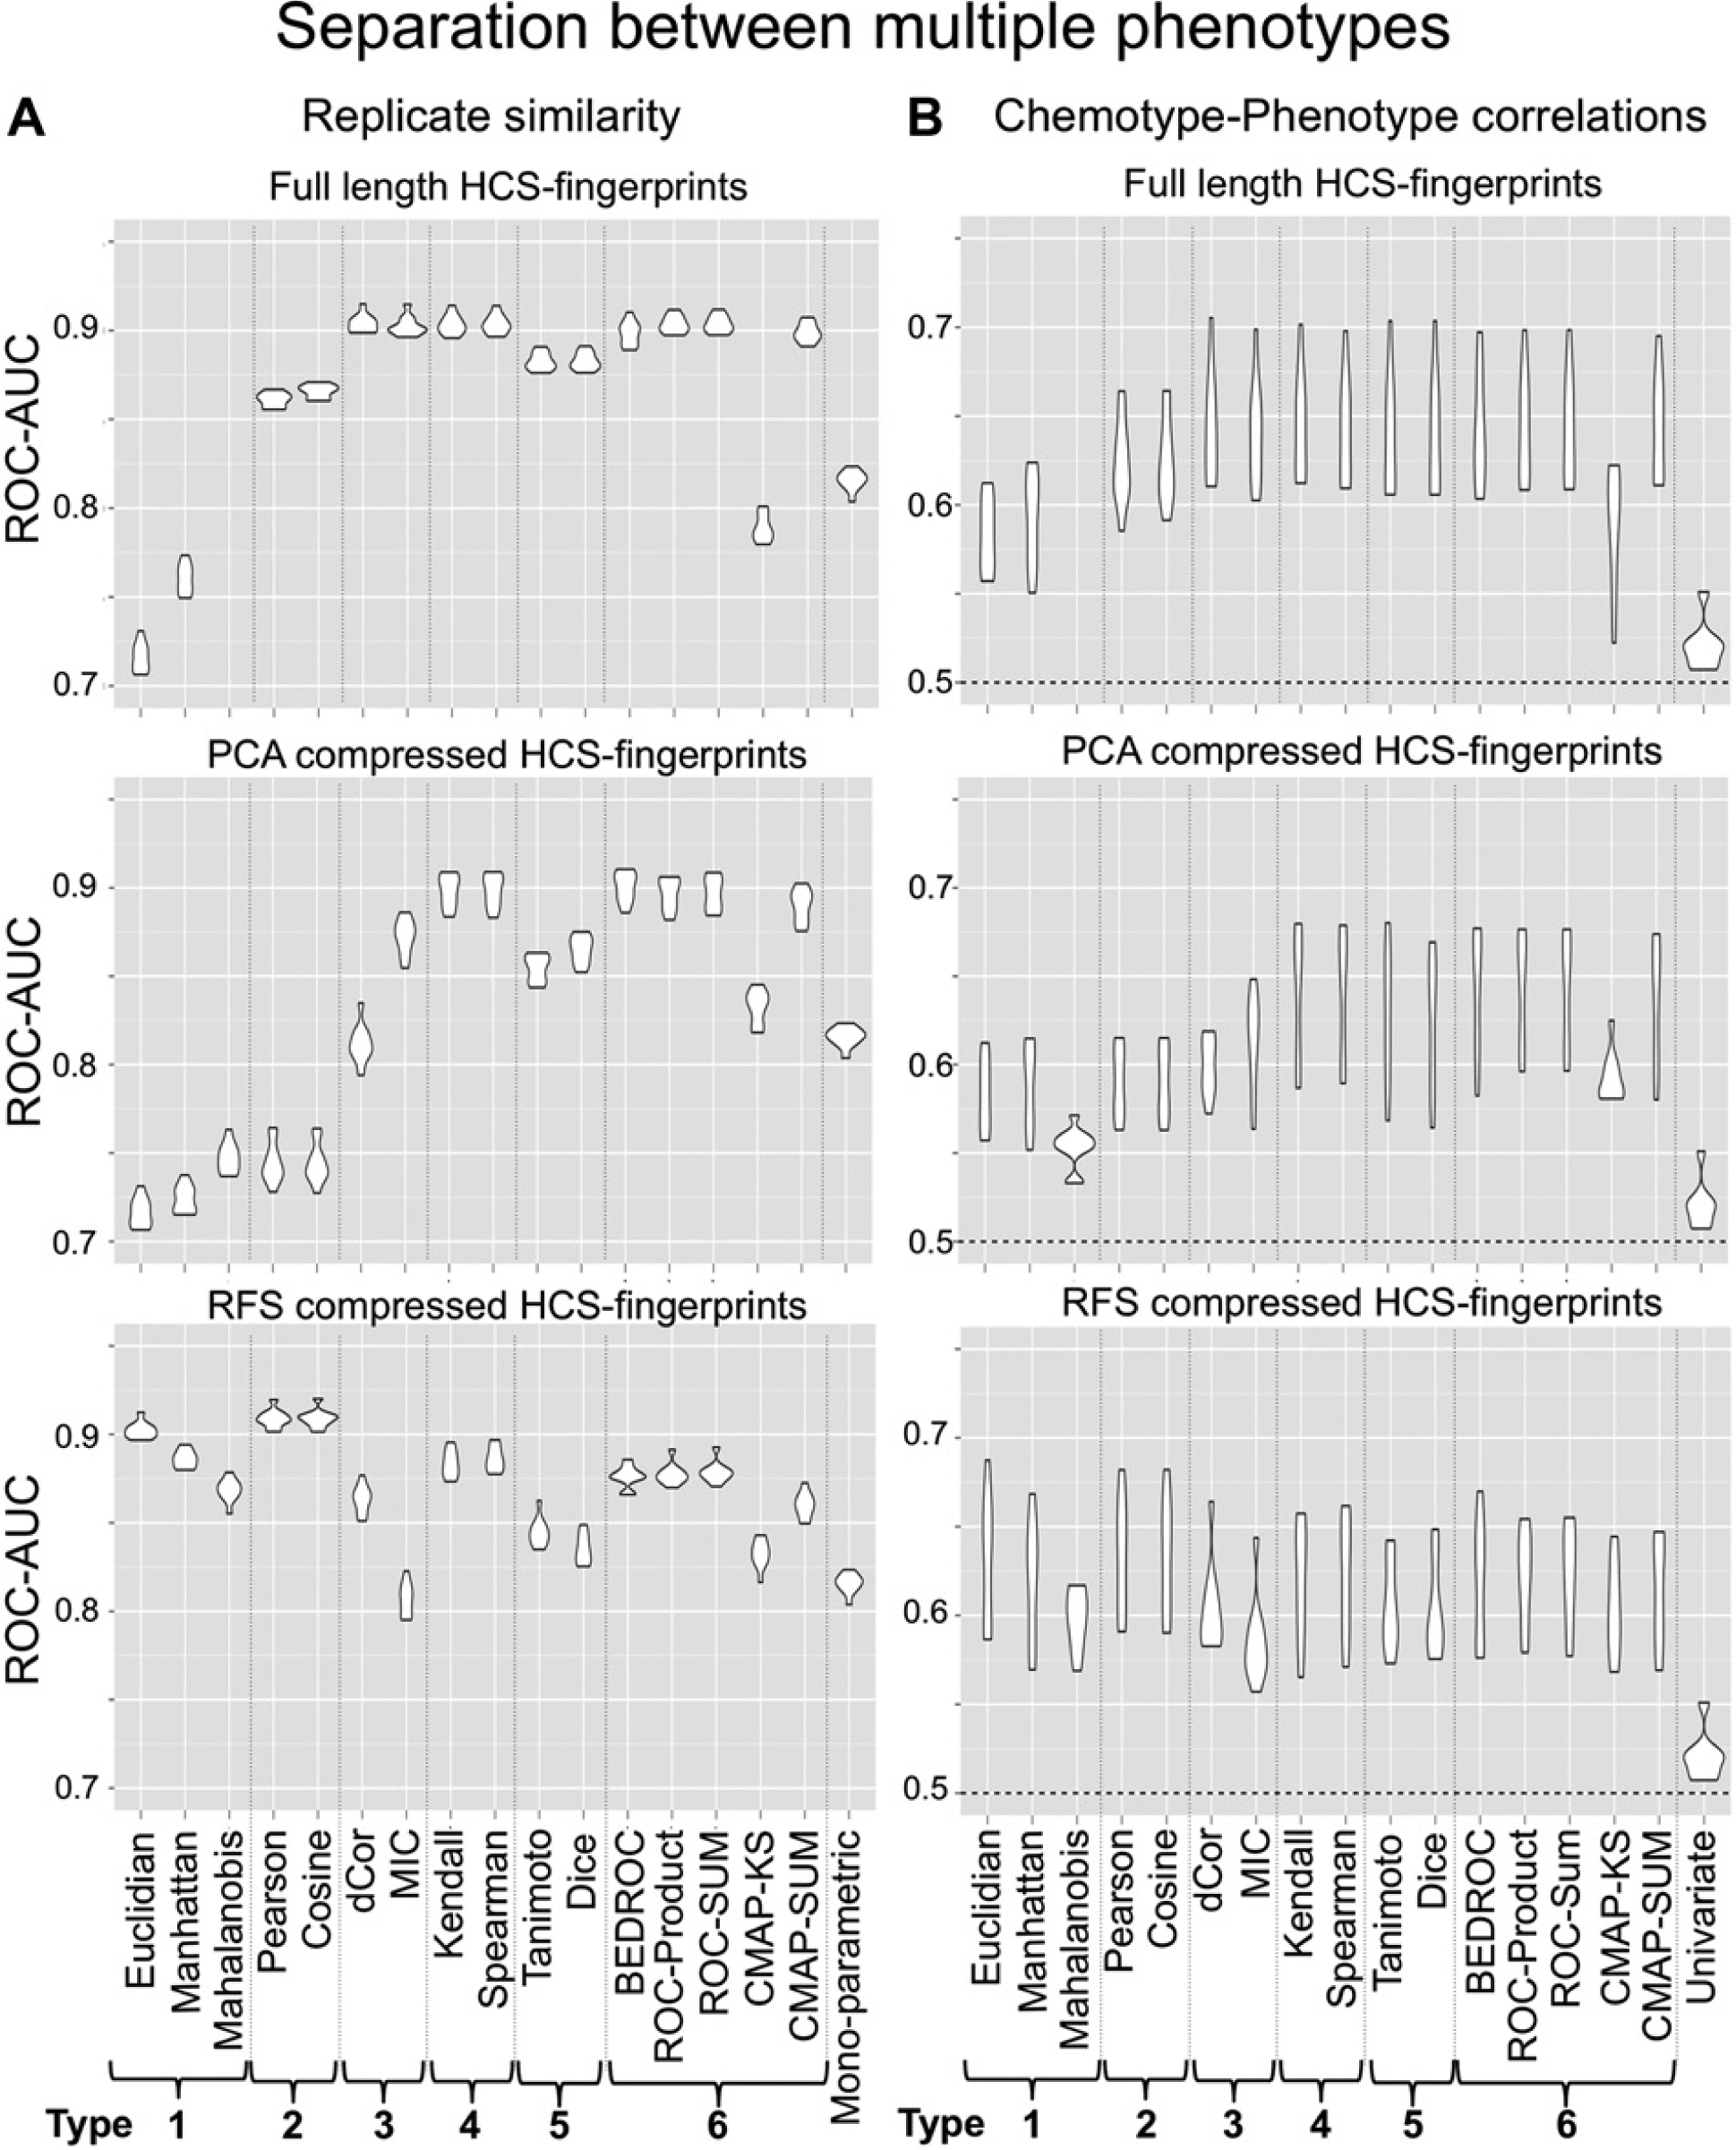
Discrimination between multiple phenotypes. (
PCA-compressed HCS fingerprints
The trend among CMAP-like similarity measures is also observable in combination with PCA- and RFS-compressed HCS fingerprints ( Fig. 4A , middle, bottom): BEDROC, ROC-SUM, ROC-PRODUCT, and CMAP-SUM perform significantly better than CMAP-KS (t test: all p < 2.2*10–16). With median ROC-AUC values of 0.9 on PCA-compressed HCS fingerprints, they perform comparable to the type 3 methods of Spearman’s ρ and Kendall’s τ. In contrast, the type 2 measures of Pearson correlation and cosine similarity perform not as well as with full-length HCS fingerprints. Eventually, strong differences between the ranges of the individual principal component scores hamper the performance of these linear methods. The nonlinear type 3 measures cope better with the different scales but perform worse than on the nontransformed data.
Random forest HCS fingerprints
Using RFS-compressed HCS-fingerprints, the type 2 measures of Pearson correlation and cosine similarity with median ROC-AUC values of 0.91 perform better than the nonlinear methods (types 3, 4, 5, and 6). Interestingly, with median ROC-AUC values of 0.90, the Euclidian distance also works well. In contrast to the control separation performance evaluations, the Mahalanobis distance is not superior to the Euclidian or Manhattan distance. Here, the Mahalanobis distance cannot make use of a specific reference set, which explains why the separation between replicates and random pairs is not superior to just using the Euclidian distances.
Chemotype-phenotype correlations (performance evaluation 4)
One potential application of HCS fingerprints is to establish a link between compound-induced phenotypes and the compounds’ MoA.10,14 Assuming that chemically similar compounds have similar MoA and therefore induce similar phenotypes, we can evaluate similarity measures for their potential to detect related MoA among compounds (see Materials and Methods).
As for performance evaluation 3, we find that optimal performance can be obtained with and without feature reduction ( Fig. 4B ). An important finding is that all similarity measures on multiparametric readouts perform better than the best individual readout. In fact, the performance of the latter is almost random (median ROC-AUC = 0.52). This shows that a multiparametric analysis can increase the applicability domain of an HCS. Due to the rather large variance among the 10 test sets, a clear prioritization for a similarity measure in combination with a feature reduction method is difficult. The rather small number of compounds in the test sets (85 ± 14) might be responsible for this variance. Nevertheless, the trend of median performances is similar to the performance trends in the replicate performance evaluation: on full-length HCS fingerprints and PCA-compressed HCS fingerprints, nonlinear similarity measures (types 3, 4, 5, and 6) perform well, while on RFS-compressed HCS fingerprints, Pearson correlation, cosine similarity, and Euclidian distance are superior.
Discussion
In this study, we presented different possibilities for evaluating the applicability of similarity measures as well as feature reduction methods for comparing HCS fingerprints. An advantage of HCS over traditional screening technologies is its ability to monitor multiple compound effects, both desired and undesired. HCS is able to simultaneously monitor the different phenotypic outcomes of the assay. Computationally, this is only possible with similarity measures that are able to distinguish between various phenotypes that are distinct from the neutral control. The evaluation of feature reduction methods and similarity measures in this context is challenging due to the lack of comprehensive and reliably annotated test sets consisting of all different phenotypes that can occur in an assay. Manual annotation is not feasible because of the scale of the data sets involved and because the process is laborious and subjective. Instead, we evaluated the methods based on separation of the neutral and positive control phenotypes, detection of different sample phenotypes by analyzing similarities among replicates, and consistency with chemical structure similarity. Due to the large scale of our analysis, we concentrated on aggregated well features rather than including population statistics for describing phenotypic effects of compounds. We assume that for our screen, this is reasonable because well populations appeared homogeneous upon visual inspection. Nevertheless, cell-based analysis of HCS is a valuable alternative to describe the phenotypic effects in even more detail. To tackle the computational demand of such analyses, graphics processing unit computing or classic parallel and distributed environments such as the Sun Grid Engine could be employed.
Discussion about the Four Performance Analysis Variants and Z′ Values
Comparing multiparametric analysis of data using HCS fingerprints and a univariate analysis in the first two performance evaluations might suggest that multiparametric analysis does not improve the assay quality. Nevertheless, several similarity measures, especially in combination with PCA, showed good separation between the control groups, indicating that even for binary classification tasks, multiparametric analysis can be beneficial. One drawback of the first two performance evaluations is that by focusing on the separation of only two reference sets, reductionist similarity measures and feature selection methods, which use only a fraction of the information in HCS data, might be favored. We observed that the selection of a similarity measure based on such performance analyses might be misleading due to overfitting on the two considered phenotypes: while for separation between two control groups, best results were obtained using only 1% of the principal components, in the more complex performance analyses 3 and 4, higher percentages of kept dimensions led to good results. This effect becomes most obvious when comparing performances of univariate readouts in control separation to performances in the phenotype-chemotype correlation analysis. Even though excellent separation is possible in the first two evaluations, suggesting strong information content in single dimensions, the best individual readout performs slightly better than random in the phenotype-chemotype correlation performance analysis.
For classic HTS campaigns yielding only a single readout, optimizing for Z′ might be adequate. In HCS, such an optimization might artificially diminish the power of this screening technology. Therefore, we assume that evaluation strategies such as the proposed replicate analysis and the chemotype-phenotype correlation analysis are better predictors for the actual performance of a similarity measure than a classic evaluation based on the separation between positive and neutral controls. Replicate and phenotype-chemotype correlation performance evaluations have the advantage that separation capabilities between various phenotypes occurring in the assays are assessed at once in an unsupervised manner. The gain in discriminative power can lead to more reliable hit calling in classic screening. Moreover, the Pearson correlation between the performances in these two evaluation strategies was 0.8, indicating that, by trend, a good separation between replicates and nonreplicates translates into good differentiation of different MoA of compounds. In contrast, correlation between the performances in the phenotype-chemotype correlation analysis and performances in both control group separation analyses was low (0.12 and 0.22 for performance evaluations 1 and 2). This shows that high performance in the discrimination of only two phenotypes does not translate well into a good differentiation between various modes of action.
We used the statistical effect size Z′ for evaluating similarity measures in the first two performance analyses. Z′ was developed for normal distributed data, but it cannot be expected that similarity distributions fulfill this criterion. Therefore, we compared calculated Z′ values with model-free ROC-AUC values and found that similar conclusions could be drawn about the performance of the tested similarity measures (data not shown). Since Z′ is an established measure for analyzing the quality of assays in the field, we decided to use it for our evaluation.
Comparison of Similarity Measure Performance
From our experiments, we learned that the tested correlation-based methods (types 2, 3, 4, 5, and 6) can be valuable for HCS fingerprint comparison but may be influenced by the preprocessing of the data and therefore have to be handled with care. The Euclidian, Manhattan, and Mahalanobis distances (type 1) are less sensitive to data preprocessing but also show weaker discrimination between different phenotypes. The rank-based Spearman and Kendall similarities, as well as MIC, distance correlation, and the CMAP-like similarities (types 4, 3, and 6), perform better (especially in performance evaluation 3) on the full-length HCS fingerprint than Pearson correlation, cosine similarity (both type 2), the Tanimoto index, and the Dice coefficient (both type 5) and thus provide an alternative to the frequently used Pearson correlation coefficient. The nonparameterized Kendall and Spearman similarity measures (type 4) perform at least as well as the more complex MIC, distance correlation (type 3), and the CMAP-like similarities (type 6) while having the advantage of not requiring additional parameterization. MIC and distance correlation (type 3) exhibit good separation results on the full-length HCS fingerprints but do not perform well in combination with the proposed feature reduction strategies. One reason for this might be the sufficiently large sample size that complex methods such as MIC rely on. 20 Among the CMAP-like similarities, the new proposed variants of the CMAP similarity clearly outperform the original implementation. In fact, the latter showed rather poor discriminative power in all evaluation scenarios, suggesting that the used KS statistic for vector comparison might not be a good choice for analyzing HCS fingerprint data.
In summary, we suggest using the rank-based nonlinear Spearman and Kendall similarities for the comparison of noncompressed HCS fingerprints, since these two methods yielded good results in our studies without requiring additional parameterization. The new proposed similarity measures based on ROC and BEDROC statistics might also be employed on other multiparametric data such as microarray readouts for which the CMAP similarity was originally developed.
Even though correlation methods (types 2, 3, 4, 5, and 6) showed strong performance in most of our evaluations, they failed to distinguish between control groups when neutral controls were used as a reference set. This indicates that although these methods can be very powerful, it is always important to consider the application and the data handling before choosing a similarity measure. In some cases (e.g., for identification of all treatments leading to phenotypes different from a reference set such as the neutral control), a distance-based similarity measure (type 1) might therefore be the best choice. In this case, Mahalanobis distance is an interesting variant to classic Euclidian distance because it incorporates data distribution parameters in the distance calculation. Alternatively, supervised machine learning techniques such as linear discriminant analysis, support vector machines, or neural networks could be employed. 7 Nevertheless, the choice of a suitable training set for these methods can be challenging since overfitting of the models toward the phenotypes that are part of the training set can occur.
Feature Reduction
Feature reduction methods, especially PCA, showed the expected signal amplification effect in both control separation performance evaluations, enabling excellent separation between neutral and positive controls. One should keep in mind that PCA only works well in these experiments if the two classes are separable along the greatest variance in the data. If readouts with great variance among the positive controls add noise to the separation, the success of PCA can drop dramatically. In such a scenario, RFS could be an alternative, as it showed good separation in combination with Mahalanobis distance in our experiments.
In the replicate and in the chemotype-phenotype correlation performance analyses, the overall performance was not substantially increased by any feature reduction method. The best similarity measures on reduced feature space performed as well as the best measures on full-length HCS fingerprints. Nevertheless, for PCA, on average 43% of the dimensions were kept, while for RFS, on average 9% of the original input space led to optimal results of the similarity measures. This shows that a strong compression of the data is possible without losing too much valuable information. If storage or comparison speed is a major issue, feature reduction methods can thus be beneficial. Otherwise, we suggest working with full-length HCS fingerprints to keep as much information as possible.
In our study, we focused on nonsupervised feature selection methods. Using supervised methods bears the risk of model overfitting toward phenotypes present in the training sets. As a consequence, detection and evaluation of phenotypes not present in the training set can be difficult. However, using supervised random forests for feature selection by taking advantage of estimated variable importance criteria such as the Gini index is also possible.
Our studies show that the right choice of a similarity measure is a prerequisite for high-quality HCS data analysis. Even though correlation-based methods can be affected by data normalization, they perform well on HCS fingerprint comparison. In particular, the nonlinear rank-based correlation methods Kendall’s τ and Spearman’s ρ seem to be suitable for identifying similarities and dissimilarities among the high-dimensional HCS readouts. We have to keep in mind that the results in our study might depend on the HCS data set. However, we obtained similar trends of the similarity measures’ abilities to differentiate between multiple phenotypes with another HCS data set, which is not part of this publication. Our studies allow the identification of suitable ways of comparing HCS fingerprints so that we are now able to apply this methodology for MoA elucidation, target hypothesis generation, and compound set enrichment in lead discovery.
Footnotes
Acknowledgements
We thank the Education Office of the Novartis Institutes for Biomedical Research for granting the postdoctoral fellowship of Felix Reisen. We thank Christian Parker for fruitful discussion and Ghislain Bonamy for sharing the image analysis script.
Declaration of Conflicting Interests
The authors declared no potential conflicts of interest with respect to the research, authorship, and/or publication of this article.
Funding
The authors received no financial support for the research, authorship, and/or publication of this article.
References
Supplementary Material
Please find the following supplemental material available below.
For Open Access articles published under a Creative Commons License, all supplemental material carries the same license as the article it is associated with.
For non-Open Access articles published, all supplemental material carries a non-exclusive license, and permission requests for re-use of supplemental material or any part of supplemental material shall be sent directly to the copyright owner as specified in the copyright notice associated with the article.