
Abstract
Compound optical interference remains an inherent problem in chemical screening and has been well documented for biochemical assays and less so for automated microscopy-based assays. It has also been the assumption that the latter should not suffer from such interference because of the washing steps involved in the process, thus eliminating the residual nonspecific compound effects. Instead, these compounds may have no relevance to the actual target, and as such, compound optical interference contributes to a number of false-positives, resulting in a high attrition rate during subsequent follow-up studies. In this report, we analyze the outcome of a high-content screen using enhanced green fluorescent protein as a reporter in a gain-of-function cell-based assay in search of modulators of the micro RNA (miRNA) biogenesis pathway. Using a previously validated image-based biosensor, we screened a diverse library collection of ~315,000 compounds covering natural and synthetic derivatives in which 1130 positives were identified to enhance green fluorescence expression. Lateral confirmation and dose-response studies revealed that all of these compounds were the result of optical interference and not specific inhibition of miRNA biogenesis. Here, we highlight the chemical classes that are susceptible to compound optical interference and discuss their implications in automated microscopy-based assays.
Introduction
Library collections used in chemical screening consist of compounds that are typically uncharacterized and of unknown biological activity. This is particularly challenging in the screening environment, because considerable effort is needed to identify whether the compounds affect the actual target or rather are the result of compound interference in the assay detection system. Compound interference can lead to false-positives during the hit selection process and generally arise from one of three major categories: aggregation, optical interference, and compound reactivity. 1 In particular, compound optical interference is frequent in assays that use detection formats with direct fluorescence intensity or fluorescence polarization. Depending on the structure, compounds can fluoresce upon excitation and emit at specific wavelengths that coincide with the assay, resulting in apparent activity. This may act as a signal quencher in certain readouts where the compounds absorb the emission wavelength of the reporter. In other cases, the excitation of the compounds is at the same wavelength of the reporter, leading to a gain in emission or autofluorescence. In certain assays, up to 50% of hits are false-positives, leading to an erroneous number of compounds in follow-up studies. 2
Several groups have illustrated these effects in high-throughput screening (HTS) campaigns with fluorescence-based assays during follow-up and hit assessment. Turek-Etienne and coworkers 3 identified seven compounds with fluorescent properties in the LOPAC library of pharmaceutical active compounds that affected the signal in fluorescence polarization (FP) assays. In the study, four FP assays in different enzymes showed that fluorescein-based probes were particularly susceptible to compound fluorescence and could be attenuated by using longer-wavelength dyes. Jadhav and coworkers 1 screened a library collection of almost 200,000 diverse compounds using a fluorogenic assay against cruzain and identified approximately 1.75% of the hits detected as inhibitors for the cysteine protease as being autofluorescent. Large screening libraries often contain scaffolds that interfere with assay output, and extensive work was performed by Simeonov and coworkers 4 to profile the fluorescent properties of the National Institutes of Health Chemical Genomics Center compound collection. Similarly, the study concluded that a high percentage of the compounds that fluoresce are within the shorter excitation/emission wavelengths in comparison with those in the orange/red region. 4 All of these studies exemplify the need for follow-up to confirm results that use fluorescence-based readouts.
Automated microscopy-based assays have become an integral part of the drug discovery process because of this technology’s ability to assess activity on a cellular level. 5 Automated microscopy technology in conjunction with sophisticated analysis algorithms makes it possible to visualize and extract numerous features that evaluate cellular behavior and phenotypic responses in the context of their environment. In particular, this combination in a high-throughput setting allows for rapid and systematic characterization of compounds that is not feasible with biochemical or simple mix-read type assays. In addition, automated microscopy-based assays should not be prone to optical interference as compounds are evaluated for their effect on biological processes after the washing and fixation process, thereby removing all chemical traces prior to fluorescence readout. For these assays, a multitude of fluorescent stains and reporter genes are used to monitor biological activities such as expression of proteins, trafficking, and regulatory events. Commonly used fluorescent stains include bisbenzimide or Hoechst, a semipermeable dye that binds to A-T rich regions in DNA that allows for visualization of the nuclear region in cells. 6 Alternatively, reporter genes such as enhanced green fluorescent protein (EGFP) are cloned into the sequence of a gene to observe cellular activities of proteins over periods of time. 7
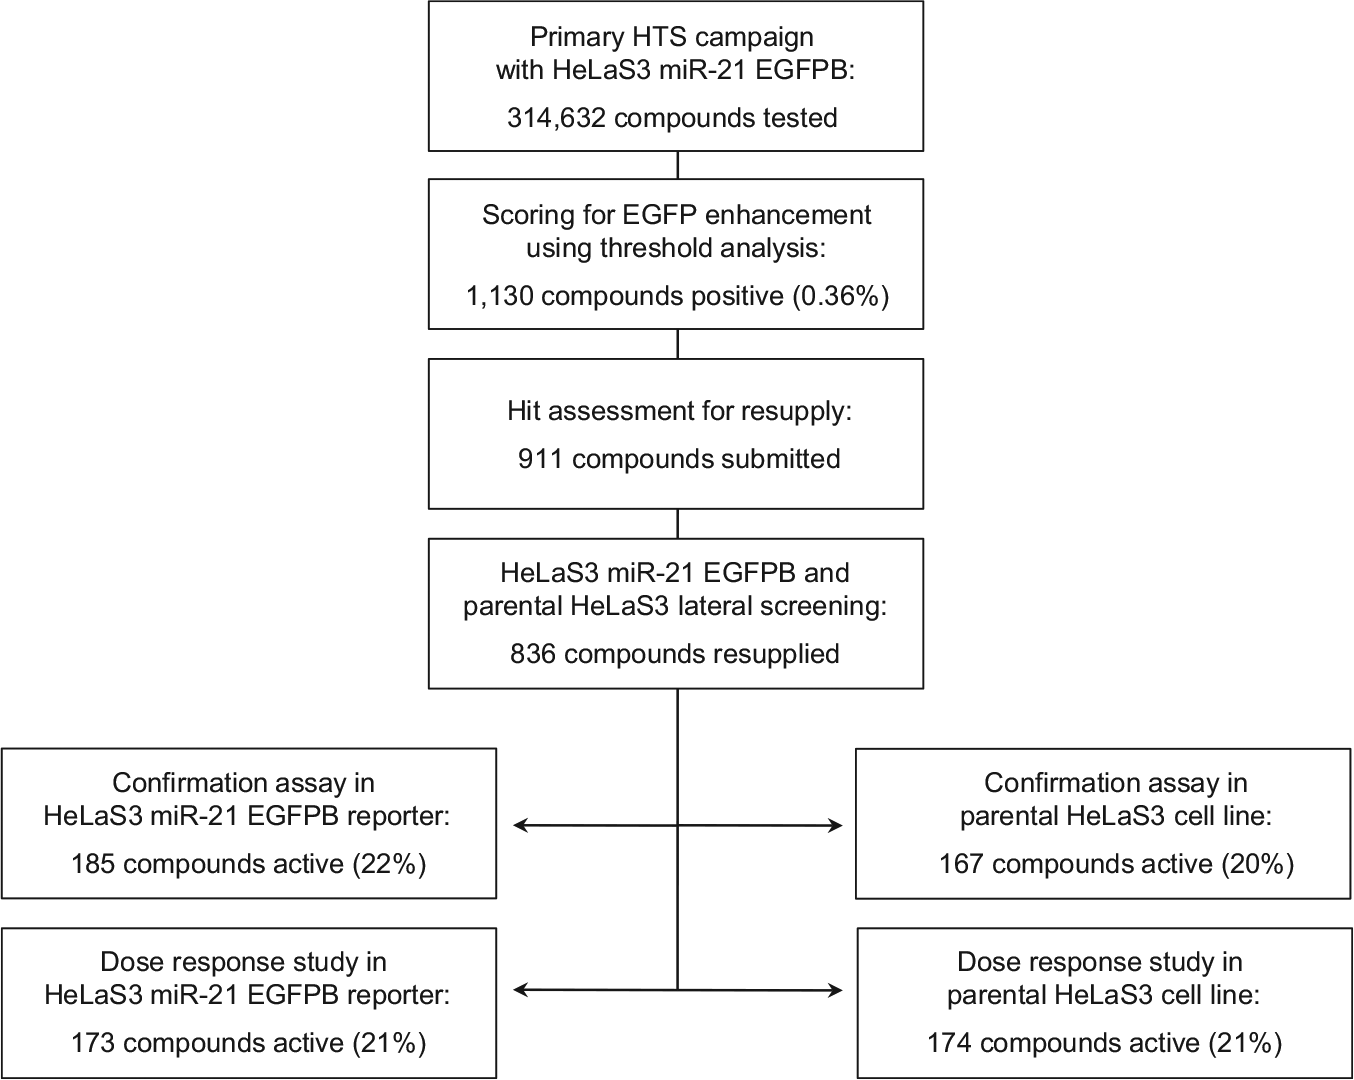
As an example, we previously developed an image-based biosensor to monitor microRNA (miRNA) activity in which chemical modulators alter EGFP expression that can be detected in the green fluorescent channel. 8 Recent trends have indicated that miRNAs play a critical role in many biological processes such as cell growth, proliferation, embryonic development, tissue differentiation, and apoptosis.9–11 Divergent patterns have been observed in cancer and neurodegenerative, heart, and immune-related diseases and have driven considerable efforts to discover novel therapeutic agents that regulate their expression.12–14 Following this effort, we rationalized that an automated microscopy-based approach would enable the rapid identification of miRNA pathway modulators and validated the HeLaS3 miR-21 EGFPB reporter in a screen of 6192 compounds. 8 Using a gain-of-function readout, we proceeded to screen a diverse library collection covering 314,632 compounds and monitored green fluorescence expression as an indicator of miRNA activity in this wash and fix assay. From the screen, we obtained 1130 positives and performed follow-up studies on 836 resupplies using the HeLaS3 miR-21 EGFPB reporter and parental HeLaS3 cell line to eliminate compound interference. Here, we report the complete findings of the compounds identified as positive and discuss their implications in the context of automated microscopy-based assays.
Materials and Methods
Cell Culture and Materials
The image-based biosensor HeLaS3 miR-21 EGFP (HeLaS3 miR-21 EGFPB) harboring EGFP under miRNA regulation was generated as previously reported. 8 These cells were cultured in complete growth media containing DMEM, high glucose with L-glutamine, D-glucose and sodium pyruvate supplemented with 10% heat-inactivated fetal bovine serum (FBS), and 200 µg/mL of Zeocin. Parental HeLaS3 cells were cultured in complete growth media containing DMEM, high glucose with L-glutamine, and D-glucose and sodium pyruvate supplemented with 10% heat-inactivated FBS. All cells were grown under a humidified atmosphere of 5% CO2 at 37 °C, and cell culture supplies were from Life Technologies (Carlsbad, CA) and Sigma-Aldrich (St. Louis, MO).
Liquid Dispensing and Automation System
Several liquid-dispensing devices were used throughout this study. Compounds were plated and transferred using a 384 stainless steel head with disposable low-volume polypropylene tips on a PP-384-M Personal Pipettor (Apricot Designs, Monrovia, CA). The addition of cell suspensions and growth media was performed using the Multidrop 384 (Thermo Fisher Scientific, Waltham, MA). Cell fixation and staining were performed using the ELx405 automated washer (Biotek, Winooski, VT). Assay plates were incubated in the Cytomat automated incubator (Thermo Fisher Scientific) under controlled humidity at 37 °C and 5% CO2.
Chemical Screen for Modulators of miRNA Biogenesis
To start the assay, HeLaS3-miR-21 EGFPB cell suspensions were dispensed at 1500 cells per well in 40 µL of complete growth media and incubated for 1 d at 37 °C. For the chemical screen, compounds were preplated in an intermediate 384-well polypropylene plate (Thermo Fisher Scientific) at 100 µM in 10% DMSO (v/v) then diluted in complete growth media; 10 µL was transferred into the assay plates at a final concentration of 10 µM in 1% DMSO (v/v). As an internal reference, each assay plate contained 1% DMSO (v/v) as a negative control in column 13 and an antagomir for miR-21 as positive control in column 14. 8 After 3 d of compound treatment, cells were washed with phosphate-buffered saline (PBS) and then fixed in 4% paraformaldehyde (w/v) for 20 min followed by nuclei staining in a solution containing 1 µM of Hoechst and 0.05% Triton X-100 (v/v) for 1 h. Cells were washed with PBS, and assay plates were stored at 4 °C until imaging. Images of cells in assay plates were acquired on the IN Cell Analyzer 3000 (INCA3000, GE Healthcare) for EGFP fluorescence intensity and Hoechst-stained nuclei.
Chemical Libraries
The library used for the screen is a collection of 314,632 chemicals obtained from several sources including AnalytiCon (Potsdam, Germany), ChemBridge (San Diego, CA), ChemDiv (San Diego, CA), Specs (the Netherlands), and the National Cancer Institute (NCI; Bethesda, MD). Briefly, the AnalytiCon Library contains 18,304 compounds derived from natural products. The ChemBridge Library contains 120,000 compounds composed of molecules representing a diverse chemical space as well as G-protein–coupled receptor (GPCR) and kinase targeting. The ChemDiv Library contains 44,000 compounds and Specs contains 81,385 compounds, both representing a diverse class of molecules. The NCI collection of 50,943 compounds represents structurally diverse synthetics and natural products.
Lateral Confirmation and Dose-Response Studies
Compounds identified from the screen were resupplied from the vendors to ensure identity and dissolved in 100% DMSO to 10 mM concentration for preparation of stock solutions. For confirmation, the 836 resupplied compounds were tested in duplicate with the assay described above at a final concentration of 10 µM in 1% DMSO (v/v). For dose response, the 836 resupplied compounds were tested in duplicate with a 12-point doubling dilution series starting from 100 µM to 50 nM in 1% DMSO (v/v). The resulting data were fitted using a four-parameter logistic nonlinear regression model, and IC50 values were reported where fit was obtained. Confirmation and dose-response studies were performed in both the HeLaS3 miR-21 EGFPB and parental HeLaS3 cells.
Image Acquisition, Analysis, and Screening Data Management
Images were acquired on the automated laser confocal INCA3000 microscope at the following wavelengths: 364 nm excitation/450 nm emission in the blue channel for Hoechst-stained nuclei and 488 nm excitation/535 nm emission in the green channel for EGFP with an exposure time of 1.5 ms. For screening and confirmation, four images per well were collected using a 40× magnifying objective covering 40% of the well and required 10 s per well with a total acquisition time of 1 h for a complete assay plate. Images were analyzed using the Raven 1.0 software’s built-in object intensity analysis module to assess green signal intensity per well and count number of Hoechst-stained nuclei. The data files were loaded into the Oncology Research Informatics System, a custom-built suite of modules for compound registration, plating, and data management powered by ChemAxon cheminformatic tools (ChemAxon, Cambridge, MA).
Results
High-Content Screen for Small-Molecule Modulators of miRNA Biogenesis
Automated microscopy-based assays and image analysis are mainstream tools allowing for the systematic and rapid characterization of compound activity. For the purpose of identifying chemical modulators of miRNA biogenesis and expression, we have previously developed and validated an image-based biosensor for use in high-content screening. 8 Briefly, the reporter cell line expresses an EGFP-fused plasmid with complete complementarity to miR-21 whereby endogenous expression results in destabilization of the EGFP mRNA, leading to low-level green fluorescence expression. In contrast, modulators that affect miRNA biogenesis result in a decrease in endogenous miR-21 and hence stabilization of the EGFP mRNA for high-level green fluorescence expression—as a result, a surrogate for miRNA biogenesis activity. In this study, we expand from our previous screening work of 6912 chemicals comprising Food and Drug Administration (FDA)–approved drugs and known bioactives to a library collection of 314,632 compounds representing a diverse chemical space.
Following our established workflow, the image-based biosensor was screened against 314,632 compounds composed of natural products, GPCR and kinase inhibitors, and synthetics at a concentration of 10 µM in 1% DMSO (v/v). The library was plated across nearly one thousand 384-well microtiter plates, with columns 13 and 14 empty for negative and positive controls to assess the assay’s performance throughout the screen (
Fig. 1A
,
B
). To identify modulators of miRNA biogenesis, we selected a threshold based on three standard deviations (3σ) from the mean of the negative control, translating to an EGFP signal gain of 20%. We obtained 1130 positive compounds out of the 314,632 compounds screened and with an initial positive rate of 0.36% (
Fig. 2
;
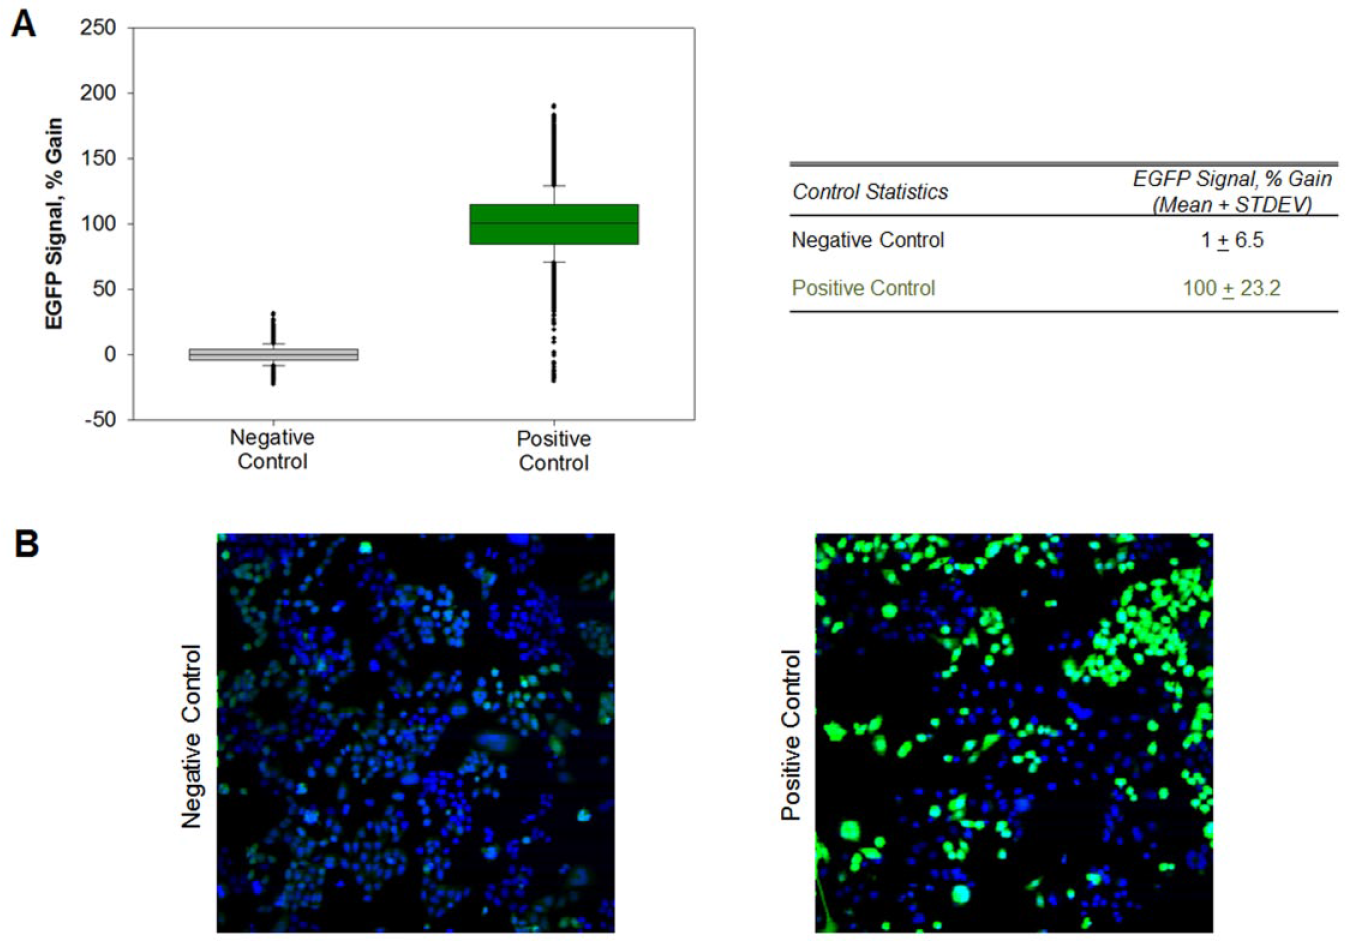
Performance of control wells in an image-based biosensor assay during screening. HeLaS3 miR-21 EGFPB reporter was treated with negative and positive controls followed by incubation for 3 d. (
Summary screening performance of the 314,632 compounds.
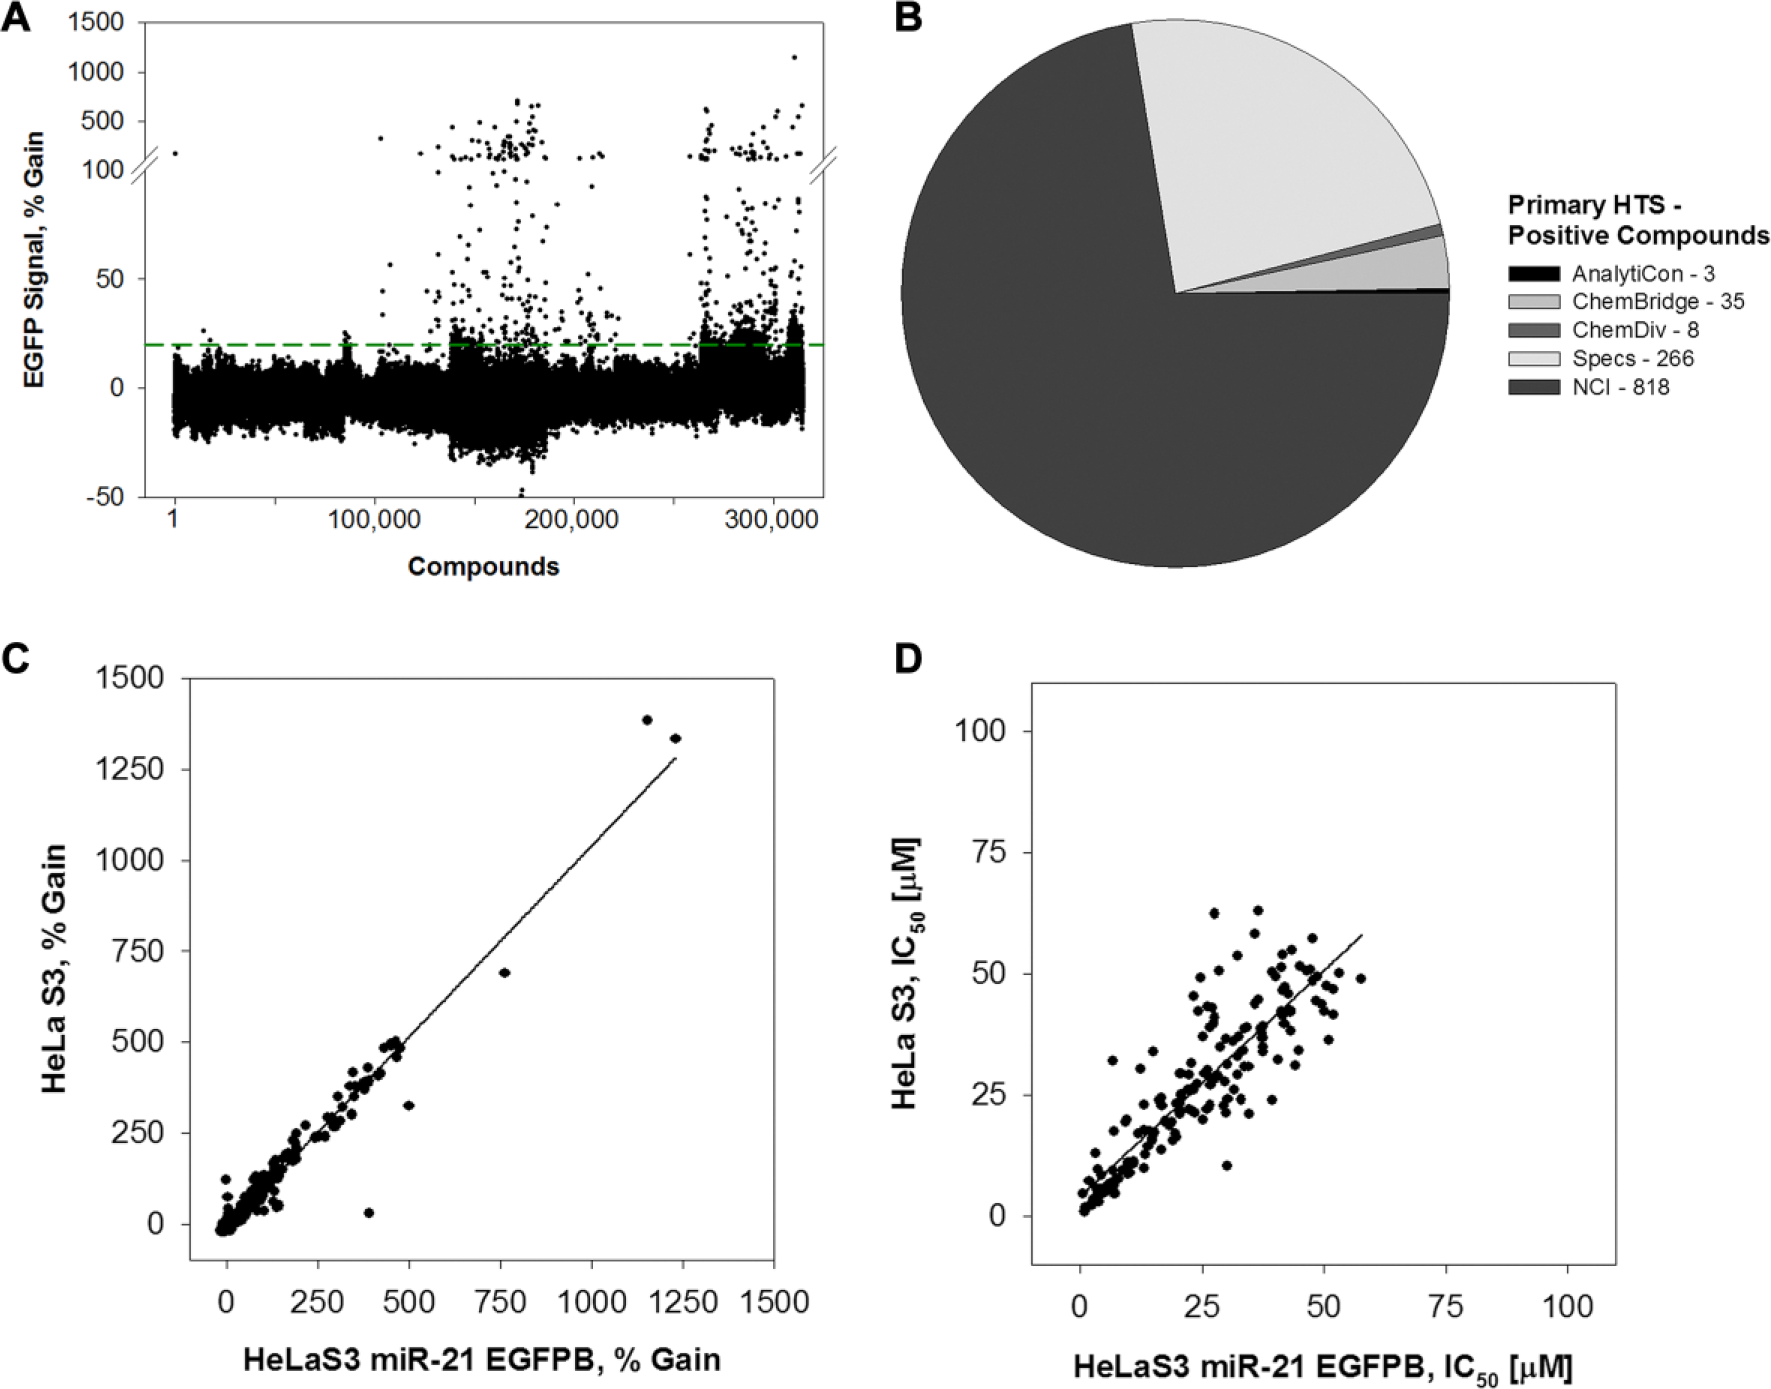
Assessment of compound performance during screening. HeLaS3 miR-21 EGFPB reporter was treated with 10 µM of compounds in 1% DMSO (v/v) for 3 d. (
Lateral Screening and Dose-Response Follow-Up Studies
To confirm the activity of the compounds, we performed follow-up studies in both the HeLaS3 miR-21 EGFPB reporter and parental HeLaS3 cell line to assess whether the enhancement of EGFP signal intensity is due to the modulation of miRNA processing. The parental HeLaS3 cell line does not contain the reporter for miRNA activity, and compounds that score in the green fluorescent channel are optically interfering and not assay specific. In the lateral confirmation studies, the 836 resupply compounds were retested at a concentration of 10 µM in 1% DMSO (v/v) following the established workflow, and 185 showed an increase in green fluorescence intensity at a threshold of 20% for the HeLaS3 miR-21 EGFPB reporter. The percentage gain of compounds ranged from −17% to 1231%. In the HeLaS3 cell line, 167 of 836 resupply compounds showed an increase in green fluorescence intensity at a threshold of 20%, with overall values ranging from −24% to 1383%. A total of 191 compounds between the cell lines scored above the threshold, and correlation analysis using linear regression showed that an R2 value of 0.99 indicates that a majority of compounds resulted in similar green fluorescence intensity at the tested single concentration (
Fig. 3C
;
Next, we performed dose-response studies in both the HeLaS3 miR-21 EGFPB reporter and HeLaS3 cell line to assess the compounds’ potency over a doubling dilution concentration series starting from 100 µM. In the reporter cell line, 173 of 836 compounds gave IC50 determinations, with the lowest at 600 nM. In the parental cell line, 174 of 836 compounds gave IC50 determinations, with the lowest at 900 nM. Similar to the confirmation studies, a correlation analysis using a linear regression model showed an R2 value of 0.96, indicating that a majority of compounds resulted in comparable green fluorescence intensity in both cell lines (
Fig. 3D
;
To evaluate the compounds for miRNA activity, we performed a heat map analysis and used a ratiometric readout to compare the resulting green fluorescence intensity of HeLaS3 miR-21 EGFPB reporter to the parental HeLaS3 cell line (
Fig. 4
). In the confirmation studies performed at a screening concentration of 10 µM, the compounds were scored and those with less than twofold change indicated a similar green intensity in both cell lines, indicating optical interference arising from autofluorescence. Of the 191 compounds scoring above the activity threshold, only 25 showed a ratiometric fold change from 2 to 22, and the remaining 166 were deemed as promiscuous (
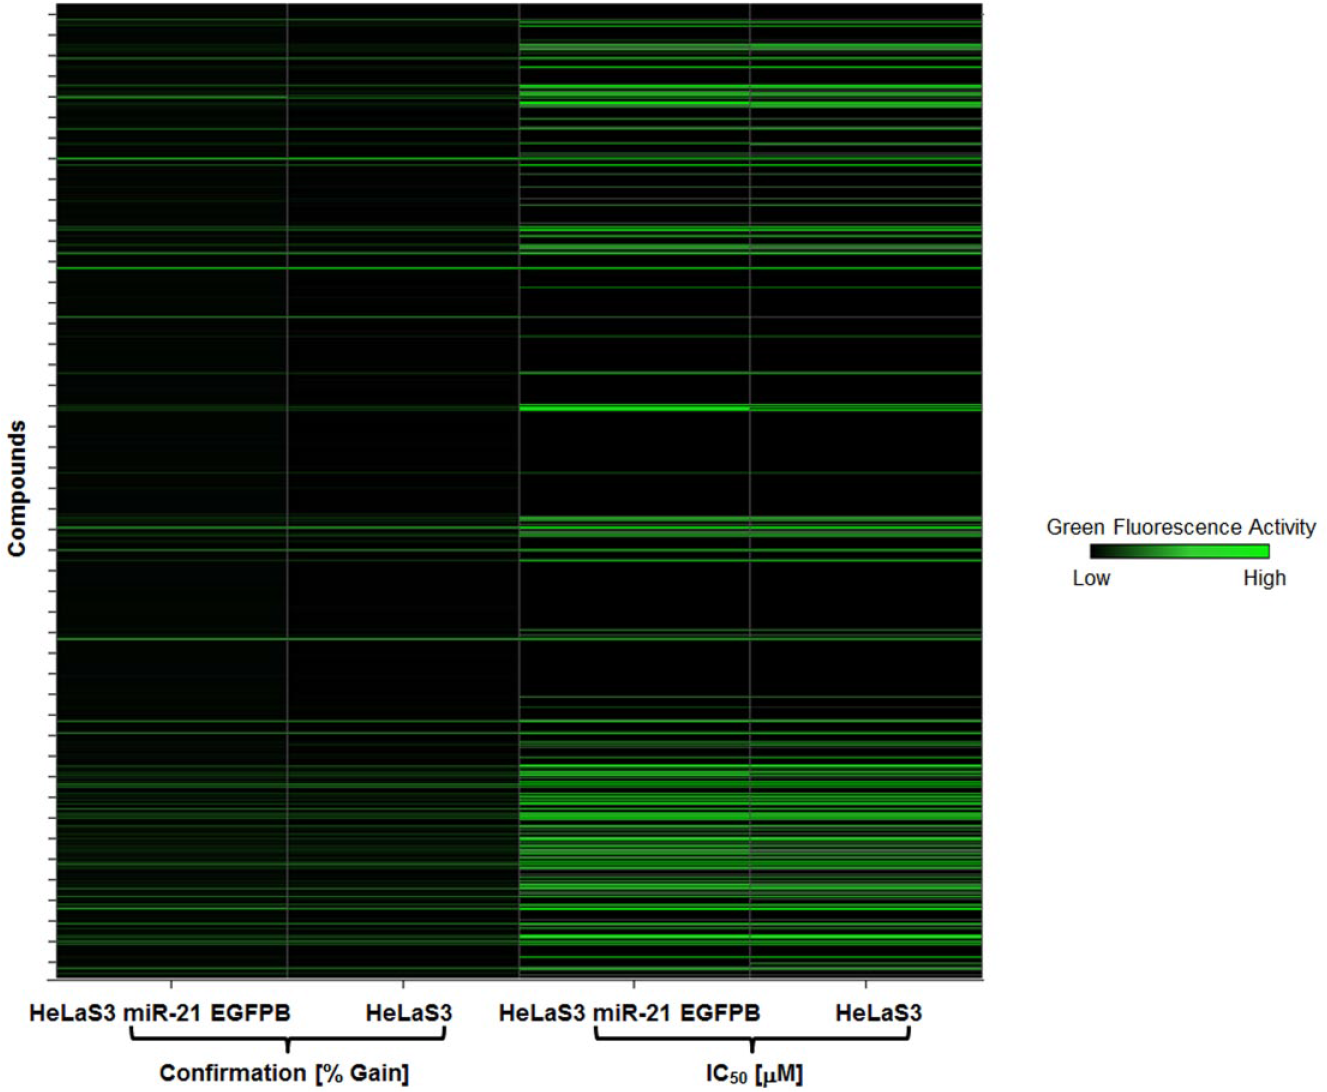
Heat map analysis of follow-up confirmatory studies in HeLaS3 miR-21 EGFP reporter and its parental HeLaS3 cell lines.
Identification of Scaffolds in Optical Interference
Our data indicate that the compounds identified from the follow-up studies between the HeLaS3 miR-21 EGFPB and parental HeLaS3 cell line are optically interfering in the green fluorescence emission channel. We performed an analysis of the 191 compounds to assess the structure activity relationship on fluorescence properties and revealed 68 compounds belong to four major scaffolds. The most frequent scaffold, scaffold A, identified contained a 6-amino-terahydroisoquinoline-5,7,7-tricarbonitrile core structure with group substitutions at three different positions (
Fig. 5A
). In total, 26 compounds are composed of this core structure and all belonging to the Specs library with a high green fluorescence intensity ranging from 23% to 153% in both cell lines. The second most common scaffold, scaffold B, identified was nafthacenedione or anthroquinone core with group substitutions at two positions (
Fig. 5B
). These 18 compounds are from the NCI library. The next scaffold, scaffold C, identified is the benzothiazole core with substitutions in a single position (
Fig. 5C
). The 13 compounds are from the NCI library and have been used in fluorogenic dyes. In the last scaffold, scaffold D, the thiazolopyrimidine core was identified from the Specs library, with a total of 11 compounds (
Fig. 5D
). Obtained images are summarized in
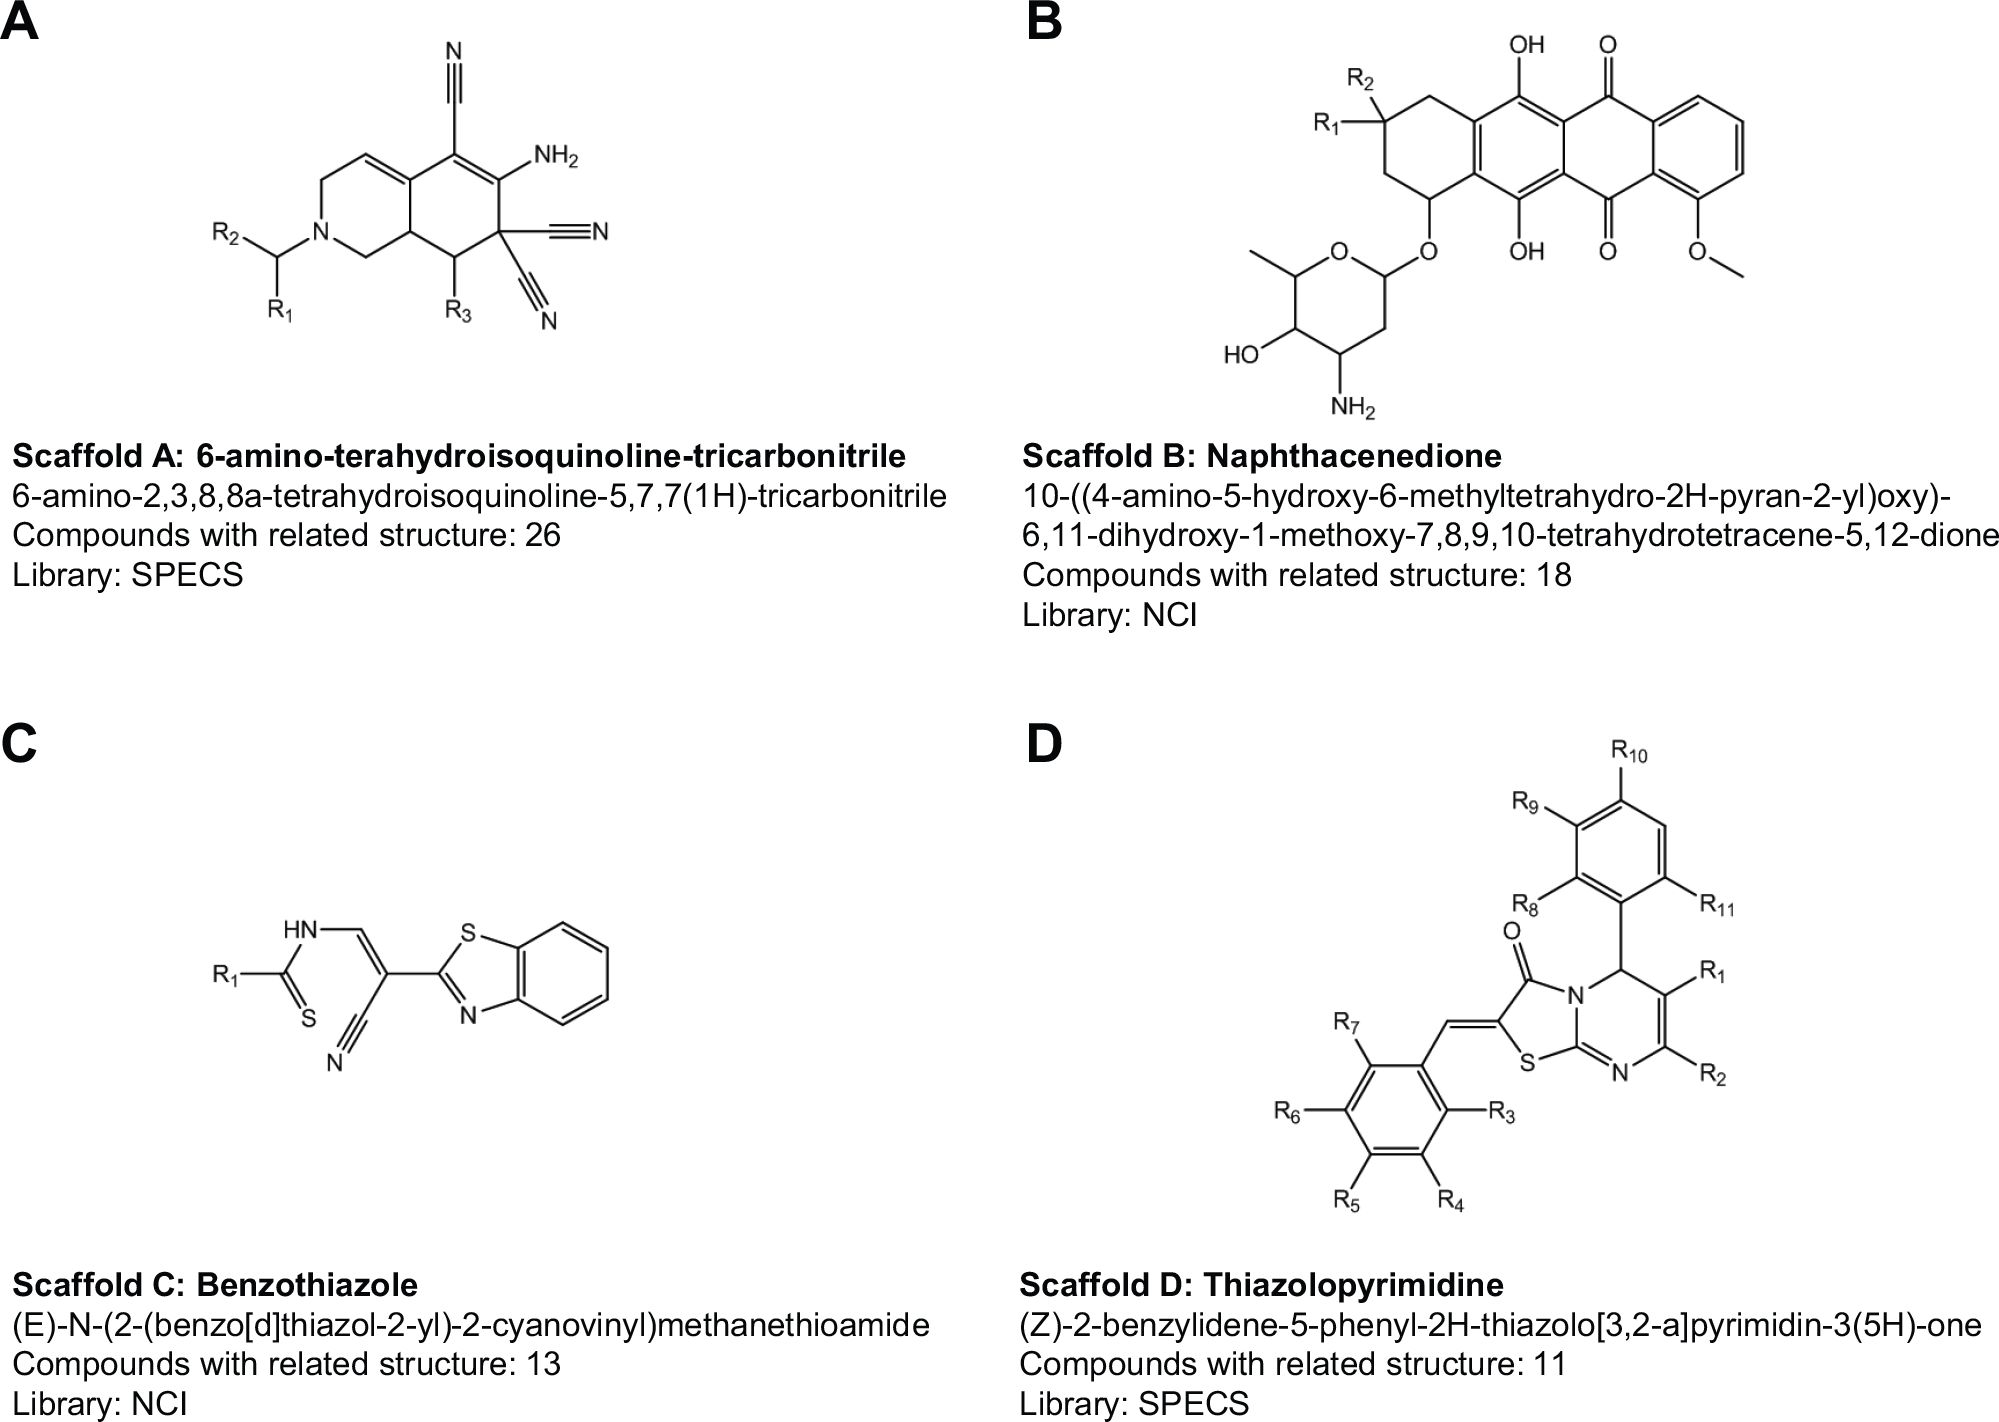
Compound scaffolds identified to interfere with green fluorescence channel. (
Discussion
Chemical screening to identify compounds that are specific against a biological target or pathway is a laborious process. Compound interference can often mask legitimate candidates for targeted activity or inconsequentially lead to the pursuit of false-positives. It has been assumed that automated microscopy-based assays are immune to interference as cells undergo several wash cycles to eliminate residual compounds before the imaging process. Compound optical interference, as well as biochemical assays, poses an equally challenging problem in this, because autofluorescence may coincide with excitation and emission detection. As such, profiling studies of library collections used in chemical screening are urgently needed to identify characteristics that overlap with fluorescence readouts in imaging. We have successfully screened a diverse library collection of ~315,000 compounds from AnalytiCon, Chembridge, ChemDiv, Specs, and NCI using our image-based biosensor for miRNA activity, and surprisingly, an overwhelming majority of positives were found to modulate green fluorescence expression in the EGFP channel (
Our study led to the identification of a compound series that optically interferes in the green fluorescence channel, and structural analysis revealed four major scaffolds. The predominant scaffold A contains 26 compounds with broad activity affecting green fluorescence emission depending on the substituent group. Among this scaffold, compound ID 194712 or 6-amino-2-ethyl-8-phenethyl-2,3,8,8a-tetrahydroisoquinoline-5,7,7(1H)-tricarbonitrile was previously reported as a novel fluorophore through the fluorescence spectroscopic profiling of various libraries. 4 This compound resulted in a 124% gain in HeLaS3 miR-21 EGFPB reporter and 134% gain in parental HeLaS3 cell line for green fluorescence expression ( Fig. 6A ). Compounds belonging to scaffold A showed green fluorescence enhancements that were primarily localized to the cytoplasm.
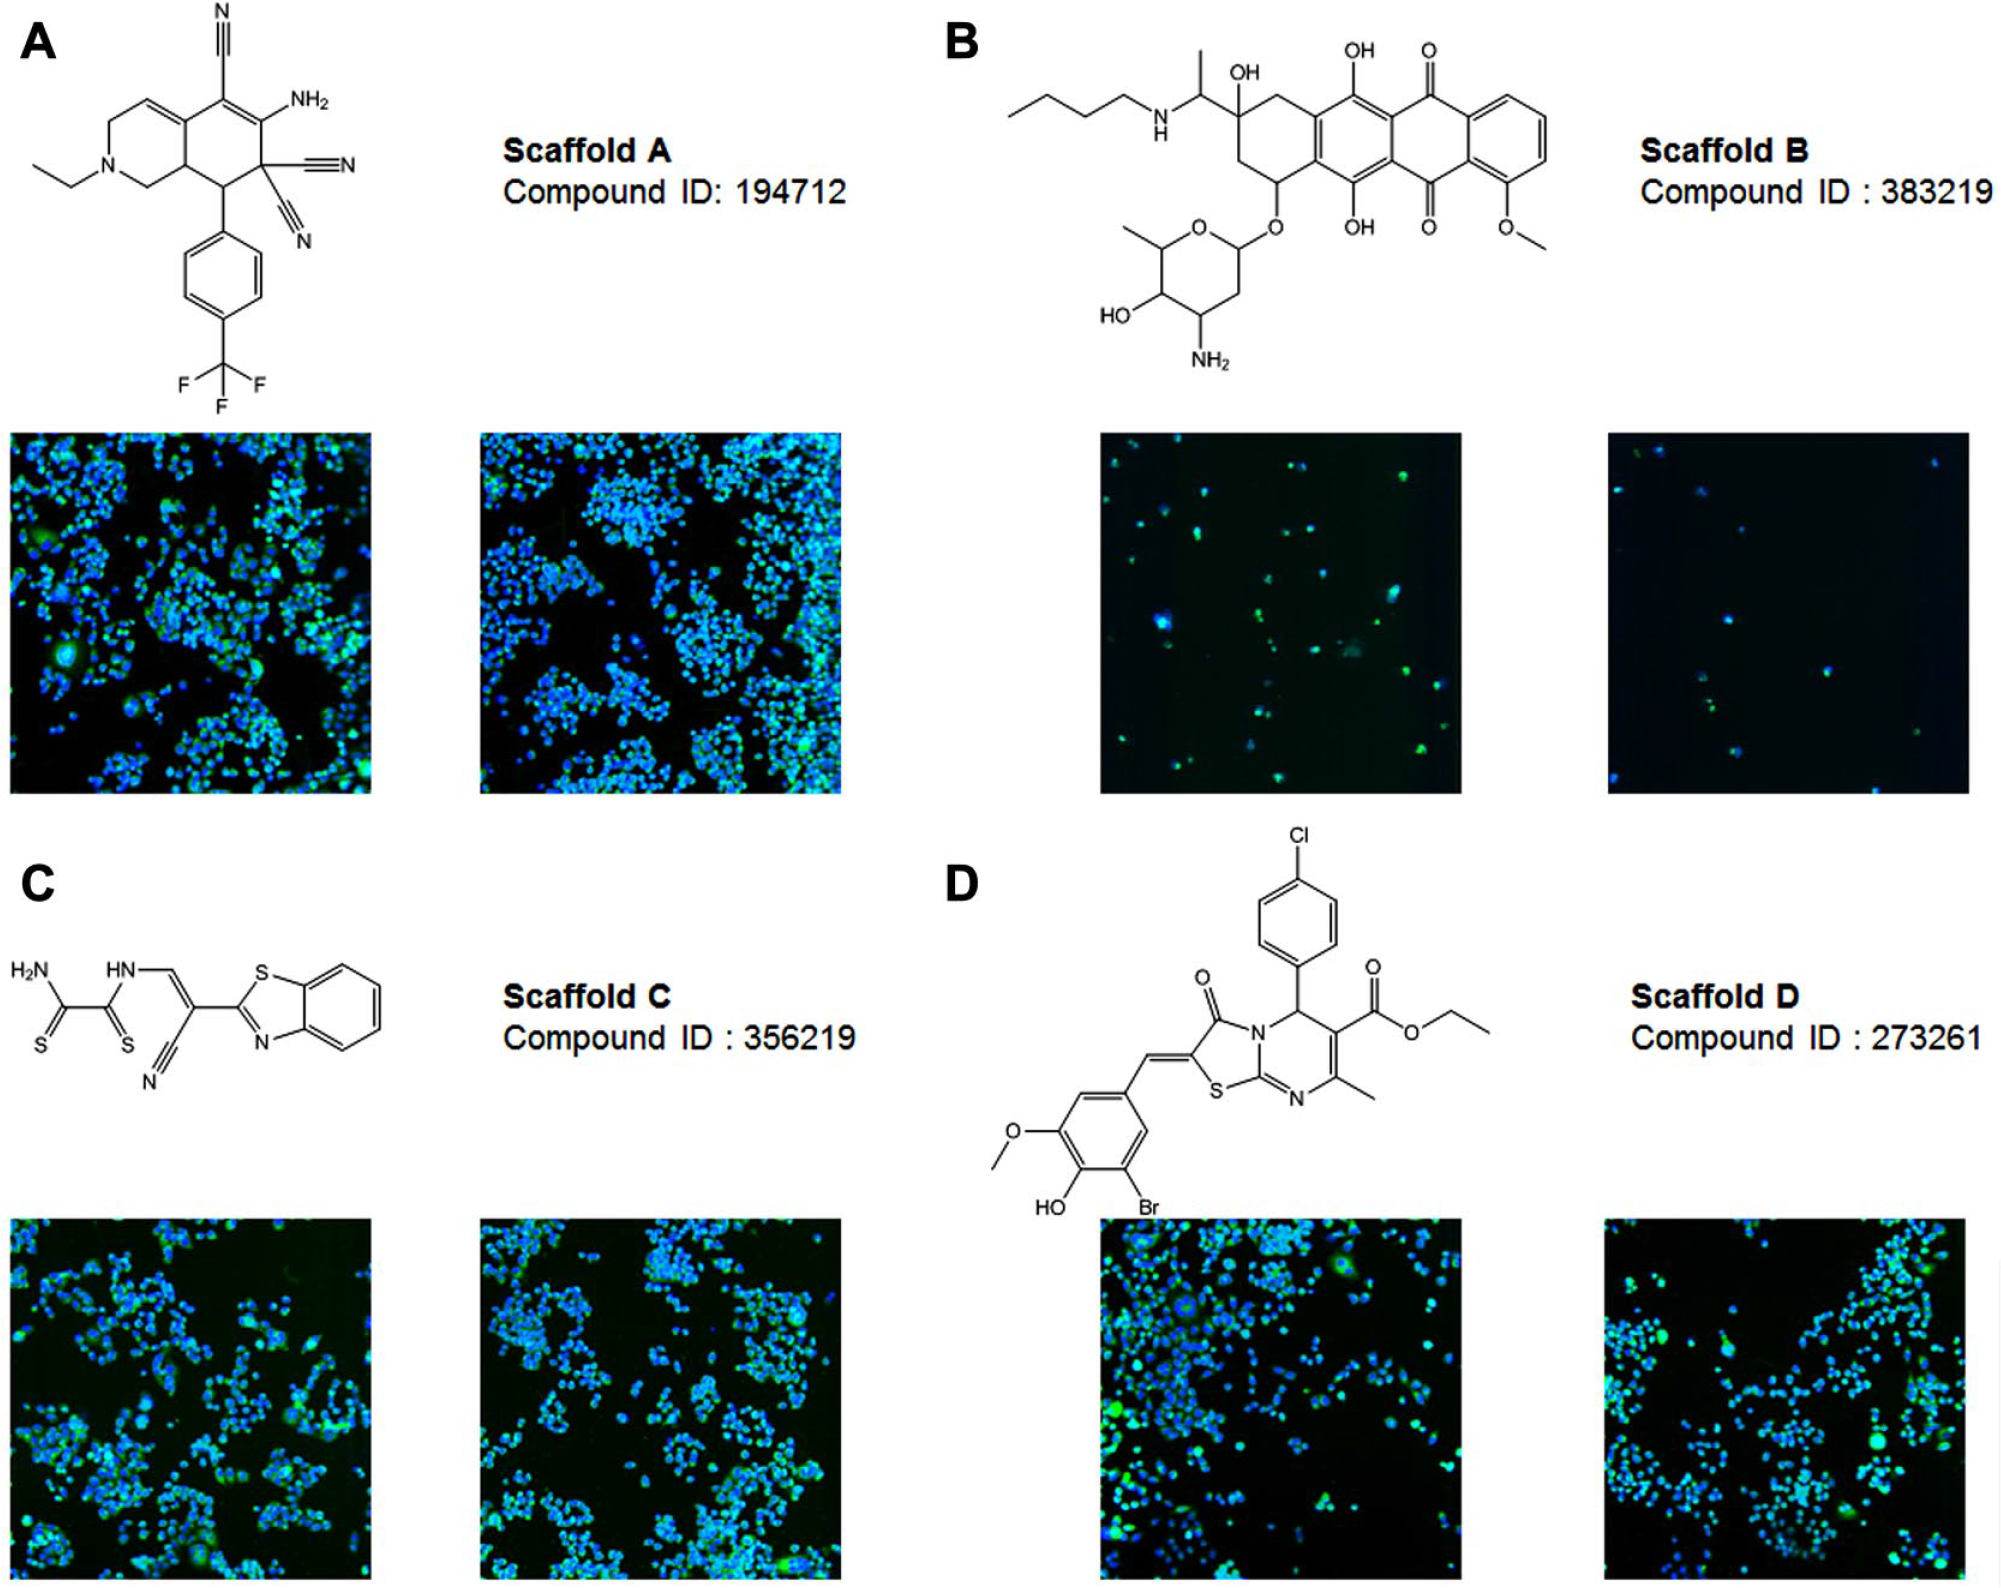
Representative compound with optical interference from each scaffold. (
For scaffold B, we identified 18 compounds containing napthacenedione with green fluorescence emission ranging from 28% to 111% gain. Within this scaffold, we find the known anthraquinone core, which is known DNA intercalators and staining dyes. Derivatives include chemotherapeutic drugs daunorubicin and doxorubicin, which are orange-red in color and bind to DNA by intercalation.15,16 We previously identified these two compounds as well as epirubicin and idarubicin as autofluorescent in our previous screen of FDA-approved drugs. 8 In this screen, compound ID 383219 in scaffold B was found to autofluoresce in the green emission channel and predominantly showed nuclear localization with modest cytotoxicity ( Fig. 6B ). CyTRAK Orange and DRAQ5 also contain the anthraquinone core and commonly used reagents for staining of the nucleus in live or permeabilized and fixed cells. 17 These two reagents are red and far-red fluorescent stains. As illustrated, different substitutions in the anthraquinone core will confer distinctive emission properties in the blue, green, red, and far-red spectrum that have been exploited as biological tools. 18
Scaffold C contains benzothiazole, which has 13 compounds with ranges of 25% to 429% gain in green fluorescence emission, and among them were five duplicates, illustrating the reproducibility of our assay. Benzothiazoles are commonly used as dyes, which include the cyanine dye SYBR green. SYBR green is a nucleic acid stain for quantification of double-stranded DNA products in applications such as quantitative reverse transcription PCR. Thioflavin is used for histology staining and to study protein aggregation. In addition, other DNA-binding dyes include BOBO-1, BOBO-3, POPO-1, POPO-3, TOTO1, and YOYO-3, with a variety of excitation/emission wavelengths depending on substituent group.19,20 Compound ID 356219 and other benzothiazoles in our screen displayed predominant green fluorescence enhancement in the nucleus as well as cytoplasm ( Fig. 6C ).
Last, for scaffold D, 11 compounds identified contained a thiazolopyrimidine core structure. Compounds in this scaffold showed high intensity, with ranges from 20% to 483% gain in green fluorescence enhancement; however, uses for this thiazolopyrimidine have not been described. Compound ID 273261 showed green fluorescent enhancements that were primary localized to the cytoplasm ( Fig. 6D ). Aside from the scaffolds identified, two compounds containing the acridine core exhibited the highest intensity, with more than 1000% gain in green fluorescent enhancements. These compounds were previously identified in our FDA-approved drug screen and used as tools for cell cycle studies as well as lysosomal dyes.8,21,22
We have uncovered that automated microscopy-based assays are prone to optical interference that arises from compounds similar to biochemical methods using fluorescence-based readouts. Large libraries used in HTS include many compounds of unknown properties that could interfere with the assay readout in different manners. Optical interfering compounds may be included during hit selection as compounds autofluoresce with the same excitation and emission wavelength as the reporter. Studies have indicated that a higher percentage of the compounds autofluoresce within the blue and green region, and this might be particularly true for EGFP reporter–based systems as excitation is in the shorter wavelengths.
In our study, all the positives identified from the chemical screen were autofluorescent, with four major scaffolds among them. The correlation between optical interference and chemical structure was not possible to illustrate, and the report here should enable quick assessment of compound activity for green fluorescence emission assays. In conclusion, automated microscopy-based assays are not immune to compound optical interference, and follow-up studies are necessary to assess the biological relevance of the compounds in the screening system.
Footnotes
Acknowledgements
The authors wish to thank members of the High Throughput Screening Core Facility for their help during the course of this study.
Supplementary material is available online with this article.
Declaration of Conflicting Interests
The authors declared no potential conflicts of interest with respect to the research, authorship, and/or publication of this article.
Funding
The authors disclosed receipt of the following financial support for the research, authorship, and/or publication of this article: The HTS Core Facility is partially supported by Mr. William H. Goodwin and Mrs. Alice Goodwin and the Commonwealth Foundation for Cancer Research, the Experimental Therapeutics Center of MSKCC, the William Randolph Hearst Fund in Experimental Therapeutics, the Lillian S Wells Foundation, and by an National Institutes of Health/National Cancer Institute Cancer Center Support grant 5 P30 CA008748-44.
References
Supplementary Material
Please find the following supplemental material available below.
For Open Access articles published under a Creative Commons License, all supplemental material carries the same license as the article it is associated with.
For non-Open Access articles published, all supplemental material carries a non-exclusive license, and permission requests for re-use of supplemental material or any part of supplemental material shall be sent directly to the copyright owner as specified in the copyright notice associated with the article.