
Abstract
Microsomal prostaglandin E synthase-1 (mPGES-1) represents an attractive target for the treatment of rheumatoid arthritis and pain, being upregulated in response to inflammatory stimuli. Biochemical assays for prostaglandin E synthase activity are complicated by the instability of the substrate (PGH2) and the challenge of detection of the product (PGE2). A coupled fluorescent assay is described for mPGES-1where PGH2 is generated in situ using the action of cyclooxygenase 2 (Cox-2) on arachidonic acid. PGE2 is detected by coupling through 15-prostaglandin dehydrogenase (15-PGDH) and diaphorase. The overall coupled reaction was miniaturized to 1536-well plates and validated for high-throughput screening. For compound progression, a novel high-throughput mass spectrometry assay was developed using the RapidFire platform. The assay employs the same in situ substrate generation step as the fluorescent assay, after which both PGE2 and a reduced form of the unreacted substrate were detected by mass spectrometry. Pharmacology and assay quality were comparable between both assays, but the mass spectrometry assay was shown to be less susceptible to interference and false positives. Exploiting the throughput of the fluorescent assay and the label-free, direct detection of the RapidFire has proved to be a powerful lead discovery strategy for this challenging target.
Introduction
Prostaglandin E2 (PGE2) is an arachidonic acid derivative that elicits a number of biological responses associated with both normal physiology and certain pathological states, including pain, inflammation, fever, and tumorigenesis. 1 Prostaglandins are generated by the action of terminal synthases on prostaglandin H2 (PGH2), which is formed by the action of cyclooxygenase enzymes on arachidonic acid. Three enzyme activities have been described that catalyze the conversion of PGH2 to PGE2. 2 The best characterized of these is the glutathione-dependent microsomal PGE synthase-1 (mPGES-1). 3 The expression of mPGES-1 is upregulated by various inflammatory stimuli, and its activity is coupled to the inducible cyclooxygenase Cox-2.4,5 Existing therapies that lower the levels of induced PGE2 by Cox-2 inhibition suffer from cardiovascular side effects believed to result from general disruption of prostanoid levels, and thus selective targeting of induced PGE2 by mPGES-1 inhibition is an attractive alternative therapeutic strategy for indications of pain and inflammation. 1
Activity assays for prostaglandin synthases are complicated by the intrinsic chemical instability of PGH2. The strained cyclic endoperoxide ring of PGH2 can spontaneously decompose to yield predominantly PGE2 with a half-time of approximately 10 min at neutral pH and 20 °C.
6
To achieve a measurable rate of catalyzed PGE2 formation above this nonenzymatic background, an activity assay for mPGES-1 is necessarily of short duration. Other assay challenges include the handling or generation of PGH2 and the detection of PGE2. Both these issues have been addressed by the elegant work of Percival,
7
where PGH2 was generated by the action of Cox-2 on arachidonic acid, and PGE2 was detected in a continuous spectroscopic assay by coupling the oxidation of the 15-hydroxyl group to the reduction of NAD+ to NADH by the catabolic enzyme 15-prostaglandin dehydrogenase (15-PGDH). The assay described here is an extension of the work of Percival, to give a high-throughput screening (HTS)–compatible assay where all steps of the system are performed in the same well and the formation of NADH is further coupled to a visible wavelength fluorescent readout (
Although this fluorescent mPGES-1 assay was amenable to miniaturized HTS campaigns, it suffered from complications arising from the use of two enzyme-coupled detection steps, such as the requirement to deconvolute data, and a significant requirement for reagent generation. To yield an assay to support an ongoing hit to lead campaign, a nonfluorescent, label-free alternative was also desired. Mass spectrometry presents an attractive option for label-free screening of enzyme targets because it allows direct quantification of both substrate and product. 8 However, sample preparation for mass spectrometry is typically carried out by high-performance liquid chromatography (HPLC), which, despite the development of methods to increase speed, 9 is still limited to 1 to 4 min per sample, rendering it unsuitable for higher throughput compound profiling applications. The RapidFire high-throughput mass spectrometry (HTMS) system (Agilent Technologies, Wakefield, MA) addresses this issue by combining a rapid autosampler with a proprietary solid-phase extraction step to deliver purified analytes into an electrospray ionization (ESI) triple quadrupole (QqQ) mass spectrometer at a rate of one sample every 6 to 8 s, directly from a standard 96- or 384-well microtiter plate.10–13 An activity assay for mPGES-1 was therefore developed on the RapidFire system, using the same in situ PGH2 generation step as the fluorescent assay. Reactions were quenched by the addition of iron (II) chloride, which results in the rapid conversion of any remaining PGH2 substrate to the more stable product 12-L-hydroxy-5,8,10-heptadecatrienoic acid (12-HHT), 14 which can be analyzed by mass spectrometry along with the reaction product PGE2. The pharmacological response of this assay was found to correlate very well with the fluorescent assay, but the RapidFire format was more resistant to interference and did not suffer from the action of inhibitors on the coupling enzymes, rendering it more suitable for an extended hit to lead screening campaign.
Materials and Methods
Materials
All reagents were purchased from Sigma-Aldrich Ltd. (Gillingham, Dorset, UK) unless otherwise stated. Assay buffer was 50 mM Tris-Cl (pH 7.5) and 1 mM ethylenediaminetetraacetic acid (EDTA) containing 0.1% pluronic acid F-127. Hemin was initially dissolved at 5 mM in DMSO. Arachidonic acid was initially dissolved at 10 mM in ethanol, from which it was diluted into 1 mM NaOH for use. 14 C-arachidonic acid was from PerkinElmer (Waltham, MA) (56 mCi/mmol; 50 µCi/mL; ethanol solution). The requisite volume of this ethanol solution was dried down in a stream of oxygen-free nitrogen before use. The fluorescent HTS assay was performed in black 1536-well plates, whereas the mass spectrometry assay was performed in 384-well v-base polypropylene plates (both Greiner Bio-one, Stonehouse, UK). Thin-layer chromatography (TLC) plates were obtained from Sigma-Aldrich. Solvents for mass spectrometry were from Fisher Scientific (Loughborough, UK). mPGES-1, Cox-2, and 15-PGDH were cloned, expressed, and isolated in house (GSK, Stevenage, UK) as described in the supplementary methods.
TLC Assay for Cox-2 and mPGES-1 Activity
A TLC method was used to optimize the kinetics of the in situ PGH2 production (Cox-2 step) and to monitor the activity of mPGES-1 during expression and isolation. Typically, 1-mL reactions were performed in a buffer of 50 mM Tris-Cl (pH 7.5) containing 100 µM 14 C-arachidonic acid, 1 µM Cox-2, 4 µM hemin, and 200 µM phenol. For determination of activity of mPGES-1 preparations, reduced glutathione (GSH) was included at 2 mM. After initiation of the reaction, 50-µL aliquots were removed and quenched with 50 µL of 40 mM tin (II) chloride in 200 mM citric acid (pH 3.0). This has the effect of rapidly reducing unreacted PGH2, which is too unstable for chromatographic separation, to prostaglandin F2α (PGF2α). After quenching, aliquots were extracted with 50 µL ethyl acetate, and 1 to 2 µL of the organic phase was spotted to a glass-backed silica gel 60 TLC plate, which was developed in a mobile phase of ethyl acetate/hexane/acetic acid (30:10:2). After drying, plates were imaged by exposure to phosphorimager plates for 24 h followed by scanning on a Typhoon imager (PerkinElmer) and quantitation by densitometric analysis. High concentrations of reference prostaglandins were analyzed by TLC and visualized by iodine staining to determine the following relative mobility (Rf) values: arachidonic acid (0.97), PGD2 (0.65), PGE2 (0.37), and PGF2α (0.18).
mPGES-1 Fluorescent Assay for HTS
The fluorescent assay was carried out in 1536-well plates at a final volume of 5 µL per well. Test compounds were added to plates as a 50-nL solution in DMSO using an Echo 555 acoustic dispenser (Labcyte, Sunnyvale, CA) prior to the addition of assay components. Additionally, 50 nL DMSO or 2-(6-chloro-9-(3-hydroxy-3-methylbut-1-yn-1-yl)-1H-phenanthro[9,10-d]imidazol-2-yl)isophthalonitrile (compound 1, Table 1 ) was included in two columns each to give 100% activity and 100% inhibition controls, respectively. Single-concentration testing was at 10 µM compound concentration. For pIC50 determination, compounds were tested in duplicate using an 11-point, threefold dilution series from 100 µM prepared using a Biomek FX (Beckman Coulter, Wycombe, UK).
Inhibition of mPGES-1 and 15-PGDH-Diaphorase by Compounds 1 to 4
Data were generated over a minimum of four test occasions and are displayed as mean ± SD. mPGES-1, microsomal prostaglandin E synthase-1; 15-PGDH, 15-prostaglandin dehydrogenase.
To these compound plates, 2 µL of an enzyme solution containing 1.38 µM Cox-2, 25 µg/mL mPGES-1, 0.5 µM 15-PGDH, 2.5 mM NAD+, 250 µM glutathione (GSH), 2.5 U/mL diaphorase, and 25 µM resazurin in assay buffer was added. Following this, 1.5 µL of a 3.33-µM hemin solution in assay buffer was added, and finally the reaction was initiated by the addition of 1.5 µL of 67 µM arachidonic acid solution in 1 mM sodium hydroxide. Final assay concentrations were 0.55 µM Cox-2, 10 µg/mL mPGES-1, 200 nM 15-PGDH, 1 U/mL diaphorase, 20 µM arachidonic acid, 1 µM hemin, 1 mM NAD+, 100 µM GSH, and 10 µM resazurin. All additions were performed using a Multidrop Combi Nanolitre (Thermo Fisher Scientific, Waltham, MA). Plates were rapidly transferred to a ViewLux reader (PerkinElmer) after addition of arachidonic acid and read kinetically for 2.5 min at 15-s intervals (excitation filter 525/20 nm; emission filter 598/25 nm).
Cox-2 and 15-PGDH Deconvolution Assays
Two deconvolution assays were performed to detect compounds inhibiting either Cox-2 or the coupled detection system (15-PGDH and diaphorase). Both assays were performed in 1536-well plates, with a final assay volume of 5 µL per well, with all additions performed using the Multidrop Combi Nanolitre. Compound plate preparation was as per the primary assay.
Cox-2 Assay
Oxidation of 2′7′-dichlorofluorescin to the fluorescent 2′,7′-dichlorofluorescein 15 was coupled to the turnover of arachidonic acid by Cox-2. Initially, 2 µL of enzyme solution containing 12.5 nM Cox-2 diluted in assay buffer was added to compound plates. After a 10-min incubation at room temperature, 1.5 µL of 833 nM hemin in assay buffer was added. The reaction was initiated by the addition of 1.5 µL of a solution containing 8.3 µM arachidonic acid and 16.7 µM 2′,7′-dichlorofluorescin diacetate in 1 mM NaOH. Final assay concentrations were 5 nM Cox-2, 250 nM hemin, 2.5 µM arachidonic acid, and 5 µM 2′,7′-dichlorofluorescin diacetate in 5 µL total volume. The fluorescence intensity was measured immediately using a ViewLux reader (excitation filter 480/20 nm; emission filter 540/25 nm) over 2.5 min at 15-s intervals.
15-PGDH-Diaphorase Assay
Initially, 2.5 µL of an enzyme solution containing 12 nM 15-PGDH, 2 mM NAD+, 2 U/mL diaphorase, and 20 µM resazurin in assay buffer was added to compound plates. The reaction was initiated by the addition of 2.5 µL of 20 µM PGE2 solution in 1 mM NaOH. Final assay concentrations were 6 nM 15-PGDH, 1 mM NAD+, 1 U/mL diaphorase, 10 µM resazurin, and 10 µM PGE2 in a 5-µL final volume. Plates were transferred immediately to the ViewLux reader and measured over 2.5 min at 15-s intervals (excitation filter 525/20 nm; emission filter 598/25 nm).
RapidFire High-Throughput Mass Spectrometry Assay
Compound plates were prepared by transferring 100 nL of test compound diluted in DMSO into 384-well v-base polypropylene plates using an Echo 555 acoustic dispenser. Compounds were prepared in a threefold, 11-point serial dilution from 100-µM final assay concentration. Additionally, 100 nL DMSO was added to columns 6 and 18 of the plates for use as control wells.
To these compound plates, 5 µL of an enzyme solution containing 200 µM GSH, 1.1 µM Cox-2, and 20 µg/mL mPGES-1 in assay buffer was added to columns 1 to 17 and 19 to 24 to give final assay concentrations of 100 µM GSH, 0.55 µM Cox-2, and 10 µg/mL mPGES-1. Additionally, 5 µL of a control solution prepared as above but lacking mPGES-1 was added to column 18 of compound plates to serve as a 100% inhibition control. Next, 2.5 µL of 4 µM hemin in assay buffer was added to all wells, giving a final assay concentration of 1 µM. To initiate the reaction, 2.5 µL of 80 µM arachidonic acid in 1 mM NaOH was added to all wells, giving a final assay concentration of 20 µM. Plates were incubated for 60 s, during which time they were centrifuged at 1000 rpm for 30 s. Then, 30 µL of 25 mM iron (II) chloride in 200 mM citric acid (pH 3.0) was added to all wells to stop the reaction. Once quenched, plates were stable and could either be stored at −20 °C or analyzed immediately. All additions were performed using either a Multidrop Combi Nanolitre (enzyme, hemin, and arachidonic acid additions) or Multidrop Combi (iron [II] chloride addition).
Plates were transferred onto a RapidFire high-throughput solid-phase extraction (SPE) system (Agilent Technologies). Subsequently, 10 µL of sample was aspirated directly from quenched assay plates and loaded onto the RapidFire micro-scale solid-phase C4 extraction cartridge to remove buffer salts with HPLC-grade water containing 0.1% formic acid in a 2-s wash cycle. Analytes were then coeluted into the mass spectrometer in a 2.5-s elution cycle using 80% acetonitrile containing 0.1% formic acid. PGE2 and 12-HHT were monitored on a Sciex API QqQ mass spectrometer (Applied Biosystems, Concord, Ontario, Canada) in negative ESI mode following multiple-reaction monitoring (MRM) transitions at 279.3/179.0 and 351.4/271.1, respectively.
Data Analysis
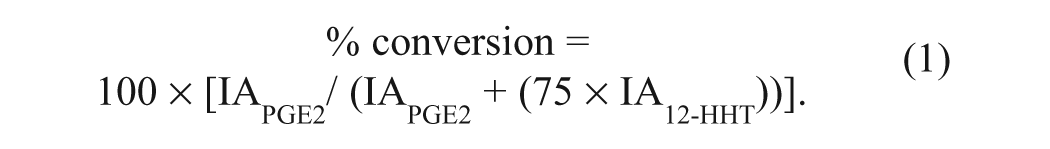
For mass spectrometry assays, peaks were integrated using the RapidFire integrator software, and percent conversion from substrate to product was calculated according to equation (1), where IA is the integrated peak area for the respective analyte.
For the fluorescent assay, initial rates were obtained from the slope of the reaction time course over 2.5 min and were calculated in ActivityBase (IDBS, Surrey, UK).
Percent conversion and initial rate values for the two respective assays were then further analyzed in ActivityBase to generate percent inhibition data. For dose-response screening, curves were then fit to equation (2):
where a is the uninhibited response, d is the fully inhibited response, [I] is the inhibitor concentration, and h is the Hill slope.
Results and Discussion
Coupled Fluorescent Assay Development
The coupled mPGES-1 assay was based on the work of Percival 7 with some modifications. In the previously described assay, the substrate of mPGES-1 (PGH2) was formed by the action of Cox-2 on arachidonic acid under conditions that gave a rapid formation of PGH2 relative to its rate of spontaneous decay. The same principle was applied here, except that the Cox-2 reaction was performed in the same well as the mPGES-1 reaction to facilitate ease of operation in HTS.
The kinetics of the Cox-2 step were initially investigated in isolation using 14 C-arachidonic acid followed by TLC separation and phosphorimage quantitation. After initiation by addition of arachidonic acid, time courses were generated by quenching reactions with tin (II) chloride, which rapidly reduces unreacted PGH2 to PGF2α, 6 which could then be separated from PGE2 and unreacted arachidonic acid by TLC on silica plates (results not shown). PGD2, which is a lesser product of the spontaneous decomposition of PGH2, was also observed. Conditions were defined under which PGH2 was formed at approximately its KM for mPGES-1, for which a value of 14 µM has been published for enzyme expressed in Sf9 cells. 16 This reaction was essentially complete within a period of 60 s. The subsequent spontaneous decay of PGH2 correlated kinetically with the formation of PGE2 at a rate constant of 0.07 min−1. This corresponds to a half-time of 10.5 min for the spontaneous decay of PGH2, which agreed with literature observations. 6 This rate defines the background in an activity assay for mPGES-1, and the challenge is then to measure a steady-state catalyzed rate of PGE2 formation that is robustly above this background. The linearity of this reaction will necessarily be short, on the order of 2 min before onset of substrate depletion is observed.
The same approach to PGE2 detection was employed as described by Percival,
7
coupling the oxidation of PGE2 formed to the reduction of NAD+ to NADH by 15-PGDH. It has previously been shown that 15-PGDH does not significantly oxidize the 15-hydroxyl group of PGH2 analogues.
7
In non-HTS applications, either the absorbance or fluorescence of NADH could be used as a readout of PGE2 formation, but the short wavelengths are not suitable for HTS because of the prevalence of compound interference. To yield a long-wavelength fluorescent signal proportional to the concentration of PGE2 formation, the reoxidation of NADH was coupled to the reduction of resazurin to resorufin using diaphorase, which has been described previously.
17
The final mPGES-1 coupled assay with in situ PGH2 generation is illustrated in
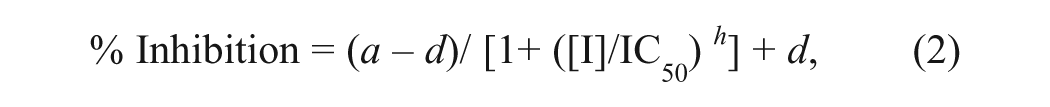
During assay optimization, the rate of PGE2 formation was typically measured over a 5- to 10-min time window, and initial rates were extracted from the linear region of the reaction (~2 min). A concentration of mPGES-1 was chosen that gave a signal to background of approximately 3:1. A typical time course is shown in Figure 1A , where the background reaction was generated by omitting mPGES-1. Although there was not much scope to vary the concentration of mPGES-1 while retaining linearity, the response of the rate to mPGES-1 concentration over a limited range was linear, as shown in Figure 1B . To demonstrate that the assay signal was specific to mPGES-1, microsomes were prepared from Sf9 cells transfected with an unrelated protein and subjected to an identical preparation procedure. These were tested in the assay and found to give a similar rate to the background obtained where no microsomes were added (data not shown). As further assay validation, published mPGES-1 inhibitors 2-(6-chloro-9-(3-hydroxy-3-methylbut-1-yn-1-yl)-1H-phenanthro[9,10-d]imidazol-2-yl)isophthalonitrile and N-(9-ethyl-9H-carbazol-3-yl)-2-(trifluoromethyl)benzamide ( Table 1 , compounds 1 and 2) were tested in the assay, resulting in pIC50 values (negative log of IC50) of 7.8 ± 0.11 and 6.8 ± 0.15, respectively (n = 6; Fig. 1C ). These data are in accordance with previously published values for these compounds.19,20
Development of the microsomal prostaglandin E synthase-1 (mPGES-1) fluorescent assay. (
Fluorescent Assay: HTS Adaptation and Primary Screening
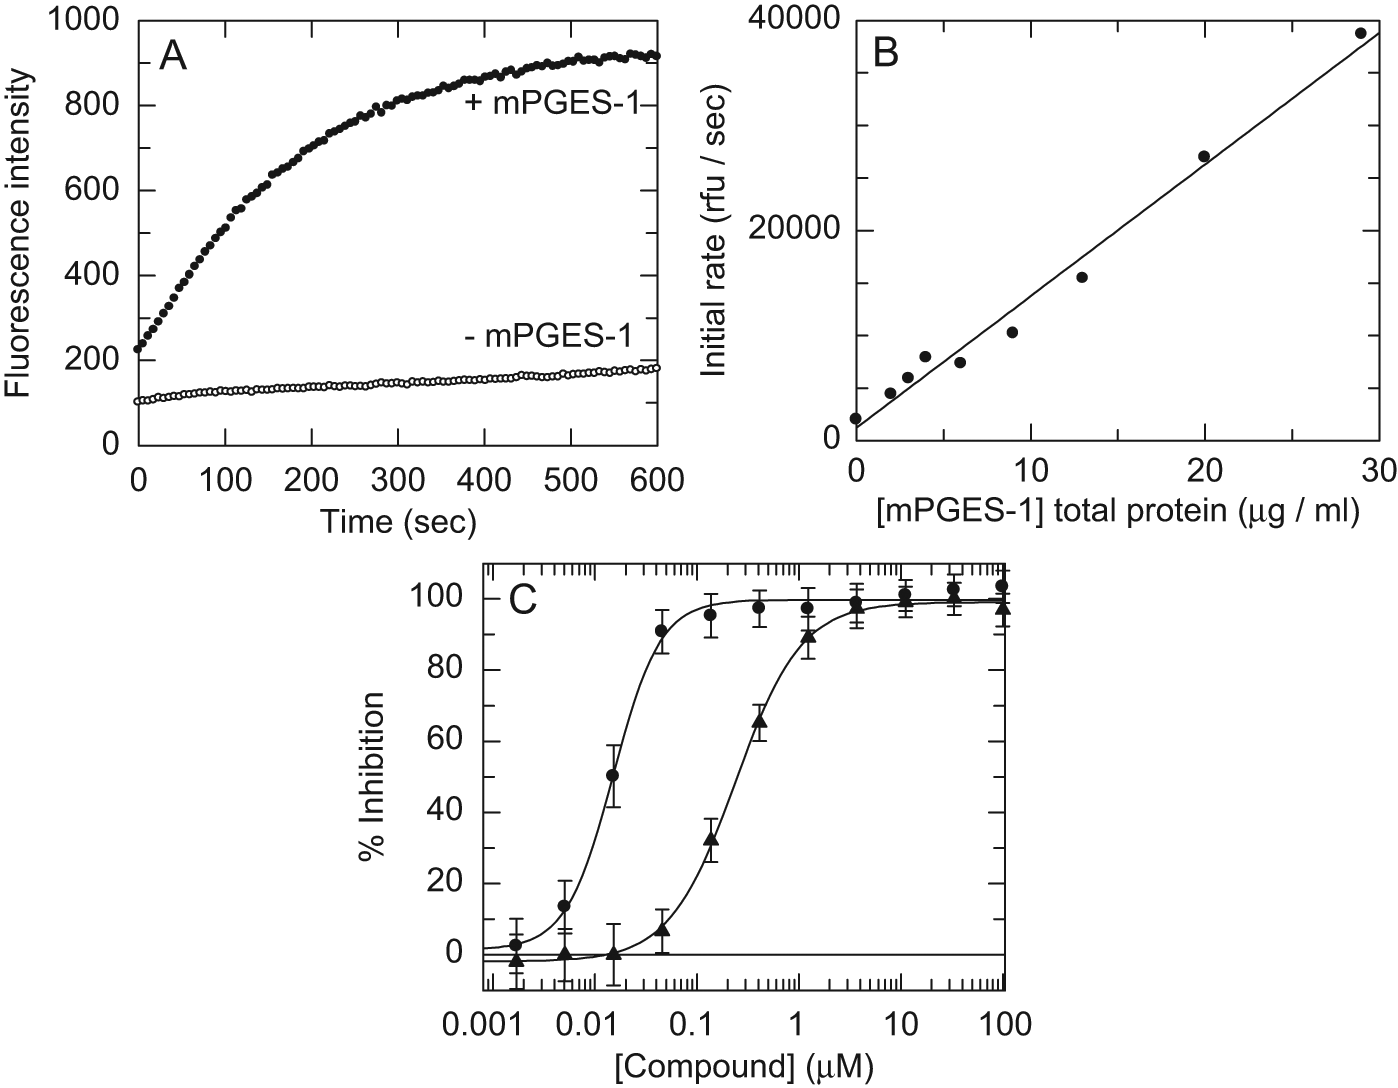
The fluorescent assay was miniaturized to a final well volume of 5 µL in 1536-well plates. Hemin, which is an essential cofactor of Cox-2, was found to compromise the longer term stability of Cox-2 when in excess over protein and was thus added separately to assay plates. A key element to the success of the assay conversion was the ability to obtain kinetic data in a short time frame from all wells of the plate simultaneously. This was achieved using the ViewLux imager. Another important technical requirement was the ability to add the initiating reagent (arachidonic acid) rapidly within the timescale of the reaction, which was achieved using the Multidrop Combi Nanolitre. To validate the final assay configuration, a set of 9800 diverse chemotypes was screened in triplicate in the primary mPGES-1 HTS assay format at 10 µM. The correlation between the three replicates was excellent, with an interclass correlation coefficient of 0.96 ( Fig. 2A ).
Microsomal prostaglandin E synthase-1 (mPGES-1) high-throughput screening (HTS). (
The primary screening campaign of 500 000 compounds was completed in 8 working days with an average throughput of 63 360 compounds per day. The mean robust cutoff (defined as the mean of samples plus 3 × standard deviation of samples) during primary screening was 51.9%, yielding a robust hit rate of 1.34%. This is comparable to a hit rate of 0.84% published for a previous screen against mPGES-1 using an enzyme immunoassay format. 21 In that format, a maximum throughput of 10 752 compounds per day was achievable due to the instability of PGH2. The increased throughput of the assay format described here ensured that plate occupancy was less crucial, allowing for the use of control wells to monitor Z′, something that was not possible in the previously published screen. Figure 2B shows the distribution of Z′ values throughout the campaign. The median Z′ factor was 0.54. 22 Pharmacology was also monitored via standard compounds for each batch of plates, with pIC50 values stable throughout the screen ( Fig. 2C ).
Based on the statistical cutoff, a total of 6609 primary hits were identified for progression. Filtering of this primary hit list via structural and physicochemical criteria resulted in a final list of 4154 compounds. These were progressed to pIC50 determination in the mPGES-1 assay as well as in both deconvolution assays (Cox-2 and 15-PGDH-diaphorase). At the pIC50 stage, 1323 compounds exhibited selective inhibition of mPGES-1, with activity in only the primary mPGES-1 assay and not the Cox-2 or 15-PGDH-diaphorase assays. Ninety percent of these compounds displayed pIC50 values between 5 and 7, whereas 10% of compounds displayed potencies above 7. Of the nonselective compounds, 1797 showed activity against 15-PGDH-diaphorase (with a distribution of potencies similar to that obtained for the mPGES-1-selective inhibitors) and 176 against Cox-2. Twenty percent of compounds tested in dose response did not confirm as active against mPGES-1.
RapidFire High-Throughput Mass Spectrometry Assay Development and Compound Profiling
Mass spectrometry is an attractive method with which to follow up hits from fluorescent-based HTS. The label-free nature of detection eliminates the risk of fluorescent interference,23,24 and target-specific activity of inhibitors identified in an HTS can therefore be confirmed. In the case of mPGES-1, the fluorescent assay was successful in identifying a number of mPGES-1 inhibitor chemotypes from an HTS, with potencies up to 10 nM. Although this assay provided a robust, miniaturized format for HTS, it was less suited to ongoing compound profiling and hit progression. This was due to the number of coupling enzymes present in the system and therefore the risk of false positives from compounds inhibiting these enzymes rather than mPGES-1 itself. In addition, there was potential for fluorescent interference from autofluorescent or quenching compounds. The data would therefore need to be deconvoluted for each compound tested, something that is achievable when evaluating the output of a one-off HTS campaign, but more resource intensive for continued compound profiling, for which assays are often screened on a weekly basis for prolonged periods of time. The requirement for resupply of coupling enzymes to support ongoing compound profiling was also significant. With this in mind, a novel HTMS-based assay was developed for this target, using the RapidFire system. The assay employed the same in situ substrate generation step as the fluorescent assay, after which both the PGE2 product and a surrogate of the unreacted substrate (12-HHT) could be detected by mass spectrometry.
The RapidFire overcomes the issue of slow sample preparation, which has traditionally been the bottleneck for HTMS.8-13 The system produced baseline resolved peaks with widths of approximately 2.5 s, and the total cycle time, including wash, elution, and reequilibration of the cartridge, was 6 s per sample, facilitating analysis times of less than 40 min per 384-well plate. The established method allowed for the screening of >14 000 wells per day. This throughput is not comparable to many traditional 1536-well HTS assay formats, and as such, there is still a requirement to develop such assays to identify hits from large screening collections. However, the RapidFire format is more than adequate for high-throughput structure-activity relationship (SAR) screening for enzyme targets and HTS follow-up as described here.
To establish the relative sensitivity for the two analytes of interest (12-HHT and PGE2), dose-response curves of each analyte were generated in assay buffer ( Fig. 3 ). There is a 75-fold difference between the slopes of the PGE2 and 12-HHT response curves. To normalize for this, percent conversion of the mPGES-1 reaction throughout these studies was calculated according to equation (1).
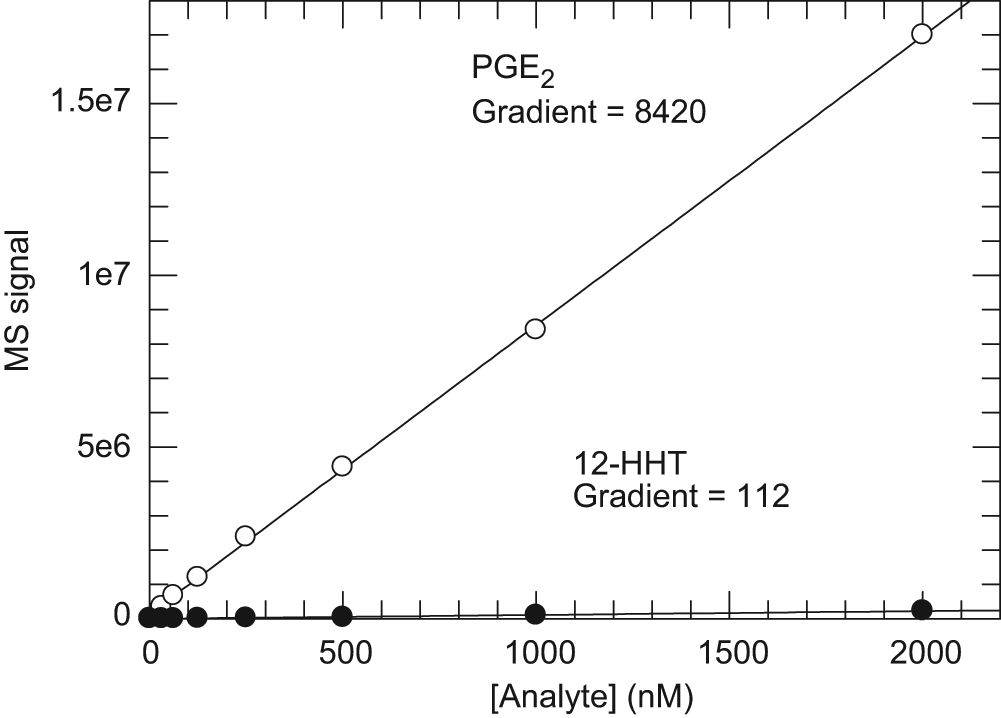
Mass spectrometry (MS) signal response of dilution series of 12-HHT and PGE2. The ratio of the slopes of the two dose response curves (mPGE2/m12-HHT = 75) was used as a correction factor to calculate % conversion in all microsomal prostaglandin E synthase-1 (mPGES-1) reaction measurements.
A reaction time course was performed under varying concentrations of mPGES-1. As expected, the duration of linearity decreases with increasing concentrations of mPGES-1 ( Fig. 4 ). For pharmacology testing, a concentration of 10 µg/mL total protein was chosen, and the reaction was stopped at 1 min. The RapidFire assay gave high-quality data, with a mean Z′ of 0.85 ± 0.06. 22
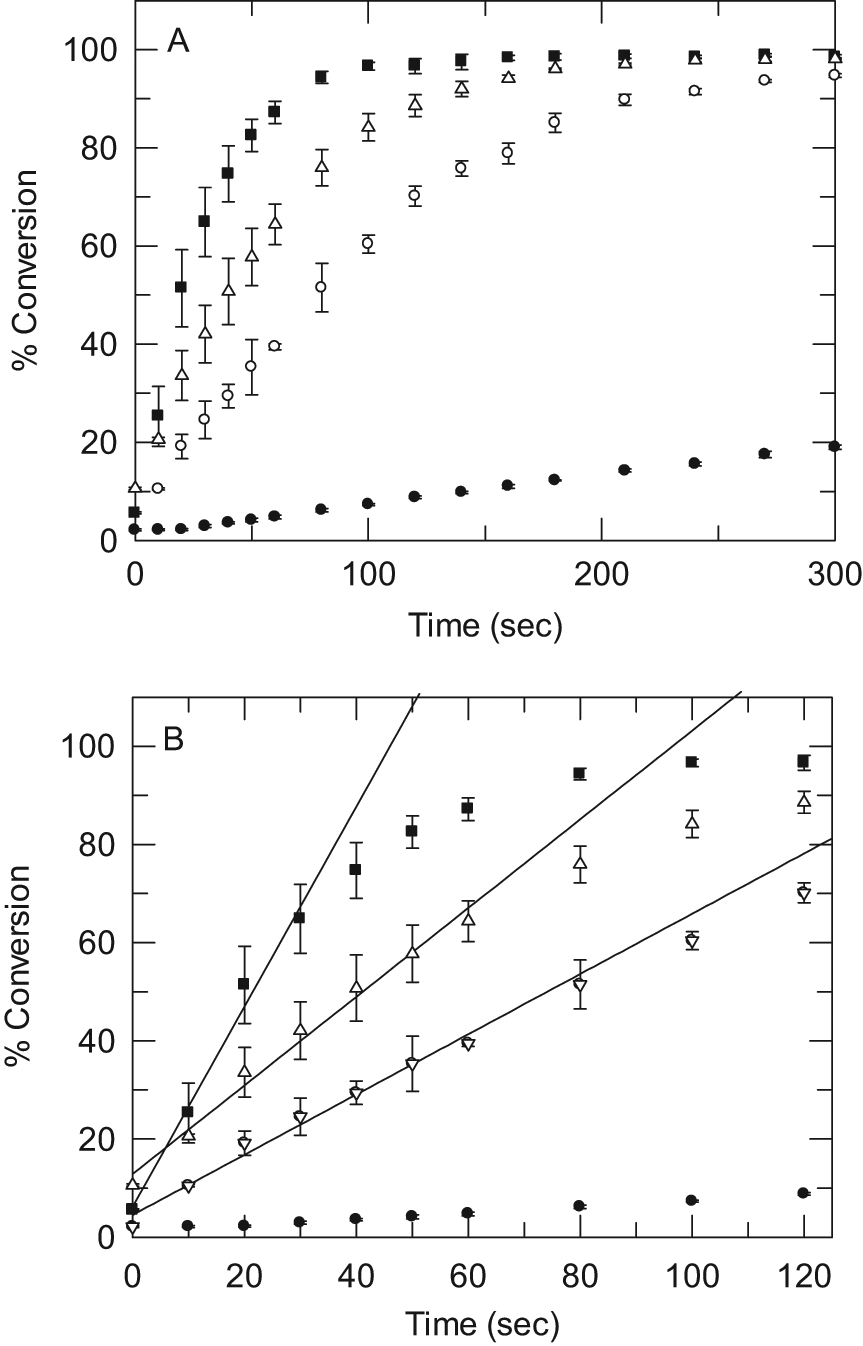
(
To further validate the RapidFire assay for ongoing compound profiling and to assess its benefit over the fluorescent assay for this purpose, a validation set of 171 compounds was screened in parallel in the RapidFire mass spectrometry assay, the mPGES-1 fluorescent assay, and the 15-PGDH-diaphorase deconvolution assay. The validation set was chosen to include both selective and unselective mPGES-1 inhibitors, as well as some unknown compounds produced for ongoing chemistry efforts, with a view to investigating the ability of the HTMS assay to identify genuine actives. Figure 5 shows a correlation of individual pIC50 values in the mPGES-1 mass spectrometry and fluorescent assays. Sixty-eight of 171 compounds tested (40%) were inactive in both assays (pIC50 <4). This was not unexpected, as some of the compounds chosen for screening were part of an ongoing SAR screening campaign, and one would therefore expect a proportion of compounds tested to be inactive. Sixty-five of 171 compounds tested (38%) were active in both assays, with mean pIC50 values between 4 and 9. The correlation between compounds active in both assays was excellent, with an R2 value of 0.92.
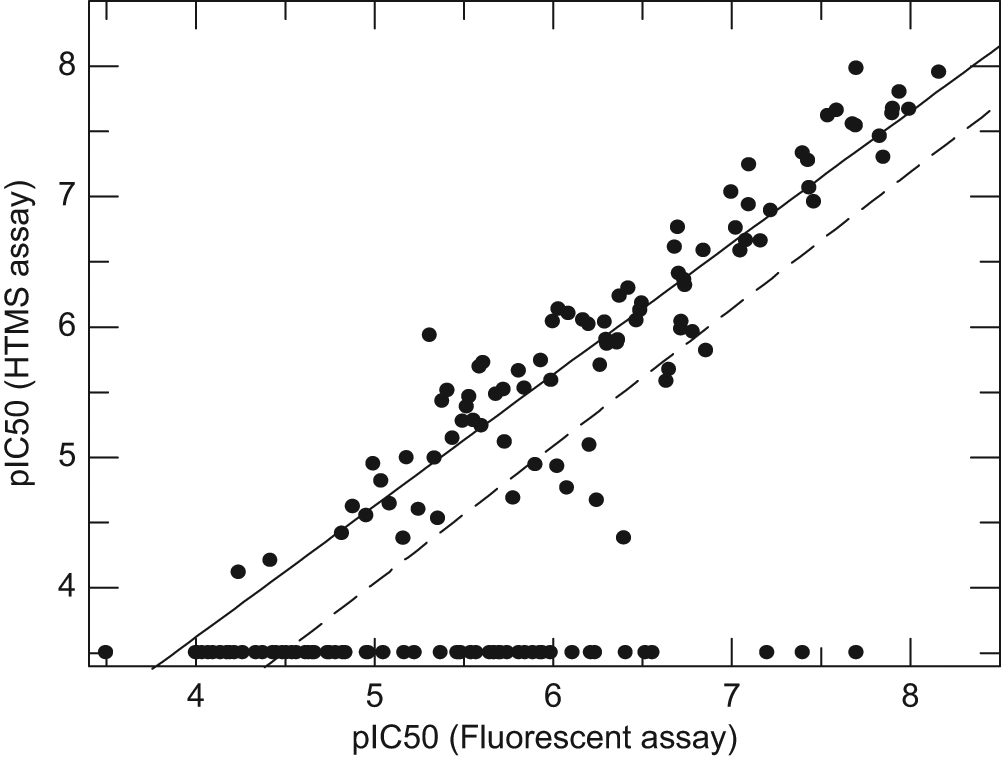
Correlation of pIC50 values between the microsomal prostaglandin E synthase-1 (mPGES-1) RapidFire mass spectrometry and coupled fluorescent assays. The dotted line shows the correlation of compounds that were active in either or both assays (R2 = 0.77); the solid line shows the correlation of compounds that were active in both assays (R2 = 0.92). Where compounds were tested on more than one occasion, individual values are plotted. HTMS, high-throughput mass spectrometry.
Among the compounds showing a good correlation were 1 and 2 ( Table 1 ), reported as mPGES-1 inhibitors by groups at Merck-Frosst 19 and Angelini, 20 respectively, and used previously to validate the fluorescent mPGES-1 assay. Compound 1 gave a pIC50 of 7.8 ± 0.11 in the fluorescent assay and 8.1 ± 0.28 in the mass spectrometry assay ( Figs. 1C and 6 ). A pIC50 of 9 was reported in the literature using different assay conditions. Compound 2 gave a pIC50 of 6.8 ± 0.15 in the fluorescent assay and 6.9 ± 0.15 in the mass spectrometry assay. Data from Angelini for this compound report a pIC50 of 6.2 in a whole-cell study of inhibition of PGE2 production. 20
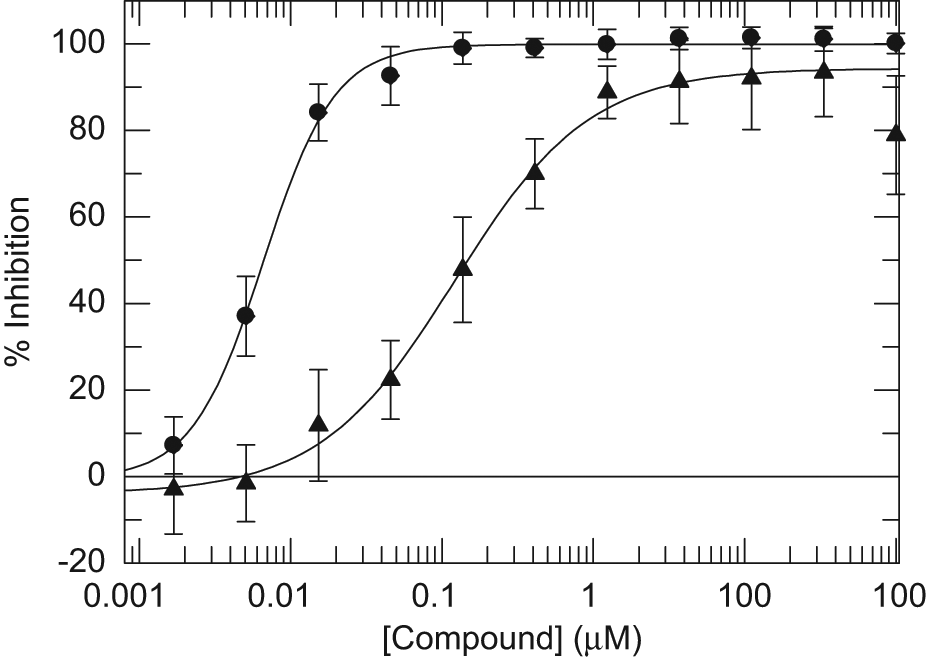
Dose-response curves for two microsomal prostaglandin E synthase-1 (mPGES-1) inhibitor compounds 1(•) and 2(▲) ( Table 1 ) in the RapidFire mass spectrometry assay. All conditions were as described under Materials and Methods.
Thirty-eight compounds (22%) showed some activity in the fluorescent assay but no activity in the HTMS assay, indicating that they are either fluorescent assay false positives or HTMS false negatives. No compounds were observed with the opposite profile. Twenty-three of the 38 discrepant compounds showed only weak activity (pIC50 <5) in the fluorescent assay, suggesting that they were at the limits of detection in both assays, and a correlation of pIC50 at this activity level is therefore difficult. Many of the discrepant compounds also showed inconsistent data, being inactive on further test occasions, for example, N-(5-methl-3-isoxazolyl)-2-[(2-methylthieno[2,3-e][1,3]benzothiazol-5-yl)oxy]acetamide ( Table 1 , compound 4), which initially reported a pIC50 of 7.4 in the fluorescent assay but on three subsequent test occasions gave a pIC50 of 4.0. Of the 38 discrepant compounds, 6 showed weak activity in other fluorescent assays, suggesting they could be fluorescent assay false positives. This hypothesis could be confirmed by screening in a wider range of fluorescent assays. Another potential cause of false positives in the fluorescent mPGES-1 assay was via inhibition of the other enzymes present in the coupling system (15-PGDH or diaphorase). An example of this was 1-(4-biphenylylcarbonyl)hexahydro-1H-azepine ( Table 1 , compound 3), which was inactive in the HTMS assay, in contrast to a pIC50 of 7.2 ± 0.33 in the fluorescent assay. This was a fluorescent assay false positive due to 15-PGDH-diaphorase activity (pIC50 8.6 ± 0.09 in the 15-PGDH-dipahorase assay). This was also the case for a further seven compounds in the data set, including compound 4, which also showed moderate 15-PGDH activity. These data demonstrate that the RapidFire HTMS assay is able to distinguish genuine mPGES-1 inhibitors from inhibitors of the coupling system or fluorescent interferers, therefore reducing the potential for false positives to be progressed compared with the fluorescent assay.
Ideally, the RapidFire assay would have been used not only for ongoing compound profiling but also for initial hit identification and HTS. There are examples emerging of groups using RapidFire for higher throughput screening, in the region of hundreds of thousands of compounds. 25 However, although this approach is suitable for targets where previous knowledge or structural information enables the design of focused compound sets, it is less feasible for more novel targets, for which a full diversity HTS of one or two million compounds is the most appropriate course of action to identify starting points for chemistry. Pooling compounds and other similar strategies may enable full HTS by RapidFire, but it is unlikely that the throughput will ever match that of the fluorescent assay described here, where 500 000 compounds were screened in just over 1 week. The use of various complementary assays, exploiting both the high throughput of fluorescent-based techniques and the direct, label-free detection of HTMS at different stages of the lead discovery process, is therefore key to success. This gives increased confidence in the leads identified and was an enabling strategy to drive a discovery program for a challenging target such as mPGES-1.
Footnotes
Acknowledgements
The authors thank Maxine Jonas (Agilent Technologies) for help with the RapidFire instrument set up. We also thank the following individuals at GSK: Mike Rees for provision of resupply batches of mPGES-1 and Ryan Bingham and Jason Suckling for developing the Cox-2 assay.
The authors declared no potential conflicts of interest with respect to the research, authorship, and/or publication of this article.
The authors received no financial support for the research, authorship, and/or publication of this article.
References
Supplementary Material
Please find the following supplemental material available below.
For Open Access articles published under a Creative Commons License, all supplemental material carries the same license as the article it is associated with.
For non-Open Access articles published, all supplemental material carries a non-exclusive license, and permission requests for re-use of supplemental material or any part of supplemental material shall be sent directly to the copyright owner as specified in the copyright notice associated with the article.