
Abstract
The predominant assay detection methodologies used for enzyme inhibitor identification during early-stage drug discovery are fluorescence-based. Each fluorophore has a characteristic fluorescence decay, known as the fluorescence lifetime, that occurs throughout a nanosecond-to-millisecond timescale. The measurement of fluorescence lifetime as a reporter for biological activity is less common than fluorescence intensity, even though the latter has numerous issues that can lead to false-positive readouts. The confirmation of hit compounds as true inhibitors requires additional assays, cost, and time to progress from hit identification to lead drug-candidate optimization. To explore whether the use of fluorescence lifetime technology (FLT) can offer comparable benefits to label-free-based approaches such as RapidFire mass spectroscopy (RF-MS) and a superior readout compared to time-resolved fluorescence resonance energy transfer (TR-FRET), three equivalent assays were developed against the clinically validated tyrosine kinase 2 (TYK2) and screened against annotated compound sets. FLT provided a marked decrease in the number of false-positive hits when compared to TR-FRET. Further cellular screening confirmed that a number of potential inhibitors directly interacted with TYK2 and inhibited the downstream phosphorylation of the signal transducer and activator of transcription 4 protein (STAT4).
Keywords
Introduction
There is a continual need to sample expanded chemical diversity in the identification of new therapeutics. To facilitate this, there have been many advances in automation and miniaturized assay technologies, in which fluorescence-based formats have dominated. The majority of these technologies enable the rapid measurement of enzymatic activity or the binding of a ligand to its target in line with the ultra-high-throughput screening (uHTS) ethos of screening more than 100,000 compounds per day.1,2 Despite the advantages of using fluorescence-based assay detection methodologies, the requirement of a fluorophore to monitor the activity of an interaction with the target can in many cases lead to the identification of assay detection artifacts. These false positives may be a result of systematic variations in fluorophore amount (i.e., reagent dispensing) or test compounds that themselves can fluoresce, absorb, or quench the emission of the reporter fluorophore. 3
Time-resolved fluorescence resonance energy transfer (TR-FRET) is a well-validated and widely used assay technology for both biochemical and cellular-based small-molecule screening. 4 The use of chelated lanthanides as donor fluorophores, which have high luminescent quantum yields and long lifetimes, provides a highly robust assay signal mostly free from test compound autofluorescent interference due to the time-gated nature of the readout. Despite the many advantages of this assay methodology, projects using TR-FRET as the detection technology are still susceptible to a range of pan-assay interference compounds (PAINS 5 ).6,7 In contrast, mass spectroscopy (MS) is used as the benchmark conformational methodology in early-stage drug discovery. Because it is a direct detection method, fluorescently labeled substrates are not required, thus reducing the number of false-positive hits associated with fluorescent interference. Its application, predominantly using the Agilent RapidFire mass spectrometry (RF-MS) system (Agilent, Stockport, UK), 8 has led to an increase in the physiological relevance of results when compared to fluorescence intensity–based approaches, 9 while eliminating up to 80% of the false-positive hits generated when using fluorescence-based detection technologies. 10 Although MS formats lack the throughput of fluorescence-based methodologies, alternative approaches through techniques such as matrix-assisted laser desorption ionization time-of-flight (MALDI-TOF) 11 or acoustic ejection mass spectroscopy (AEMS) 12 greatly reduce sample analysis times and assay volume requirements when compared to RF-MS. Regardless, all MS-based technologies are expensive and require specialized automation and equipment, along with dedicated support to maintain the systems and configure assay protocols.
Combining the simplicity, cost, and throughput of TR-FRET with the robust output of a MS-based system would provide the optimum platform to execute screening campaigns. One approach would be through the measurement of fluorescence lifetime—the time taken for a fluorophore to relax to its ground state following photoexcitation. Fluorescence lifetime technology (FLT) has been postulated to be the most robust fluorescence-based detection technology due to the intrinsic attributes of monitoring the fluorescence lifetime of a fluorophore. 13 Given that both FLT and RF-MS assays are less prone to test compound artifacts, the expectation would be that both technologies could yield equivalently robust and comparable datasets. A side-by-side comparison of FLT with commonly used high-throughput detection technologies has been limited, however, by the lack of commercially available FLT microplate readers and appropriately long-lifetime reporter fluorophores, a requirement for mitigating compound autofluorescent interference. The emergence of long-lifetime reporter fluorophores, notably FLEX17, 14 which has a lifetime of 17 ns and a fluorescent emission that is quenched by aromatic residues, iron chelates, or covalently linked quenchers, has paved the way for the development of FLT assays for proteases,15,16 serine/threonine kinases,17,18 and tyrosine kinases.18,19
Tyrosine kinase 2 (TYK2), part of the JAK (Janus kinase) family, regulates cytokine-driven pro-inflammatory signaling pathways that result in chronic inflammation in immune-mediated diseases such as psoriasis, lupus, and ulcerative colitis, 20 and has been linked as a causative factor for critical illness in Covid-19 patients. 21 Using TYK2-mediated peptide phosphorylation as a model enzyme system, a comparative study was carried out with equivalent assay conditions using FLT, TR-FRET, or RF-MS detection methodologies. The FLT assay used a peptide with a C-terminal FLEX17 tag that is quenched by tyrosine; phosphorylation alleviates the quenching and increases its fluorescence lifetime. For the TR-FRET assay, the peptide contained a C-terminal Alexa Fluor 647 fluorophore; its fluorescence intensity increases following energy transfer from a LANCE (lanthanide chelated excite) chelated europium anti-phosphotyrosine (pTYR) antibody. The RF-MS format uses a native unmodified peptide; a mass-to-charge difference of 80 Da is observed between nonphosphorylated and phosphorylated peptides. Screening of a variety of compound sets in these three TYK2 assays, which represent known PAINS, kinase chemotypes, and drug-like diversity, enabled a comparative assessment of the benefits and limitations of each detection methodology.
Materials and Methods
Materials
All reagents were obtained from Sigma-Aldrich (St. Louis, MO), unless otherwise stated. Substrate peptides were prepared by either Cambridge Research Biochemicals (Billingham, UK) or Almac (Edinburgh, UK) using standard procedures and were labeled, as described below, based on the assay format. TYK2 kinase domain (883–1182) was obtained from Proteros (Martinsried, Germany) and tested for purity by sodium dodecyl sulfate–polyacrylamide gel electrophoresis (SDS-PAGE; >90%) and protein concentration using the Bradford assay. Small-molecule screening libraries or selected serially titrated compound dissolved in 100% DMSO were dispensed into microplates using the Echo Liquid acoustic dispenser (Labcyte, San Jose, CA). SPE C4 cartridges were supplied by Agilent.
FLT, TR-FRET, and RF-MS Assay Configuration and Compound Screening
To allow a direct comparison across all detection technologies, equivalent assay conditions were used for each methodology when possible. The TYK2 substrate peptide, NH2-KKVLEFYEEEEGG-COOH, was labeled at the C-terminus with either FLEX17 (Almac) for FLT or Alexa Fluor 647 (Thermo Fisher, Waltham, MA) for TR-FRET. An unmodified version of the TYK2 substrate peptide was used in the RF-MS assay. To configure the three detection methodologies, phosphorylated versions of the aforementioned peptides were prepared. Temperature conditions for all steps of these protocols were at room temperature. Small-molecule libraries were screened in duplicate on separate test occasions at 10 µM, and selected compounds serially diluted (one in three) from 100 µM for concentration–response screening. All assay components were dispensed into 384- and 1536-well plates using a MultiDrop Combi or Combi nL dispenser (Thermo Fisher). For FLT/TR-FRET and RF-MS assays, 2.5 µL or 5 µL respectively of TYK2 enzyme solution was pre-incubated with compound for 30 min prior to the addition of an equal volume of peptide/ATP (adenosine triphosphate) solution in the same buffer [50 mM Tris-HCl pH 7.4, 1 mM CHAPS, 10 mM MgCl2, 0.01% bovine serum albumin (BSA), and 1 mM dithiothreitol (DTT)]. FLT/RF-MS reactions were stopped by the addition of 10 µL 100 mM citric acid, whereas TR-FRET reactions were stopped by 10 µL of detection buffer [1 nM LANCE Europium PT66 anti-pTYR antibody (PerkinElmer, Waltham, MA), 100 mM HEPES-NaOH (pH 7.5), 150 mM NaCl, 50 mM ethlenediaminetetraacetic acid (EDTA), and 0.01% BSA]. For full assay configuration, refer to Table 1 .
Assay Conditions and Screening Parameters for the FLT, TR-FRET, and RF-MS TYK2 Assays.

Note: For assay and buffer compositions, see the Materials and Methods section. For discrepancies in assay conditions, refer to the text. ATP, Adenosine triphosphate; FLT, fluorescence lifetime technology; pTYR, phosphotyrosine; RF-MS, RapidFire mass spectroscopy; TR-FRET, time-resolved fluorescence resonance energy transfer; TYK2, tyrosine kinase 2.
The screening of known JAK family inhibitors was performed with saturating ATP (2 mM) and an ATP concentration equivalent to the TYK2Km, ATP (30 µM).
For the PAINS set, screening was repeated such that enzymatic reactions were carried out in the absence of compound, stopped, then added to the compound microplates to identify technology-specific interferences.
FLT Instrumentation and Analysis
The Ameon FLT plate reader (TTP Labtech, Cambridge, UK) coupled to an Orbitor RS2 microplate mover (Thermo Fisher) was used to capture decay curves in real time. Samples were excited using a 405 nm laser, and fluorescence emission was detected with a 438 nm bandpass filter. Photomultiplier tube (PMT) signal attenuation was determined automatically by the selection of an assay bright well (from the high control population), and 5000 decay curves were captured to yield a read time of 300 ms well−1. The decay curves were averaged and fitted with a biexponential decay curve fit [Suppl. Eq. (S1); all equations in Supplementary Material] using the Ameon software, with fitting constraints applied to the substrate and product fluorescence lifetimes (13.5–14.5 ns and 17.5–18.5 ns, respectively). The average lifetime was calculated [Suppl. Eq. (S2)] and used to determine the percentage conversion of substrate to product [Suppl. Eq. (S3)], 18 whereby inhibitors of TYK2 lead to a decrease in enzymatic conversion and therefore fluorescence lifetime.
TR-FRET Instrumentation and Analysis
An EnVision multimode plate reader (PerkinElmer) was used for TR-FRET assays. A 337 nm laser was used to excite the samples, with emission detection via europium (615 nm) and allophycocyanin (APC) (665 nm) filters. A 20 μs delay between sample illumination and intensity measurement was used to mitigate compound autofluorescence. The average read time was 300 ms well−1. The ratiometric calculation of acceptor-to-donor intensity was used as the final readout [Suppl. Eq. (S4)].
RapidFire-MS Instrumentation and Analysis
The RapidFire 200 instrument was coupled to either an API4000 or 6500 triple quadrupole mass spectrometer (SCIEX, Framingham, MA). The mass spectrometer was operated in positive electrospray multiple reaction monitoring (MRM) mode, with a dwell time of 50 ms and spray voltage of 5500 V at a source temperature of 650 °C. Mass spectrometer settings for each analyte were optimized across both mass spectrometers with Q1/Q3 m/z transitions for substrate and product based on the highest peak intensities observed during the tuning process.
Samples were sequentially aspirated from the 384-well assay plates and passed across a proprietary solid-phase extraction C4 cartridge. The cartridge was washed with aqueous buffer [0.1% formic acid in high-performance liquid chromatography (HPLC) water], and the sample eluted by organic buffer (80% acetonitrile and 0.1% formic acid in HPLC water), resulting in an overall cycle time of approximately 9 s well−1. Individual MRM chromatograms were integrated and processed using the RapidFire peak integration software (version 3.6), with data reported as the percentage conversion from substrate to product [Suppl. Eq. (S5)]. Assessment of ionization efficiencies demonstrated comparable peak area data for both product and substrate analytes, and thus a scaling factor to account for any ionization differences of analytes was not needed (data not shown).
Data Analysis and Visualization
Data were collated and analyzed using ActivityBase (IDBS, Guildford, UK), which calculated the percentage inhibition value for each well [Suppl. Eq. (S6)]. Data were extracted into Microsoft Excel, and all graphs were subsequently plotted using either GraFit (version 7.0.3, Erithacus Software, Surrey, UK) or Prism 8 (GraphPad, San Diego, CA). Multipanel figures were generated using Illustrator (Adobe, San Jose, CA). Z prime values [Suppl. Eq. (S7)] were used throughout to give a measure of both the intra- and interpopulation variation of the control wells, with anything greater than 0.7 deemed acceptable.
For the single-concentration screening, the activity cutoff [Suppl. Eq. (S8)] is calculated as three standard deviations higher than the mean of the assay response for all screened test compounds, with robust statistics applied such that active compounds with large percentage inhibition values do not contribute to the calculation of the threshold. Hit rate is defined as the proportion of the responses of test compounds that fall higher than the cutoff [Suppl. Eq. (S9)]. For concentration–response screening, a plot of percentage inhibition against compound concentration was fitted using a four-parameter logistical calculation [Suppl. Eq. (10)], from which half-maximum inhibitory concentration (IC50) values are determined.
Results
Developing and Optimizing Three Equivalent Biochemical Assays
To facilitate the generation of comparable TYK2 screening datasets, FLT, TR-FRET, and RF-MS assays were developed in parallel to ensure that similar assay conditions were used (
Table 1
). To match TYK2 substrate turnover as closely as possible between assays, while ensuring linearity of activity and sufficient signal, a maximum limit of 40% peptide phosphorylation was set. Due to the detection limits of the RF-MS instrument used, the assay was configured with both a higher peptide concentration and longer reaction time than FLT reactions to ensure sufficient product could be quantified. Conversely, a lower peptide concentration (30 nM) for the TR-FRET assay was used to minimize the quantity of europium-chelate conjugated anti-pTYR antibody required (1 nM). Regardless, peptide concentrations across the three assays were at least 100-fold lower than the apparent TYK2Km, peptide of >1 mM (FLT:
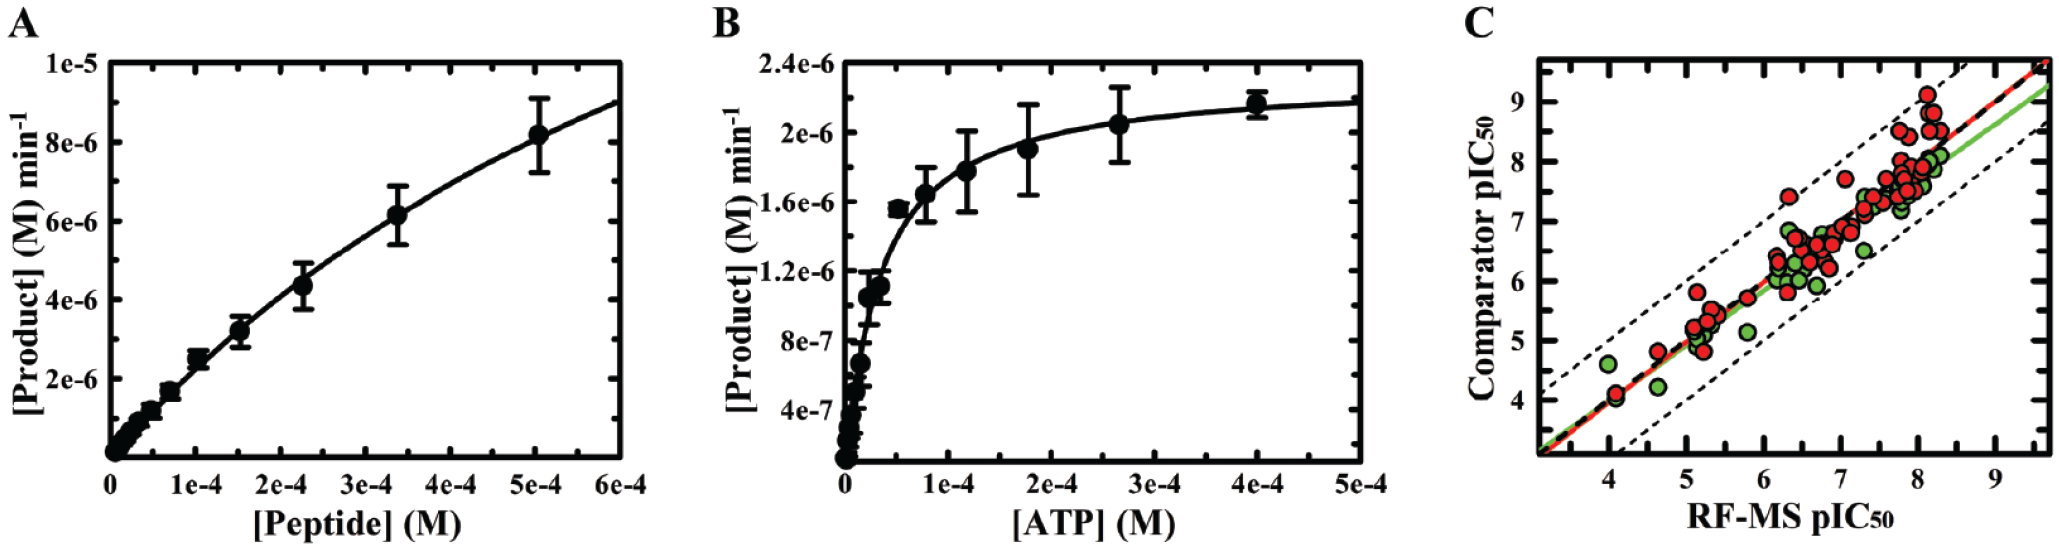
Kinetic parameter determination and activity confirmation. Representative plots showing the initial rates of product formation, v0, against the concentration of (
A concentration of 2 mM ATP was used in all three assays, equivalent to reported cellular physiological levels, which is >50-fold in excess of the TYK2Km, ATP determined to be 30–40 µM (FLT:
Alternative conditions using 30 μM ATP, equivalent to the TYK2Km, ATP, were used to screen the JAK family inhibitors in each of the three biochemical assays (
Nuisance (PAINS) Compound Screening
The minimization of hit rates during the development of biochemical assays can help reduce the number of erroneous assay artifacts, typically manifested as false positives, that are obtained during a subsequent high-throughput screening (HTS) campaign. A standard practice for biochemical assay development at GlaxoSmithKline (GSK) is screening our in-house PAINS set of 1012 compounds that have repeatedly interfered in previous HTS campaigns. Having successfully optimized three comparable biochemical assays, this compound set was screened to identify the susceptibility of the assays to PAINS of diverse chemotypes (
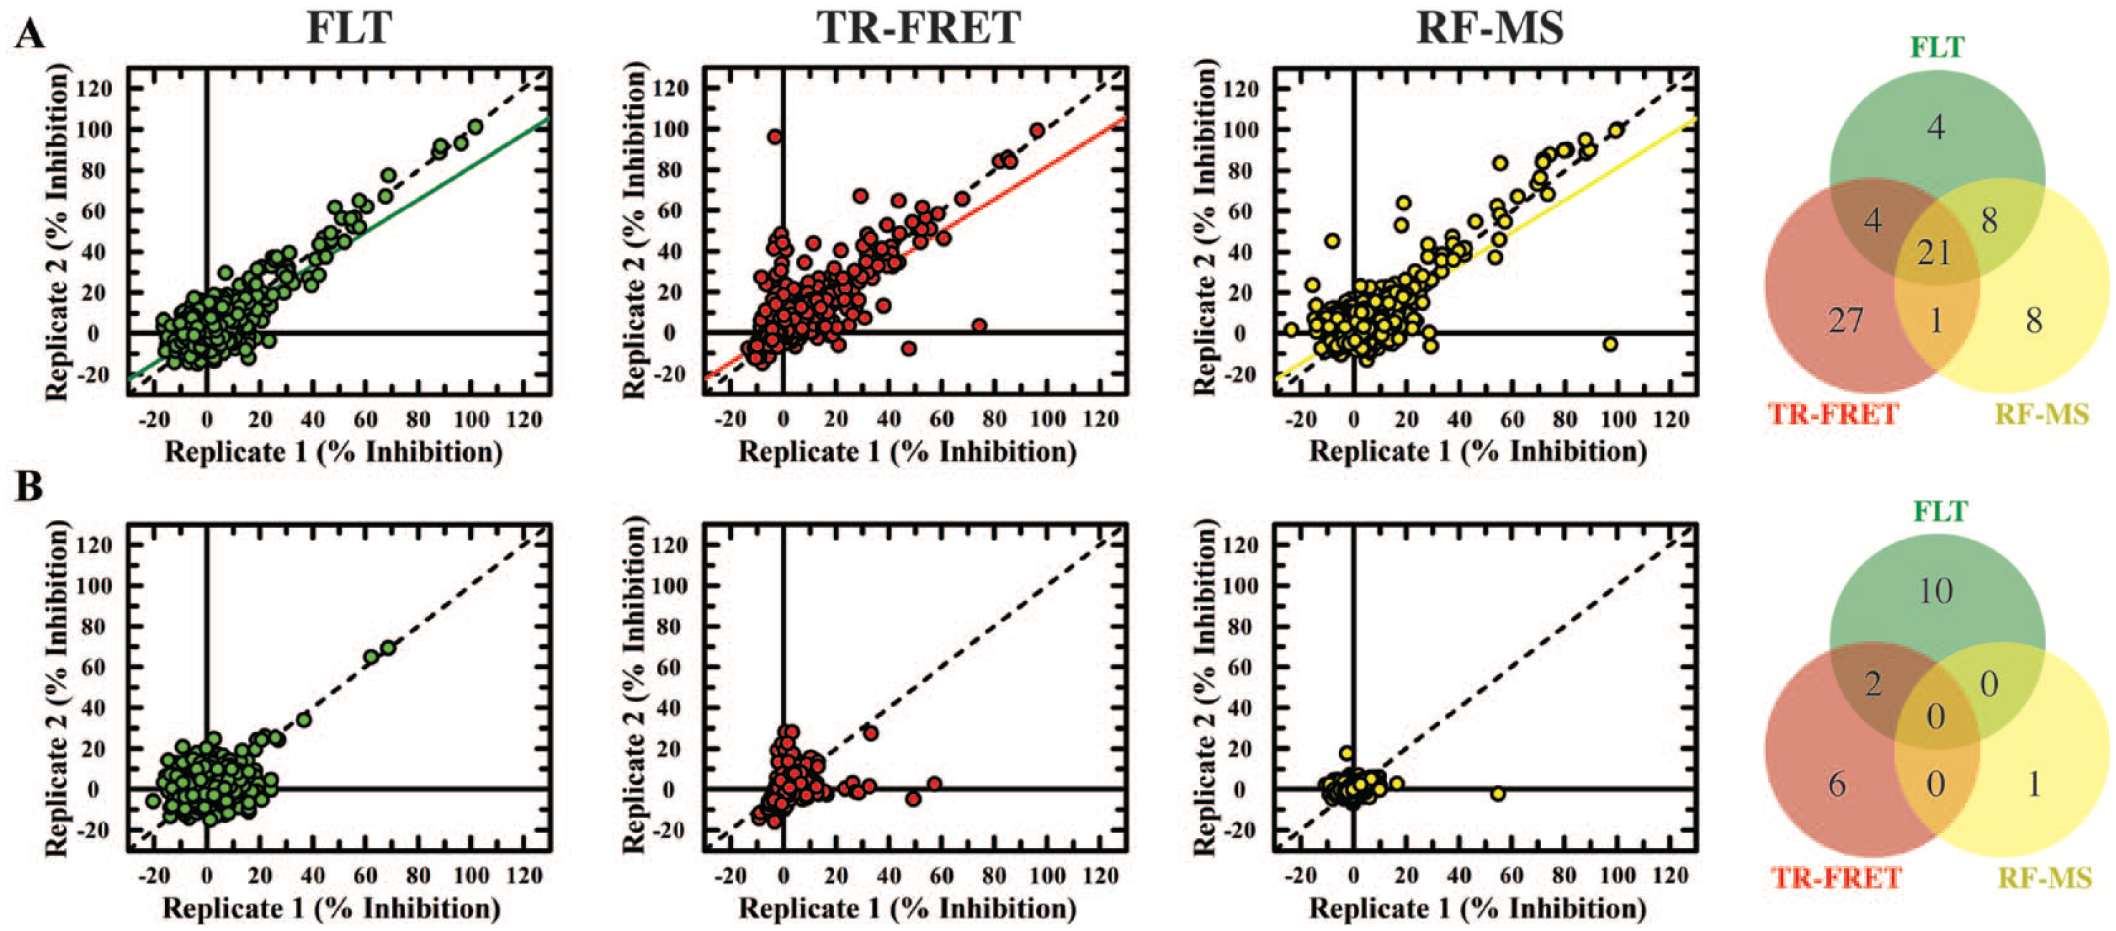
Pan-assay interference compounds (PAINS) compound screening with fluorescence lifetime technology (FLT), time-resolved fluorescence resonance energy transfer (TR-FRET), and RapidFire mass spectroscopy (RF-MS). Plots of correlated duplicate percentage inhibition responses and a Venn diagram showing overlapping hits are shown for (
To further differentiate between PAINS that interfere with the detection technology being used from those that interfere with the enzymatic activity of TYK2, PAINS compounds were added to the screening microplates only after uninhibited completion of TYK2-mediated peptide phosphorylation. This approach reduced the hit rate for all three detection technologies, revealing that the vast majority of assay interference observed from our in-house PAINS set was as a result of undesirable, target-based mechanisms rather than direct disruption of the detection methodologies. As expected, RF-MS was shown to be the least prone to technology-mediated interference (
Kinase-Focused Compound Screening, and Correcting Compound Autofluorescence Using FLT
Having characterized the susceptibility of both TYK2 and the three detection methodologies to PAINS, the assays were further validated by screening target class–specific small-molecule collections, which comprised the published protein kinase inhibitor sets 1 and 222,23 (PKIS1 and PKIS2; 872 compounds) and an extended internal pan-active kinase compound set (KCS; 5689 compounds). The result of PKIS screening revealed that more TYK2 hit compounds were identified using TR-FRET as opposed to the equivalent FLT or RF-MS assays (
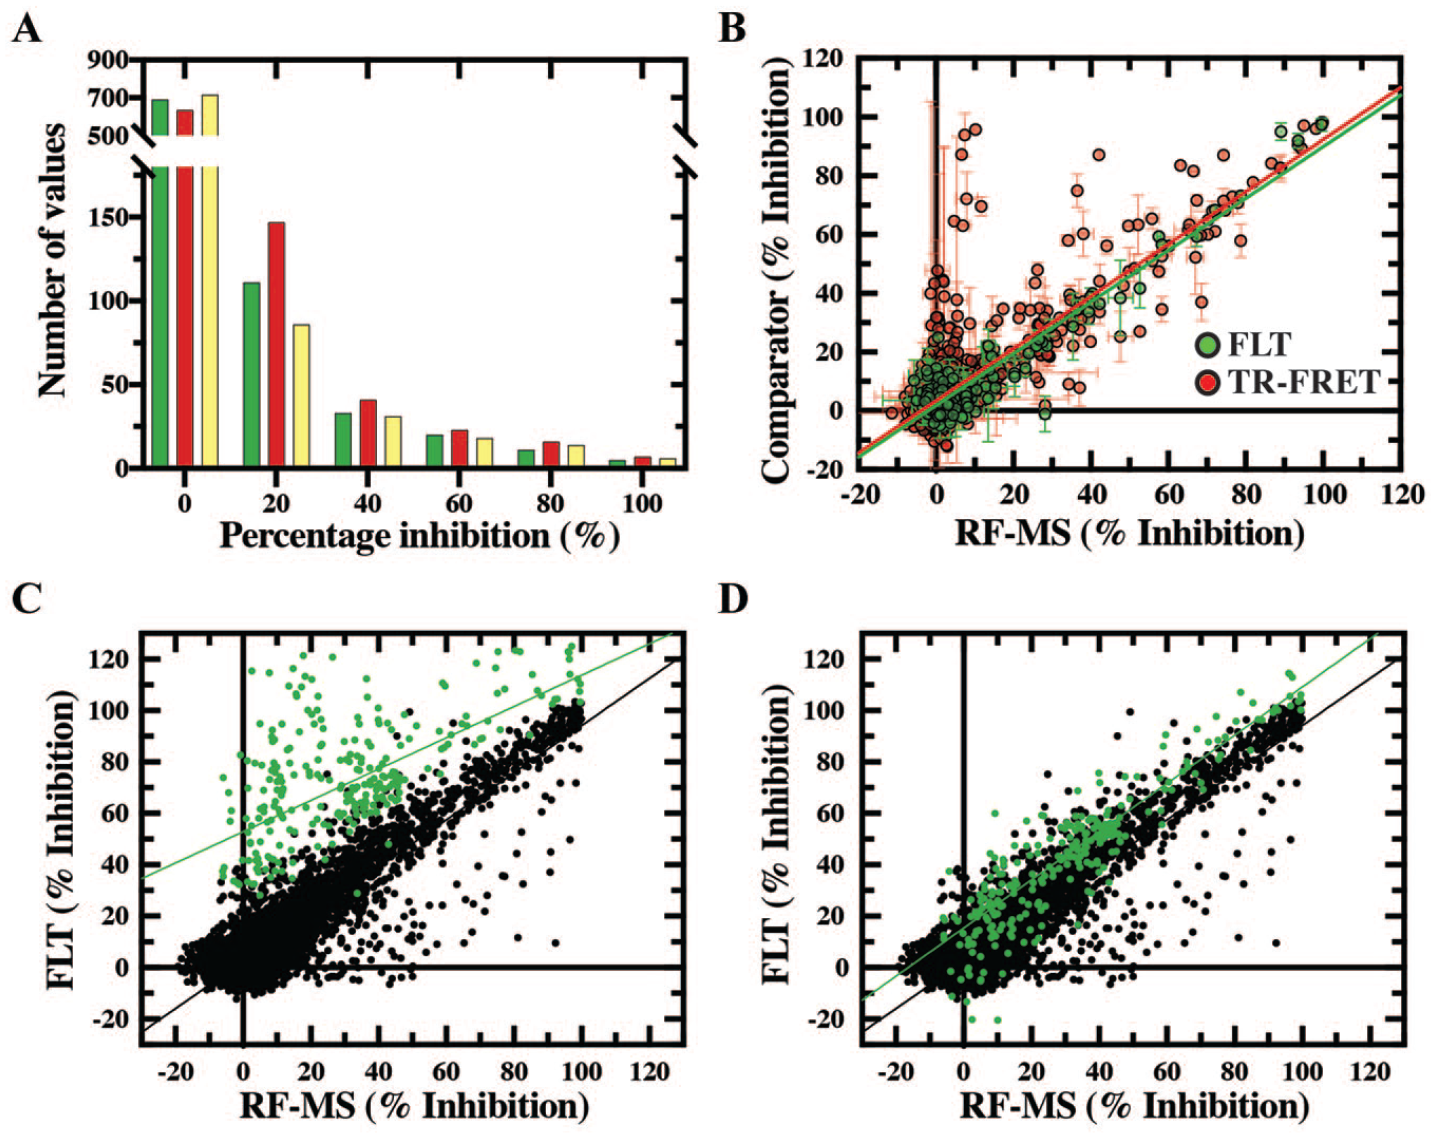
Protein kinase inhibitor set (PKIS) and kinase compound set (KCS) screening with fluorescence lifetime technology (FLT), time-resolved fluorescence resonance energy transfer (TR-FRET), and RapidFire mass spectroscopy (RF-MS). (
Analysis of the initial data generated from screening the KCS found a large proportion of measured inhibition values for FLT that did not correlate with those generated with RF-MS (
Reducing the False-Positive Rate in Primary Screening
To establish the hit detection capabilities of each biochemical assay, a non–target class diversity set (9708 compounds) representative of broad chemotypes found within the GSK HTS small-molecule collection was screened. Compounds identified as active in both replicates within a technology demonstrated a high degree of comparability, resulting in correlation coefficient values greater than 0.95 for all three assay formats (
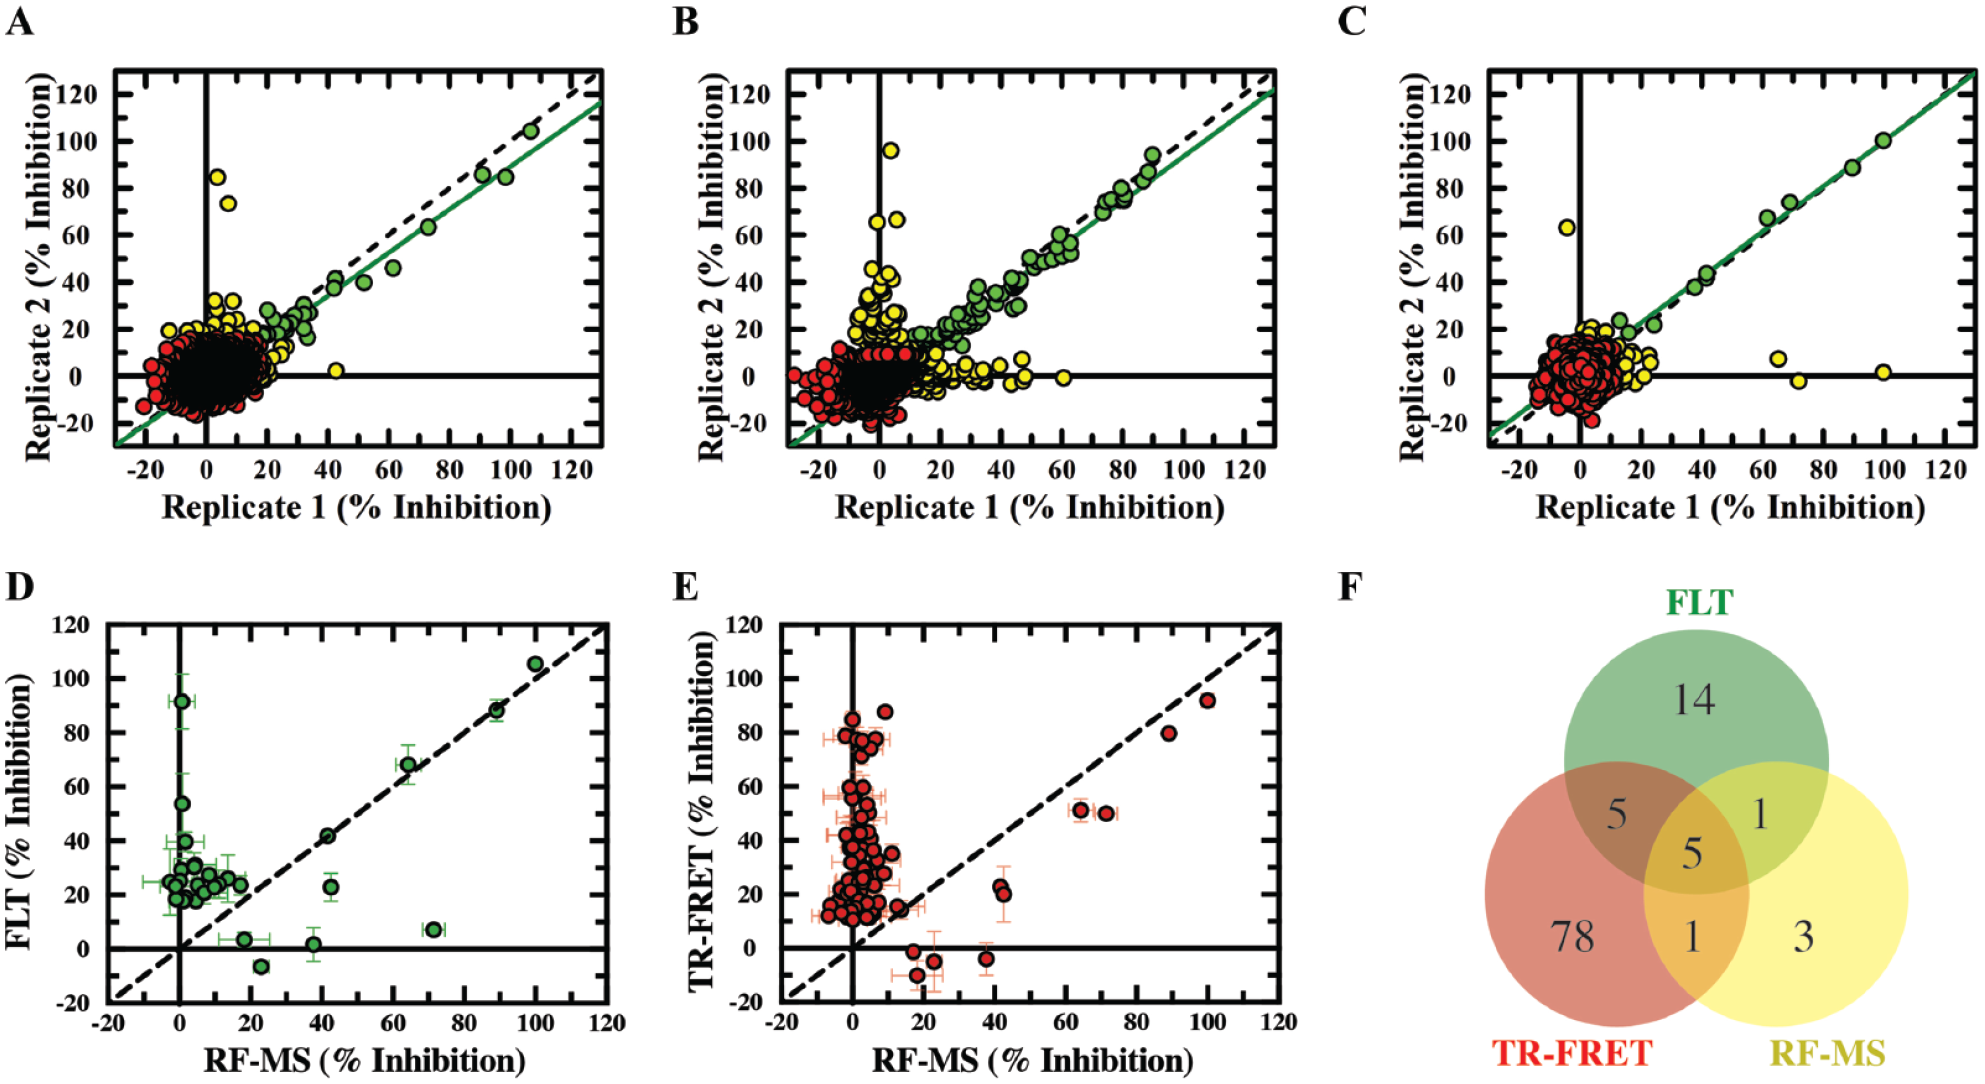
Diversity compound screening against TYK2 biochemical activity monitored using either FLT, TR-FRET or RF-MS detection technologies. 9708 chemically diverse compounds were screened using the three biochemical assays. (
To further investigate the additional compounds identified as TYK2 inhibitors using the FLT (
The few remaining false positives in the FLT assay are not likely to be attributed to compound autofluorescence, because the methodology outlined previously had been applied to mitigate this interference. The donor and acceptor channels of the TR-FRET false-positive hits were analyzed to identify any compound-related quenching or fluorescence. Of the TR-FRET false positives, only 3.7% and 12.8% had higher and lower donor intensities (respectively) than expected, with one hit showing both donor and acceptor increasing effects (
Concentration–Response Screening Confirms That FLT Reduces the False Positives in Primary Screening
Following completion of single-concentration screening, the hits from all three assay formats were collated, leading to selection of 952 compounds for further study by concentration–response screening. The compound pIC50 values observed for TYK2 using the FLT assay correlated well with the corresponding values measured using RF-MS (
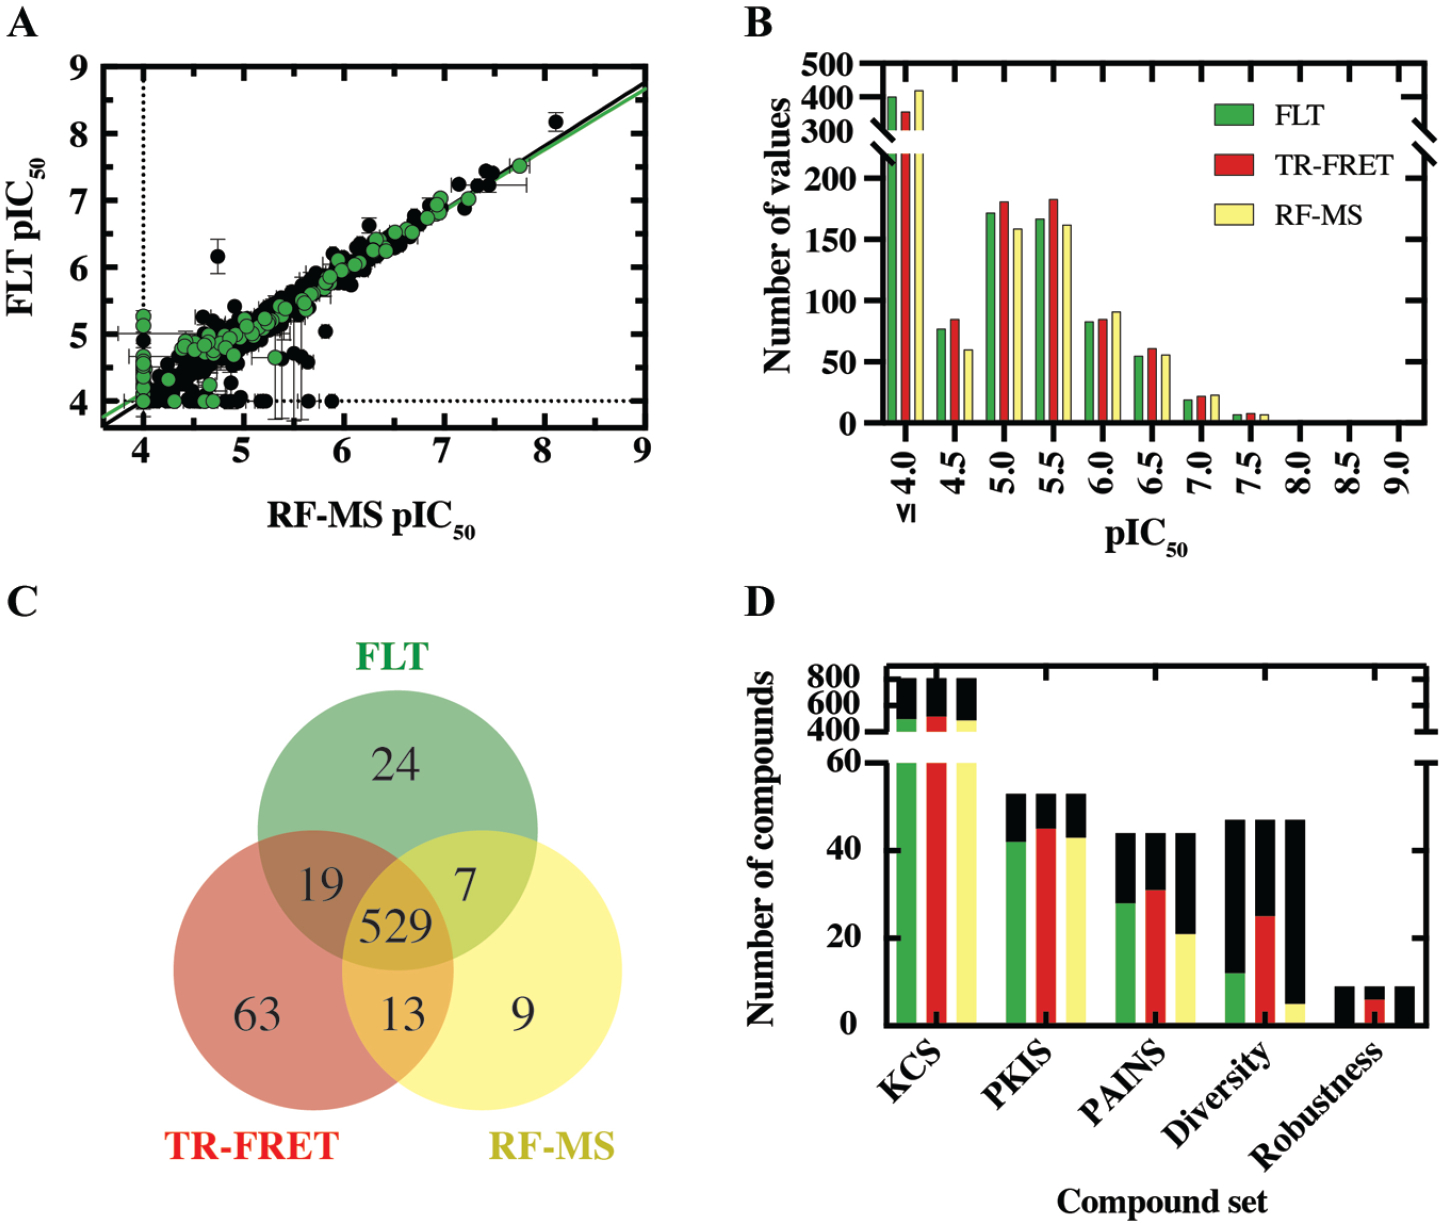
Conformational dose–response screening with fluorescence lifetime technology (FLT), time-resolved fluorescence resonance energy transfer (TR-FRET), and RapidFire mass spectroscopy (RF-MS). 952 compounds were screened in duplicate across multiple concentrations to generate dose–response curves and extract pIC50 (negative log of the half-maximum inhibitory concentration) values. (
Overall, more hits were confirmed as inhibitors when monitoring kinase activity using TR-FRET, while the compounds lacking a corresponding potency for TYK2 in the RF-MS assay were of low potency (4 < pIC50 < 5.5;
TPCA1 Inhibits IL12 Signaling through the TYK2–STAT4 Pathway
TYK2 hit compounds identified from the diversity, PKIS, and KCS libraries (
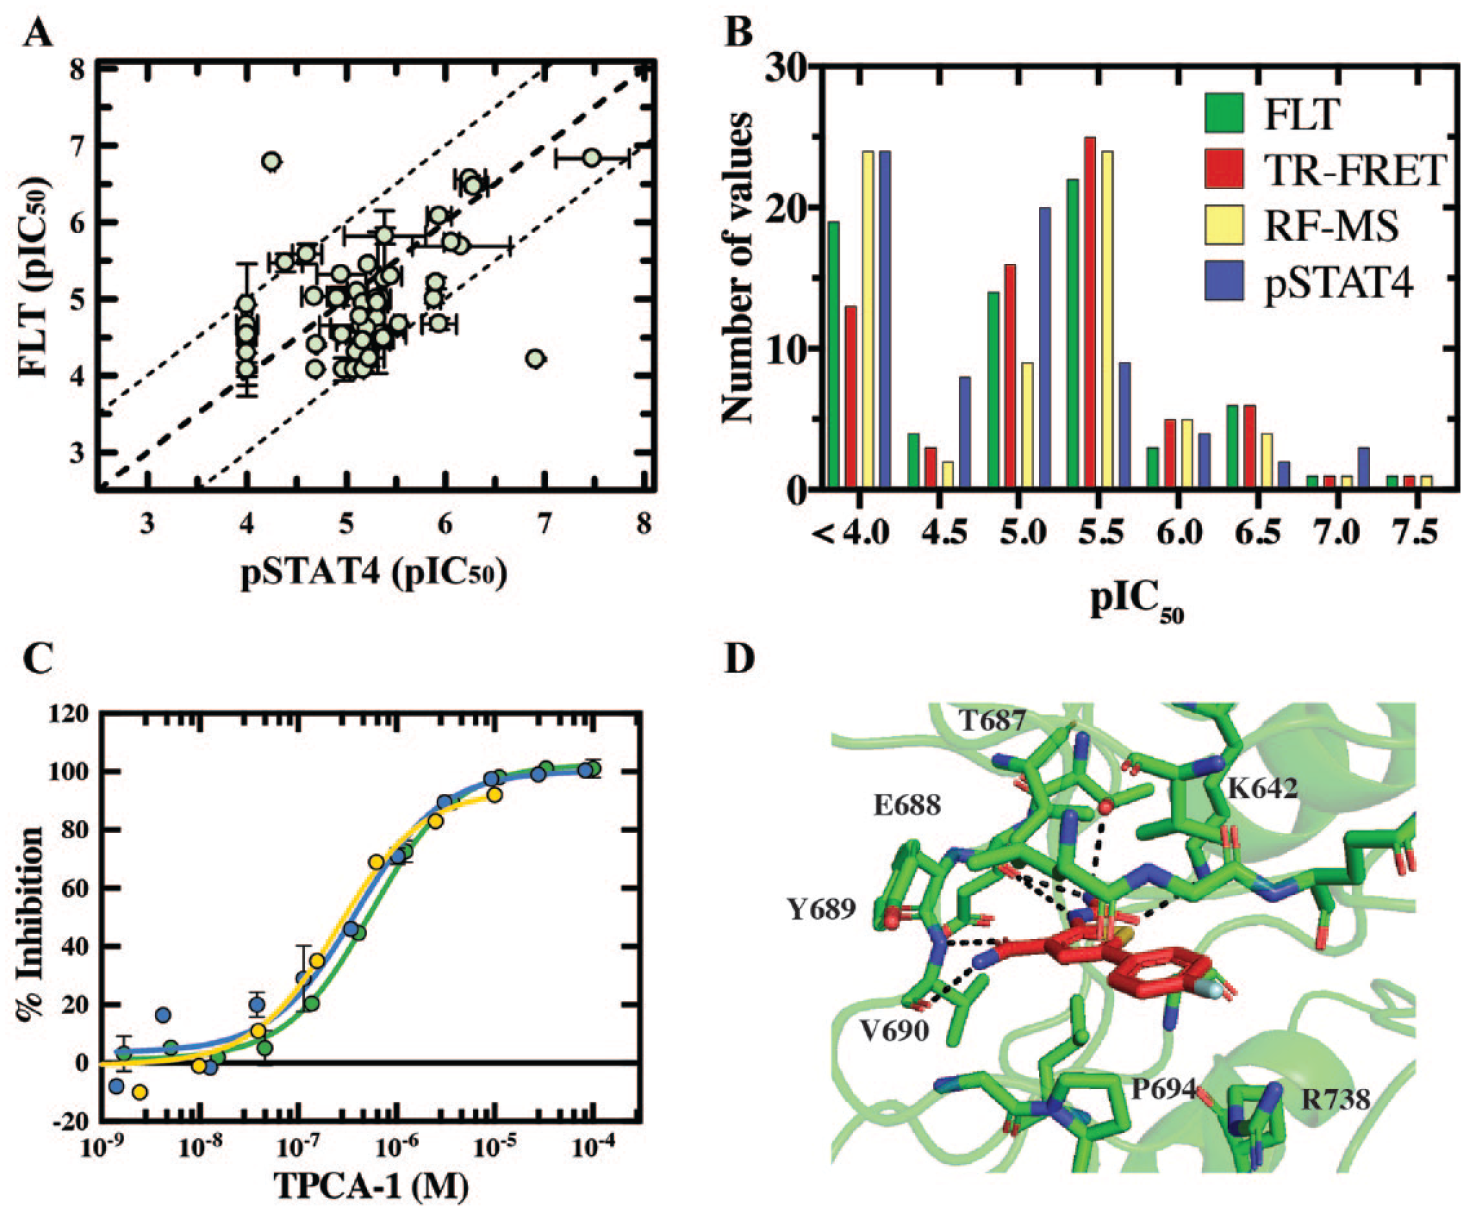
Validation of TPCA1 as an inhibitor of interleukin 12–tyrosine kinase 2–signal transducer and activator of transcription 4 (IL12–TYK2–STAT4) signaling. 70 compounds from the kinase compound set (KCS), protein kinase inhibitor set (PKIS), and diversity compound set were screened using the phospho-STAT4 (pSTAT4) phenotypic assay. (
A previously characterized inhibitor of the Ser/Thr IκB kinase-β (IKKβ), TPCA1, was one of the apparent TYK2 inhibitors originally identified from screening the PKIS2 set. The data presented in
Figure 6C
demonstrate that the potency of this compound for TYK2, measured initially in the FLT, TR-FRET, and RF-MS assays, was translated into the cellular environment with a pIC50 value of 6.4 determined when monitoring inhibition of STAT4 phosphorylation. To further confirm that TPCA1 was interacting in the intracellular environment with full-length TYK2, a NanoBRET (Promega, Madison, WI) target engagement assay was developed. TPCA1 inhibited binding of the proprietary NanoBRET tracer to TYK2 with a pIC50 value of 6.6 (
Discussion
This study describes the use of FLT as an alternative primary screening technology to more established inhibitor identification methodologies: RF-MS and TR-FRET. The FLT assay was highly reproducible and robust, matching or exceeding the performance of the orthogonal kinase assays developed using TR-FRET and RF-MS detection methodologies. Critically, the three TYK2 assays used conditions that were identical or similar, allowing for an equal evaluation of the relative benefits and drawbacks of each biochemical approach.
When devising this comparative study, we screened compounds with an ATP concentration equivalent to physiological levels (2 mM), which is far in excess of the TYK2Km, ATP values observed in this study and those previously reported. 25 By screening with saturating ATP concentrations as opposed to concentrations equivalent to the TYK2Km, ATP, the measured potency of ATP-competitive molecules is decreased by approximately one pIC50 unit.26,27 The limitation of configuring primary screening assays at a saturating concentration of substrate is the bias toward the identification of inhibitors with covalent, noncompetitive, or uncompetitive modes of action and the enrichment of subsequent hits with highly potent substrate-competitive molecules. Given that TYK2 is a well-validated and established drug discovery target with inhibitors in clinical trials28,29 and that the primary aim of this study was to provide a comparison in the hit-finding performance of the three comparator detection technologies, the decision was taken to proceed with assays configured with saturating concentrations of ATP. By screening with saturating ATP, the proportion of false-positive hits identified increased, further showcasing the capacity of FLT to identify true active compounds relative to TR-FRET configurations and correct for those that are falsely positive. Finally, screening with physiological ATP concentrations provided a more direct comparison with the cellular phospho-STAT4 and NanoBRET target engagement assays.
PAINS compounds and their misleading effects on a wide array of commonly used assay technologies remain a major reason for decreasing confidence in the output of chemical diversity screens. PAINS molecules can be subdivided into compounds that affect the readout of the technology and those that nonspecifically interfere with the target of interest. 7 The permissible hit rates we observed from screening our in-house PAINS compound library validated that all three TYK2 assays had been fully optimized to minimize the effects of any interferences, reducing the observed hit rates to lower than the GSK-derived threshold. The application of a modified screening approach, which sought to disentangle the mechanisms of the PAINS molecules, confirmed that the majority of the interference hits were due to compound-induced, nontractable TYK2 mechanisms, rather than undesirable modulation of the detection methodologies. This is unsurprising, given that the PAINS compound set was largely compiled of detection methodology frequent “hitters”: small molecules that are regularly identified from GSK high-throughput screens when using a specific assay technology, regardless of the target. Of the nonspecific TYK2 actives, many were identified as REDOX cyclers, which in the presence of reducing agents produce hydrogen peroxide that alters the chemistry of key catalytic residues. 30
Following identification of apparent inhibitors of TYK2 by screening the published kinase sets, a larger collection of small molecules was screened to assess whether the assay performance observations made on relatively small numbers of samples were consistent at higher throughput. Like the PKIS, the KCS comprises a high proportion of compounds with heterocyclic adenosine derivatives, a group that is known to be fluorescent at specific wavelengths. 31 This fluorescence interference was an ideal test to allow assessment of how readily each of the assays could consistently identify TYK2 inhibitors, while not overwhelming the identification of these true hits with false positives. In line with this test strategy, 5% of the KCS compounds were identified as fluorescent when screening with the TYK2 FLT assay. The lack of correlation of the TYK2 FLT results with the corresponding RF-MS values further confirmed that these compounds were due to fluorescence interference. Compound autofluorescence remains one of the major reasons that false positives arise in fluorescence intensity–based screening technologies. 32 The implementation of the appropriate detection and flagging protocols, however, as has been described herein for FLT, is an effective strategy for mitigating the effects of compound autofluorescence. The use of chi-square-based data-fitting assessment to identify likely autofluorescent compounds and the subsequent reanalysis of the decay curves, using a 10 ns delay, comprise a highly effective methodology that could be applied to many different fluorescence lifetime approaches. The caveat of the wider implementation of this methodology is the requirement for a reporter fluorophore with a lifetime that is sufficiently longer than the majority of the likely interfering fluorescent compounds.
When screening larger collections of compounds, including the KCS and chemical diversity libraries, it was evident that the use of TR-FRET to detect TYK2 activity yielded the highest hit rates of all three comparator detection technologies. In addition, the TYK2 TR-FRET assay had a considerably higher false-positive rate when compared to FLT, when using the RF-MS data as a true measure of TYK2 inhibition. Having established methodologies to both detect and correct autofluorescent interferences when using the FLT detection methodology, a further approach was developed using a nonparametric statistical process to qualify outliers of TR-FRET donor and acceptor fluorescence measurements. The majority (83%) of false positives, however, could not be attributed to fluorescence, absorbance, or quenching mechanisms. Further analysis of the chemotypes identified as TYK2 TR-FRET false positives revealed no problematic structures, substructures, or prevalent physiochemical properties that could potentially interfere with this detection methodology. It is possible that the added biochemical complexity of the TR-FRET assay, including the use of a large antibody, in addition to the incorporation of a lanthanide coordinated by a chelate (the requirements of antibody and europium), could lead to an increase in the number of false-positive compounds observed. It has been demonstrated that screening libraries contain compounds that are capable of perturbing antibody–phosphotyrosine interactions 33 or causing the disruption of europium chelates. The latter compound types, such as salicylates, 6 could contribute to the higher false-positive rates evident when using TR-FRET.
In contrast, fewer false-positive compounds were identified using FLT, again when comparing compound results to the corresponding RF-MS measurements, which was anticipated by the technological attributes that ensure that lifetime circumvents most known fluorescence interferences. 13 This simple FLT approach measures fluorescence decay at a single wavelength for a fluorophore that is fivefold smaller than Alexa Fluor 647, commonly used in TR-FRET assays. In addition, the FLT assay is much simpler than the TR-FRET equivalent, with no secondary binding events by bulky antibodies, allowing for continuous detection and kinetic readouts. Two requisites of the peptide, sufficient flexibility to allow dynamic quenching of the fluorophore and no addition of tyrosine or tryptophan residues that quench FLEX17 fluorescence, make it an ideal substrate for fluorescence lifetime assays. 19 In comparison to the high initial capital investment required to implement MS-based screening and the relatively high cost of lanthanide-conjugated reagents, FLT could represent a cost-effective screening technology that combines the speed and throughput of TR-FRET with the robustness of RF-MS, albeit with the requirement of a specialized plate reader.
While essential for uHTS, biochemical assays do not provide the breadth of information that can be gathered from cellular-based assays, such as permeability, macromolecule target engagement, and downstream phenotypic output. Furthermore, cellular assays, especially those using physiologically relevant cell types and monitoring well-characterized, disease-linked phenotypes, are rightly implemented as a filter of biochemical-derived hit compounds to ensure that only the most developable small molecules are optimized. To exploit these analyses and confirm that the hit compounds identified using the three comparator biochemical assays were inhibitors of full-length TYK2 in a cellular environment, two additional assays were incorporated into this study. These assays confirmed that the majority of the hit compounds identified using the comparator biochemical methodologies were inhibitors of TYK2 in an intracellular environment. These observations confirmed that each of the TYK2 biochemical assays had accurately and reproducibly identified novel small molecules that could be readily translated into a more physiologically relevant system. During this analysis, a compound identified as a TYK2 inhibitor when screening the PKIS2 compound library was shown to be TPCA1, a known inhibitor of IKKβ that attenuates collagen-induced arthritis and airway inflammation in mouse models.34,35 In addition to these observations, TPCA1 has been reported to inhibit STAT3 phosphorylation in hepatocytes following IL6 stimulation, 36 and to inhibit JAK2 during kinome-wide drug-profiling studies. 37 These observations suggest that TPCA1, as well as being an inhibitor of IKKβ, is also an antagonist of one or more of the JAK family of kinases. This is confirmed by the data presented herein, which demonstrate TPCA1 inhibition of TYK2 in all the assays used. Furthermore, structural biology studies carried out in parallel to this comparative analysis were able to crystallize the pseudokinase domain of TYK2 in complex with TPCA1. These data suggest that TPCA1 inhibition is mediated through interaction with the pseudokinase domain of TYK2. Further studies are required to better characterize this interaction and define the mode of action of TPCA1 inhibition of TYK2. This observation, however, provides another tool molecule to better understand these important pro-inflammatory pathways.
Supplemental Material
sj-pdf-1-jbx-10.1177_24725552211002472 – Supplemental material for Reducing False Positives through the Application of Fluorescence Lifetime Technology: A Comparative Study Using TYK2 Kinase as a Model System
Supplemental material, sj-pdf-1-jbx-10.1177_24725552211002472 for Reducing False Positives through the Application of Fluorescence Lifetime Technology: A Comparative Study Using TYK2 Kinase as a Model System by Luke A. Greenhough, Gabriella Clarke, Alexander N. Phillipou, Faith Mazani, Bhumika Karamshi, Sam Rowe, Paul Rowland, Cassie Messenger, Carl P. Haslam, Ryan P. Bingham and Peter D. Craggs in SLAS Discovery
Footnotes
Acknowledgements
We thank Uliana Bashtanova, John Moore, Klaus Doering, Paul Wylie, and Wayne Bowen at TTP Labtech for FLT instrument guidance and assistance in devising autofluorescence recovery protocols. We thank Colin Dunsmore and Graham Cotton at Almac for configuration of the FLT assay and providing FLEX17-labeled peptide. We’d like to thank the aforementioned for what was a successful three-way collaboration, which involved many useful and insightful discussions, as well as a continual FLT learning experience. In addition, we thank Paul Bamborough and Armelle Tolson for assistance in chemical substructure analysis. We thank Daniel Thomas, Jon Hutchinson, John Evans, Anthony Dossang, and Archie Argyrou for their honest assessment of the data and also their collective insights into enzymology, assay technologies, and screening strategies. Dave Powell, Stuart Baddeley, Mike Hann, and Chun-wa Chung all provided initial support, which helped initiate this project. Finally, we’d like to thank Melanie Leveridge, who provided scientific input, continued support, and encouragement throughout the course of this project.
Supplemental material is available online with this article.
Declaration of Conflicting Interests
The authors declared the following potential conflicts of interest with respect to the research, authorship, and/or publication of this article: All authors are employed by GlaxoSmithKline, and their research and authorship of this article were completed within the scope of their employment with GlaxoSmithKline.
Funding
The authors received no financial support for the research, authorship, and/or publication of this article.
References
Supplementary Material
Please find the following supplemental material available below.
For Open Access articles published under a Creative Commons License, all supplemental material carries the same license as the article it is associated with.
For non-Open Access articles published, all supplemental material carries a non-exclusive license, and permission requests for re-use of supplemental material or any part of supplemental material shall be sent directly to the copyright owner as specified in the copyright notice associated with the article.