
Abstract
A high-throughput RapidFire mass spectrometry assay is described for the JMJD2 family of Fe2+, O2, and α-ketoglutarate-dependent histone lysine demethylases. The assay employs a short amino acid peptide substrate, corresponding to the first 15 amino acid residues of histone H3, but mutated at two positions to increase assay sensitivity. The assay monitors the direct formation of the dimethylated-Lys9 product from the trimethylated-Lys9 peptide substrate. Monitoring the formation of the monomethylated and des-methylated peptide products is also possible. The assay was validated using known inhibitors of the histone lysine demethylases, including 2,4-pyridinedicarboxylic acid and an α-ketoglutarate analogue. With a sampling rate of 7 s per well, the RapidFire technology permitted the single-concentration screening of 101 226 compounds against JMJD2C in 10 days using two instruments, typically giving Z′ values of 0.75 to 0.85. Several compounds were identified of the 8-hydroxyquinoline chemotype, a known series of inhibitors of the Lys9-specific histone demethylases. The peptide also functions as a substrate for JMJD2A, JMJD2D, and JMJD2E, thus enabling the development of assays for all 3 enzymes to monitor progress in compound selectivity. The assay represents the first report of a RapidFire mass spectrometry assay for an epigenetics target.
Keywords
Introduction
Methylation of the ε-amino group of several lysine residues on histone tails is an important mechanism by which cells can control gene expression. 1 The first histone lysine methyltransferase was identified in 2000, 2 followed by the discovery of the first histone lysine demethylase (LSD1) four years later. 3 LSD1 is a flavin-dependent enzyme capable of demethylating mono- and dimethylated lysine residues but not the trimethylated form. Demethylases acting on trimethylated lysine residues emerged with the discovery of a second, mechanistically distinct class of histone lysine demethylases in 2006.4–6 These enzymes catalyze the Fe2+, O2, and α-ketoglutarate-dependent demethylation of methylated lysines to generate lysines with one fewer methyl group, formaldehyde, carbon dioxide, and succinate. They are known as the Jumonji, JmjC domain– containing histone lysine demethylases (HKDMs).
Several histone-tail lysine residues are known to be methylated, including K4, K9, K27, K36, and K79 of histone H3 and K20 of histone H4.1,7 Methylation at the H3K4, H3K36, and H3K79 sites has been linked to transcriptional activation, whereas methylation at H3K9 and H3K27 has been associated with transcriptional repression. More than 30 enzymes of the HKDM family have been identified in humans, and the substrate specificity with respect to the target lysine has been determined for a large number of them. This has revealed that individual methylated lysine residues can be acted upon by multiple HKDMs; for instance, JMJD2A, JMJD2B, JMJD2C, JMJD2D, and JMJD2E are among a number of enzymes capable of demethylating H3K9, whereas JMJD3 and UTX demethylate H3K27. 7 In addition, some HKDMs can demethylate at more than one methylation site; for example, in addition to demethylating at the H3K9 site, JMJD2A, JMJD2B, and JMJD2C can demethylate H3K36. Unraveling the reasons underlying the redundancy in function and delineating the functional roles of these enzymes could be facilitated by the identification of selective tool molecules for use in cellular mechanistic assays to determine the effects of inhibition of enzymatic activity on global histone methylation, gene expression at specific genetic loci, and cell proliferation. Such molecules may also have therapeutic potential because the HKDMs have been associated with a number of human diseases, particularly cancer.1,7–9 JMJD2C was targeted in this work because a number of studies suggest that it may be an attractive anticancer target: JMJD2C has been shown to be overexpressed in esophageal squamous carcinoma, 10 and RNA interference of JMJD2C expression leads to a reduction in cell proliferation.6,11
Our primary aim was to develop a high-throughput assay for enzymes that demethylate H3K9 to monitor progression in compound potency and selectivity. Several assay platforms were considered, including two that have been published previously. The first is a fluorescent assay that couples the formation of the reaction product formaldehyde to formaldehyde dehydrogenase (FDH) in the presence of oxidized nicotinamide adenine dinucleotide (NAD+) to generate formate and reduced nicotinamide adenine dinucleotide (NADH).12–14 The assay provides a continuous kinetic readout of the reaction, and we have used it extensively during the assay development section of this work (see Results). A major limitation of the method, however, is interference by compounds that absorb strongly in the excitation wavelength region of NADH (λmax = 340 nm) and by autofluorescent compounds, resulting in high hit rates. For example, in a screen to identify inhibitors of JMJD2E using this assay, the hit rate was 10.7%, 92% of which were autofluorescent compounds. 12 Appropriate counterscreens are also necessary to determine which compounds inhibit the FDH-coupling enzyme. 12 The second assay is a high-throughput amplified luminescent proximity homogeneous assay (AlphaScreen), 15 with high sensitivity, allowing reduction in enzyme concentration and a lowering of the theoretical tight binding limit. However, this assay is also subject to compound interference, particularly by compounds that scavenge singlet oxygen.
Mass spectrometry (MS) offers a direct, label-free measure of enzymatic activity, free from the compound interference that accompanies optical-based methods, thus negating the need for deconvolution assays. Matrix-assisted laser desorption/ionization time-of-flight (MALDI-TOF) mass spectrometry assays have been developed for the HKDMs4,5,16–18 and have proved essential in confirming compound potencies obtained using both the FDH-coupled assay and the AlphaScreen assay.12,13 However, MALDI-TOF and other mass spectrometry assays have, until recently, been limited by throughput. The RapidFire mass spectrometry (RF-MS) technology comprises a high-throughput robotic sample preparation and injection system coupled to a triple quadrupole electrospray mass spectrometer. By replacing the high-performance liquid chromatography (HPLC) unit of the traditional liquid chromatography/mass spectrometry (LC/MS) system with a low-volume sample clean-up cartridge, it is able to operate at high flow rates, enabling the processing of quenched samples directly from a 384-well plate at a rate of approximately 6 to 8 s per well, enabling analysis of a 384-well plate to be completed in 45 min. Encouraged by several recent successful screens using RF-MS technology,19–24 we investigated the feasibility of using the platform for assay of the HKDMs. Here, we describe the development of an RF-MS assay for HKDMs that demethylate H3K9 and its successful implementation to screen 101 226 compounds against JMJD2C.
Materials and Methods
Materials
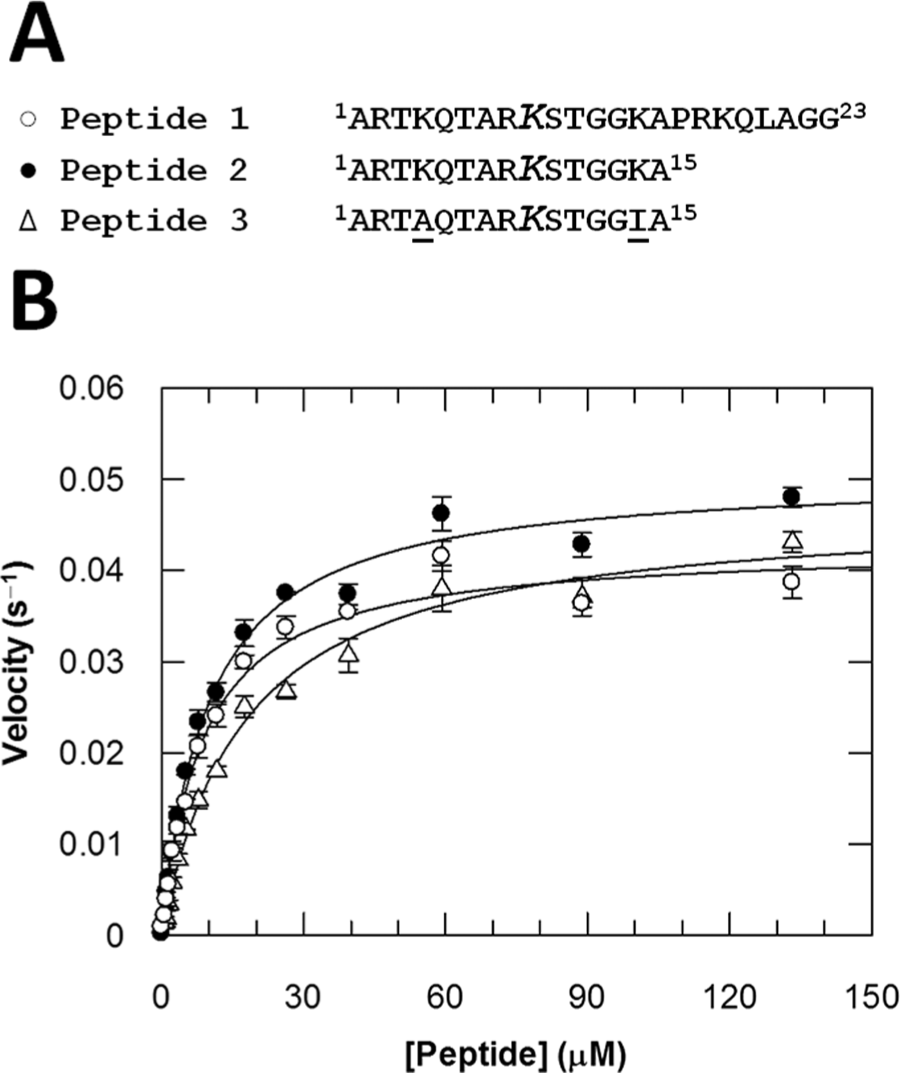
Ascorbic acid, α-ketoglutarate, DMSO, NAD+, NADH, 4-(2-hydroxyethyl)-1-piperazineethanesulfonic acid (Hepes), Pseudomonas putida formaldehyde dehydrogenase (FDH), bovine serum albumin (BSA), lysozyme, and tris(2-carboxyethyl)phosphine (TCEP) were purchased from Sigma-Aldrich (Gillingham, Dorset, UK). Trifluoroacetic acid (TFA) was from Applied Biosystems (Warrington, UK). Acetonitrile and ammonium iron (II) sulfate were purchased from Fisher Scientific (Loughborough, UK). Peptides 1–3 ( Fig. 1A ) were synthesized and HPLC-purified to >95% purity by Cambridge Research Biochemicals (Cambridge, UK).
(
Expression and purification of JMJD2C
Expression
Plasmid pNIC-JMJD2C (1–366) was kindly provided by Stanley Ng (Structural Genomics Consortium, University of Oxford, Oxford, UK). This plasmid expresses the catalytic domain of JMJD2C (residues 1–366) with an N-terminal hexahistidine tag and a TEV protease cleavage site from a T7 promoter. A single colony of freshly transformed Escherichia coli BL21 (DE3) Star/pNIC-JMJD2C (1–366) was used to inoculate 100 mL of Luria-Bertani medium supplemented with 1% (w/v) glucose and 50 µg/mL kanamycin in a 500-mL nonbaffled Erlenmeyer flask. After 6 h of growth at 37 °C, 20 mL of this cell culture was used to inoculate 1 L of the same media in a 2.5-L ultra flask. After 16 h of growth at 30 °C for 16 h with shaking at 200 rpm, 700 mL of this culture was used to inoculate a 50-L Pierre Guerin bioreactor (Pierre Guerin Technologies, Mauze, France) containing 35 L of modified terrific broth 25 supplemented with trace element solution, 26 1% (v/v) glycerol, and 50 µg/mL kanamycin. The vessel was run at 0.2 bar pressure, 1 air gas volume flow per unit of liquid volume per minute, and 200 rpm. The bacterial cells were grown at 37 °C to an A600 nm of 1.0, the temperature was then cooled to 18 °C, and protein expression was induced by the addition of 0.2 mM isopropyl-β-D-thiogalactoside. Cells were harvested 20 h postinduction by centrifugation, and the cell pellet was stored at −80 °C.
Purification
All operations were carried out at 4 °C. The cell pellet was thawed and suspended in buffer A (50 mM Tris [pH 8.0], 150 mM NaCl, 5% (v/v) glycerol, 0.5 mM TCEP, and 1 µL of protease inhibitor cocktail set III [no. 539134; Calbiochem, San Diego, CA] per mL of cell suspension) supplemented with 0.4 U/mL Benzonase (Novagen, Darmstadt, Germany) and 0.1 mg/mL lysozyme. The cells were disrupted by sonication, and cell debris was removed by centrifugation at 25 000 g for 90 min. The supernatant was applied to a 5-mL HisTrap HP column (no. 17-5248-02; GE Healthcare, Piscataway, NJ) equilibrated with buffer A. The column was washed with 10 column volumes of buffer A containing 50 mM imidazole, and bound protein was eluted with buffer A containing 300 mM imidazole. TEV protease was then added to the eluted protein (15 µg TEV protease per mg of JMJD2C) and dialyzed for 16 h against buffer B (50 mM Tris [pH 8.1], 150 mM NaCl, and 5% (v/v) glycerol). The cleaved JMJD2C was then loaded onto a Superdex 200 prep grade column (no. 17-1071-01; GE Healthcare) equilibrated with buffer B. Fractions containing JMJD2C were pooled. The integrity of the protein was confirmed by mass spectrometry and the identity confirmed by peptide mass fingerprinting (data not shown). Protein concentration was determined using the Coomassie plus (Bradford) protein assay kit (no. 23236; Pierce, Rockford, IL).
The expression and purification of the catalytic domains of JMJD2A (residues 1–359), JMJD2D (residues 1–366), and JMJD2E (residues 1–336) used in this study will be reported elsewhere.
Preparation of compound screening plates
For single-concentration screening, 100 nL of 1-mM compound solutions in DMSO were transferred into 384-well V base assay plates (Greiner Bio-one, Stonehouse, UK) to give a final screening concentration of 10 µM (10 µL final assay volume; see below). For dose–response curves, threefold serial dilutions were prepared from 10-mM compound solutions in DMSO across 384-well HiBase plates (Greiner Bio-one). Aliquots (100 nL) of dilution series were transferred into 384-well V base assay plates (Greiner Bio-one), giving a concentration range between 100 µM and 1.7 nM. Columns 6 and 18 of the assay plates were reserved for the high and low controls, respectively. The high controls had 100 nL of DMSO but no compound, whereas the low controls also had 100 nL of DMSO, but the enzyme was acid inactivated by pretreatment with 0.5% (v/v) TFA. Compounds and DMSO were dispensed using the Echo acoustic dispenser (Labcyte, Sunnyvale, CA).
Assays
FDH coupled assay
The formaldehyde generated in the demethylase reaction was coupled to FDH, resulting in the oxidation of formaldehyde to formate as NAD+ was reduced to NADH. The reactions were monitored by following an increase in the fluorescence intensity (λex = 340 nm, λem = 440 nm) associated with the formation of NADH under initial rate conditions. Assays contained 50 mM Hepes (pH 7.0), 50 µM ascorbate, 50 µM Fe2+, 1 mM NAD+, and 0.004 U/µL FDH, with variable concentrations of α-ketoglutarate, trimethylated peptide substrate, and HKDM enzyme, in a total reaction volume of 15 µL. Enzymatic rates in arbitrary fluorescence units per unit time were converted to quantity of product formed per unit time using an NADH standard curve. Measurements were made using a Tecan Safire2 instrument (Tecan Group Ltd, Seestrasse, Switzerland).
RapidFire mass spectrometry assay
In this assay, disappearance of the trimethylated substrate (peptide 3, Fig. 1A ) and formation of the dimethylated product were both monitored by mass spectrometry. The following conditions were used during assay development: 50 mM Hepes (pH 7.0), 1% (v/v) DMSO, 50 µM ascorbate, 50 µM Fe2+, and 0.25 mg/mL BSA, with variable concentrations of α-ketoglutarate and peptide 3 and 0.5 µM JMJD2C in a total reaction volume of 10 µL. The reactions were quenched by addition of 30 µL of 0.5% (w/v) TFA.
High-throughput assays were performed by initially dispensing 5 µL of a 2× solution containing 1 µM JMJD2C and 0.5 mg/mL BSA in 50 mM Hepes (pH 7.0) into the 384-well plates containing 100 nL compound. Plates were allowed to incubate for 10 min at ambient temperature before reactions were initiated by the addition of 5 µL of a 2× substrate solution containing 100 µM ascorbate, 100 µM Fe2+, 20 µM α-ketoglutarate, and 20 µM peptide 3 also in 50 mM Hepes (pH 7.0). Plates were centrifuged at 1000 rpm for 1 min and the reactions incubated at room temperature for 10 min before being quenched by the addition of 30 µL of a 0.5% (w/v) TFA solution. For the enzyme-inactivated control wells in column 18, the TFA solution was dispensed prior to addition of the enzyme solution. Plates were centrifuged at 1000 rpm for 5 min before analysis. All solutions were dispensed using a Multidrop Combi dispenser (Thermo Fisher Scientific, Waltham, MA).
Assay plates were transferred onto a high-throughput RapidFire200 integrated autosampler/solid-phase extraction (SPE) system (Agilent Technologies, Wakefield, MA) coupled to an API4000 triple quadrupole mass spectrometer (Applied Biosystems, Concord, Ontario, Canada). Solvent A was water containing 0.01% (v/v) TFA and 0.09% (v/v) formic acid. Solvent B was acetonitrile/water (8:2, v/v) containing 0.01% (v/v) TFA and 0.09% (v/v) formic acid. Samples were aspirated under vacuum directly from 384-well assay plates for 500 ms. The sample was then loaded onto a C4 solid-phase extraction cartridge to remove nonvolatile buffer salts, using solvent A at a flow rate of 1.5 mL/min for 3 s. The retained analytes were eluted to the mass spectrometer by washing the cartridge with solvent B at 1.25 mL/min for 3 s. The cartridge was reequilibrated with solvent A for 500 ms at 1.5 mL/min. The entire sampling cycle was approximately 7 s per well, enabling analysis of a 384-well plate in approximately 45 min.
Peptide 3 was found to be resistant to collisionally induced fragmentation (data not shown), but a quasi–multiple-reaction monitoring (MRM) 27 method was developed in which collision energy was applied to eliminate contaminants with near or isobaric masses that may contribute to background signal. The mass spectrometer was operated in positive electrospray MRM mode, and transitions (Q1/Q3) for each species were as follows: K9Me3, 765.9/765.9; K9Me2, 758.9/758.9; and K9Me1, 751.9/751.9. A dwell time of 50 ms was used for all of the MRM transitions. The mass spectrometer was operated with a spray voltage of 4500 V and at a source temperature of 650 °C. The peaks detected by mass spectrometry were approximately 1.2 s wide at half-height, and they were integrated and processed using the RapidFire peak integration software.
Data analysis
Steady-state enzyme kinetics
Data were fitted to the nonlinear curve-fitting programs of GraFit version 5.0.12 (Erithacus Software Ltd, Surrey, UK). Saturation curves were fitted to equation (1):

where Vmax is the maximum velocity (apparent kcat), [S] is the substrate concentration, and Km is the Michaelis constant. Errors for kcat/Km were propagated as described by Skoog and West 28 for indeterminate errors.
Dose–response curves were fitted to equation (2):
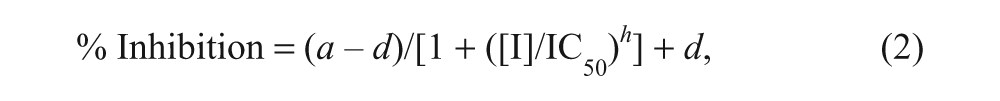
where a is the uninhibited value, d is the fully inhibited value, [I] is the inhibitor concentration, IC50 is [I] that gives ½ × (a – d), and h is the Hill slope.
Screening
Screening data were analyzed using the Activity Base Suite (ID Business Solutions Ltd, Surrey, UK). The extent of enzymatic turnover of the trimethylated substrate to dimethylated product was expressed as percent conversion, as shown in equation (3):

where Me2 and Me3 represent the integrated peak areas of the di- and trimethylated peptides. Single-concentration screening data were expressed as percent inhibition. For dose–response screening, data were fitted to equation (2). Similarity clustering of compounds was performed using the Daylight Fingerprints Software Package (Daylight Chemical Information Systems, Inc., Aliso Viejo, CA).
Results
Peptide optimization for RF-MS
To successfully monitor a reaction using the RF-MS technology, it is essential to identify a substrate and/or product with favorable electrospray MS detection properties and physical properties that allow dynamic interaction with the reverse-phase C4 sample clean-up cartridge, without compromising the enzyme substrate specificity. The inherently basic nature of the histone H3 sequence was potentially problematic since basic residues increase the number of charged states that are observed in the MS, thereby diluting the signal and resulting in decreased sensitivity while also disfavoring retention on the C4 cartridge. To produce a peptide substrate for the assay with optimal detection properties, the native H3 sequence was modified by truncation and amino acid substitution to decrease basicity while retaining functionality. Peptide 1 represented the starting point for peptide optimization and corresponded to the first 23 amino acids of histone H3, including trimethylated K9, and contained 7 basic residues (see Fig. 1A ). Truncation to peptide 2 decreased the overall molecular weight of the peptide and reduced the number of basic residues to 5. The basicity was further reduced in peptide 3 through substitution of K4 and K14 by alanine and isoleucine, respectively. The kinetic parameters of peptide 3 for JMJD2C were compared to peptides 1 and 2 in the FDH-coupled assay using a saturating concentration of α-ketoglutarate ( Fig. 1B and Table 1 ). Since peptide 3 was found to have similar apparent kcat and Km values to those of the native H3 sequence, assay development was progressed with the optimized peptide.
Steady-State Kinetic Parameters for Human Histone Lysine Demethylases (HKDMs) a
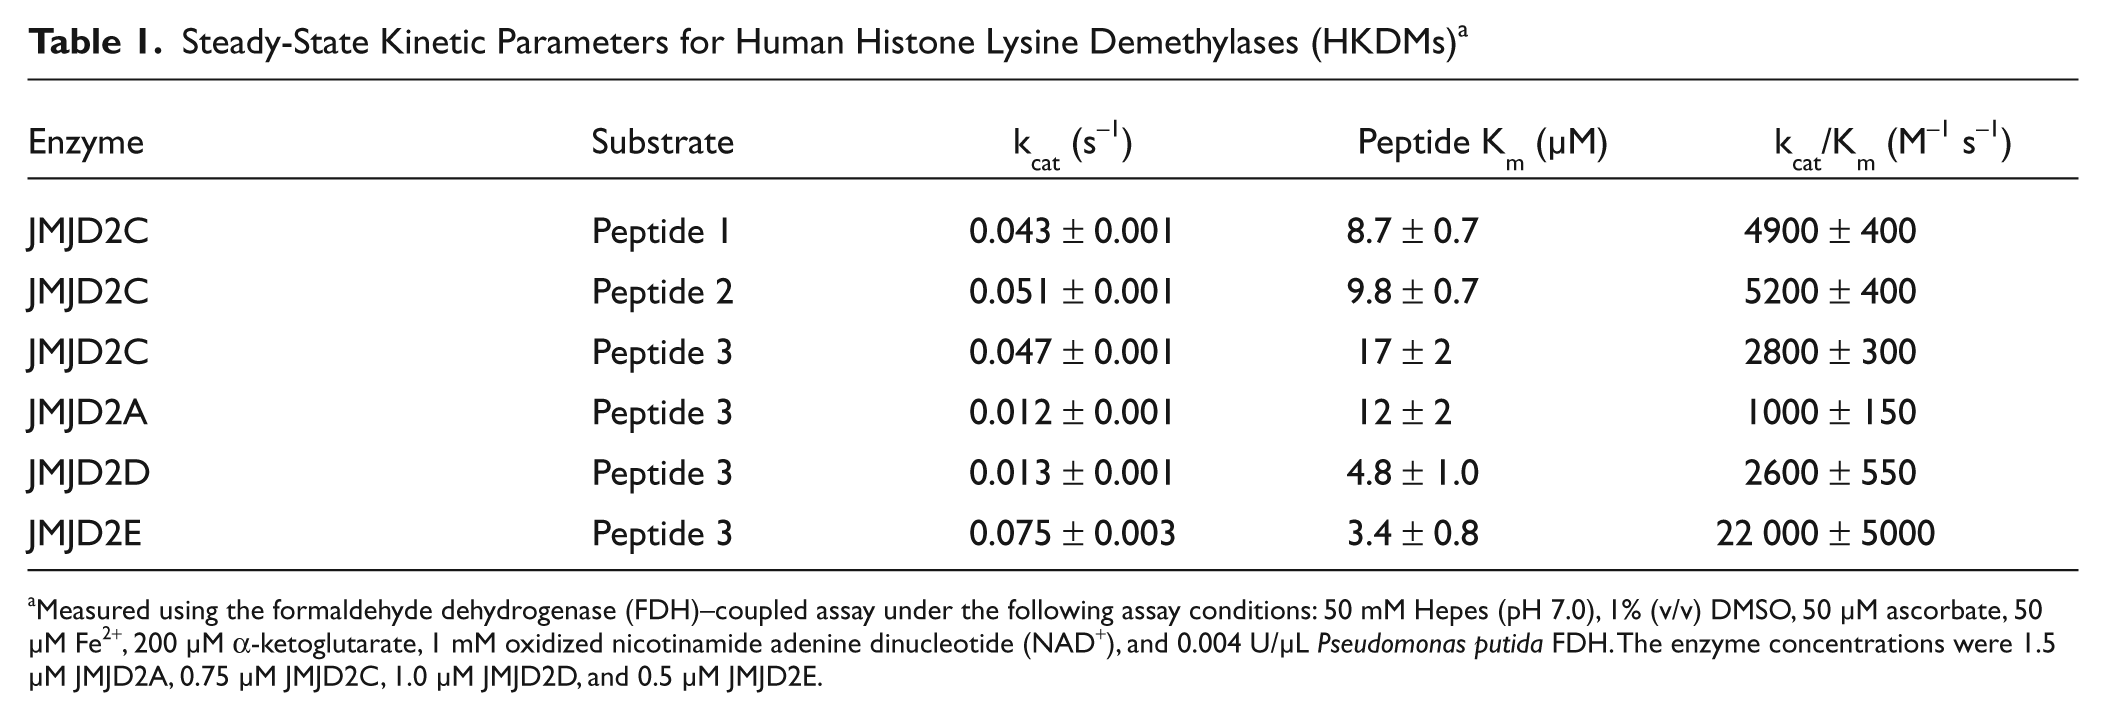
Measured using the formaldehyde dehydrogenase (FDH)–coupled assay under the following assay conditions: 50 mM Hepes (pH 7.0), 1% (v/v) DMSO, 50 µM ascorbate, 50 µM Fe2+, 200 µM α-ketoglutarate, 1 mM oxidized nicotinamide adenine dinucleotide (NAD+), and 0.004 U/µL Pseudomonas putida FDH. The enzyme concentrations were 1.5 µM JMJD2A, 0.75 µM JMJD2C, 1.0 µM JMJD2D, and 0.5 µM JMJD2E.
The kinetic parameters for JMJD2A, JMJD2D, and JMJD2E were also measured using peptide 3 to determine its suitability as a generic peptide substrate for histone H3K9-specific demethylases ( Table 1 ). Peptide 3 was confirmed as a substrate for these enzymes, as demonstrated by the low micromolar apparent Km values and apparent kcat values that are within 6-fold of each other. Sakurai et al. 13 have reported an apparent kcat value of 0.08 s−1 and apparent Km value for a peptide substrate of 21 µM for JMJD2E. The apparent kcat value compares favorably with the value that we have measured (0.075 s−1; Table 1 ). Although the apparent peptide Km value is 6-fold higher than the value we have measured for the same enzyme, we note that the peptide substrate used by Sakurai et al. is only 8 residues long compared to 15 residues for peptide 3. Couture et al. 29 have reported kcat values of 0.015 min−1 and 0.074 min−1 for JMJD2A and JMJD2D, respectively. These values are 48-fold and 11-fold lower than the values that we have measured. They also reported peptide Km values of 71 µM and 49 µM for JMJD2A and JMJD2D, respectively, 29 which are 6-fold and 11-fold higher than the values that we have measured. Several factors could contribute to the substantial differences in the kinetic constants measured by the two groups, including differences in (1) enzyme constructs, (2) enzyme purification procedures that could result in variable purity and specific activity, (3) assay reagents and assay buffer composition, and (4) the timeframe for measuring initial rates. The latter point may be a significant source of the observed differences since our initial rate measurements were made within the first 5 min of reaction, whereas those of Couture et al. 29 were made for 9 to 30 min.
RF-MS assay development
Having established that the kinetic parameters for JMJD2C were not significantly affected by the peptide modifications and that peptide 3 served as a good substrate for the other JMJD2 enzymes, the suitability of peptide 3 for RF-MS was evaluated. A standard curve for peptide 3 showed a linear dependence of the integrated peak area on the concentration of peptide 3, up to 100 µM (data not shown). This range was found to be adequate to permit the measurement of kinetic parameters for JMJD2C using the RF-MS assay.
The kinetic parameters for JMJD2C were determined using both the FDH-coupled assay and the RF-MS assay under initial rate conditions. Figure 2 shows the saturation curves for each substrate, obtained using a saturating or near-saturating concentration of the co-substrate in the RF-MS assay. The kinetic parameters obtained in the two assays are in good agreement, as tabulated in Table 2 .
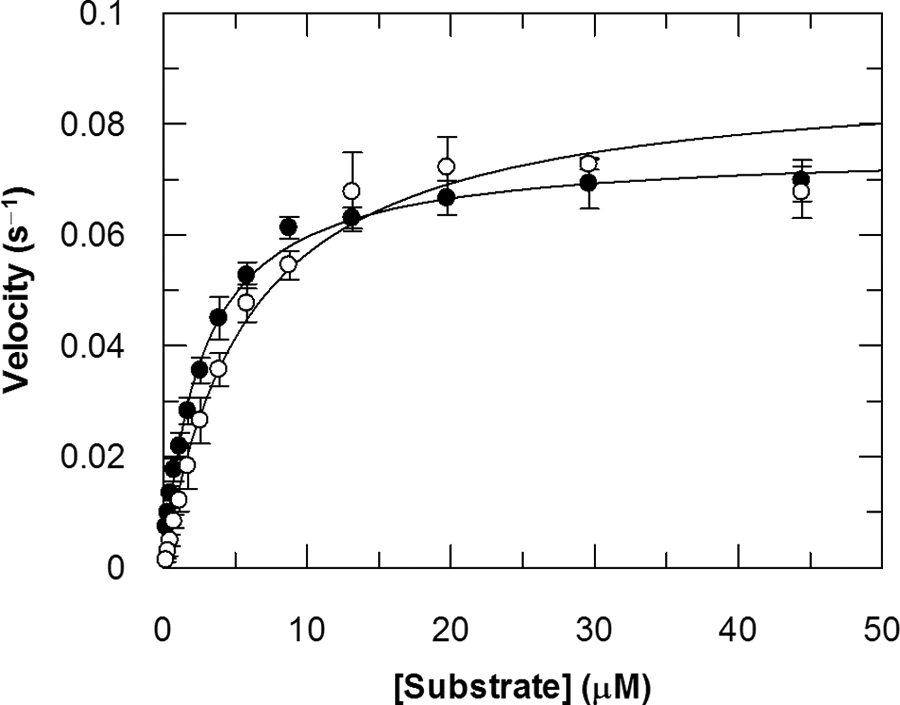
Saturation curves for peptide 3 (open circles) and α-ketoglutarate (closed circles) using the RapidFire mass spectrometry (RF-MS) assay. The assay conditions and fitted kinetic parameters are tabulated in Table 2 .
Steady-State Kinetic Parameters for Human JMJD2C a
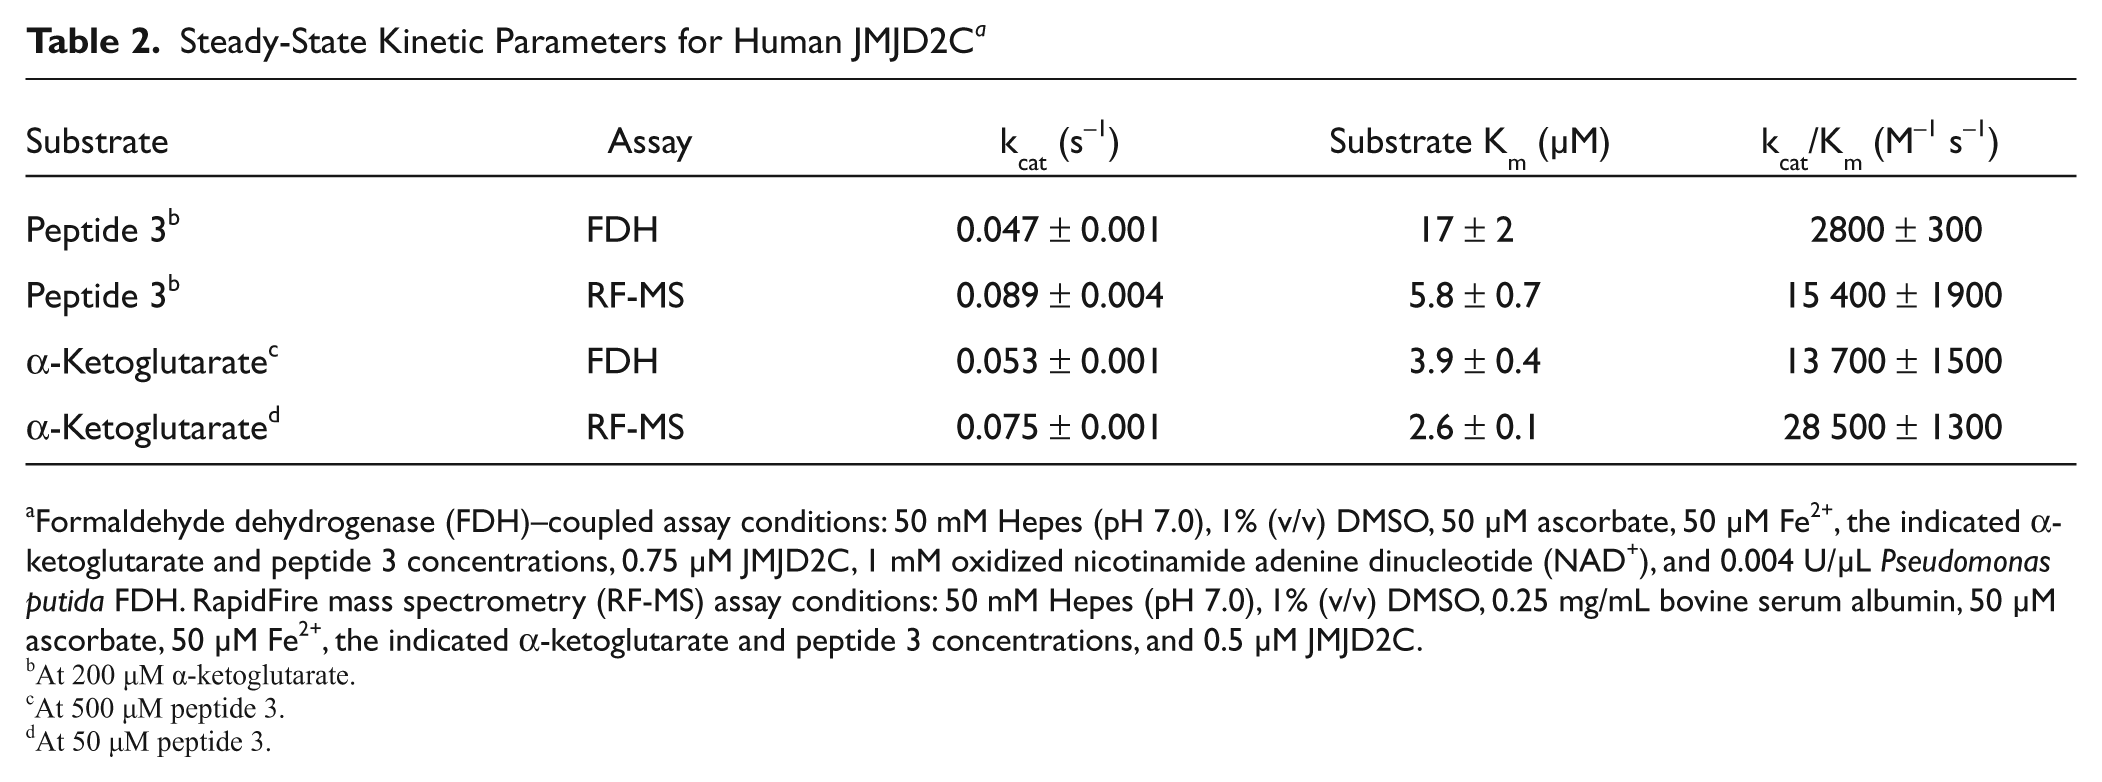
Formaldehyde dehydrogenase (FDH)–coupled assay conditions: 50 mM Hepes (pH 7.0), 1% (v/v) DMSO, 50 µM ascorbate, 50 µM Fe2+, the indicated α-ketoglutarate and peptide 3 concentrations, 0.75 µM JMJD2C, 1 mM oxidized nicotinamide adenine dinucleotide (NAD+), and 0.004 U/µL Pseudomonas putida FDH. RapidFire mass spectrometry (RF-MS) assay conditions: 50 mM Hepes (pH 7.0), 1% (v/v) DMSO, 0.25 mg/mL bovine serum albumin, 50 µM ascorbate, 50 µM Fe2+, the indicated α-ketoglutarate and peptide 3 concentrations, and 0.5 µM JMJD2C.
At 200 µM α-ketoglutarate.
At 500 µM peptide 3.
At 50 µM peptide 3.
Based on the kinetic parameters measured in the two assays, concentrations of 10 µM were employed for both substrates in the screening protocol, selected to be at, or near to, the apparent Km values to maximize the chances of identifying inhibitors acting at both the α-ketoglutarate and peptide binding sites. Figure 3 is a time course illustrating formation of the dimethylated product at a rate that precisely mirrors depletion of the trimethylated substrate. The reaction is initially linear, gradually slowing as the substrates are depleted. During the screen, reactions were allowed to proceed for 10 min before quenching with acid, representing approximately 35% substrate depletion and a signal-to-background ratio of 4.5. Although very little monomethylated product accumulates under these conditions, formation of the monomethylated product was readily observed in independent experiments using excess α-ketoglutarate and a higher enzyme concentration (data not shown).
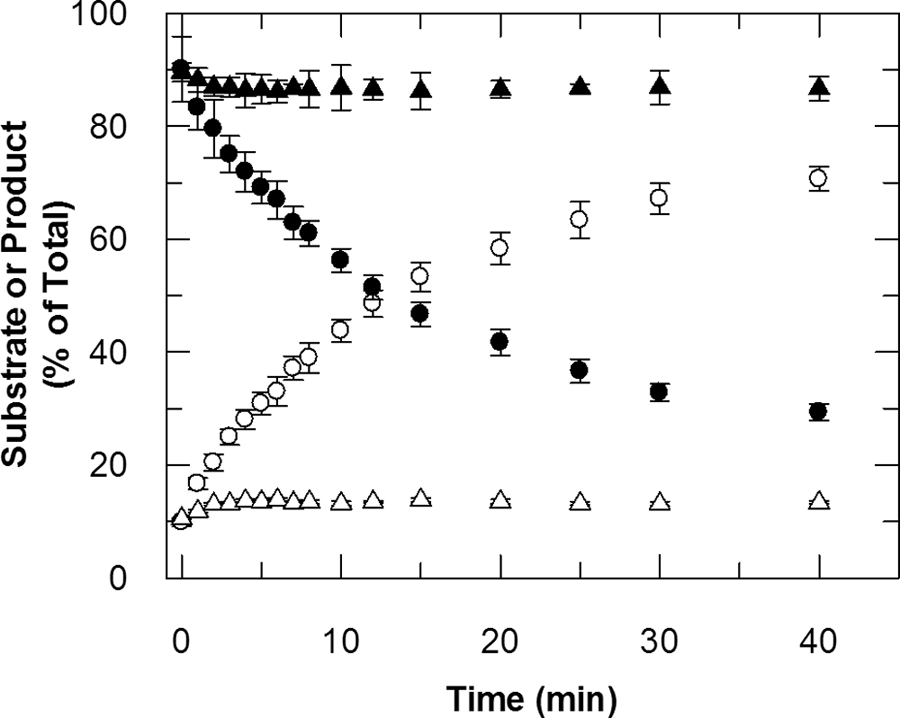
Time course illustrating turnover of peptide 3 under screening assay conditions (see Materials and Methods section). The integrated peak areas of the dimethylated (open symbols) and trimethylated (closed symbols) forms of peptide 3 are expressed as % of total. Circles had 0.5 µM JMJD2C, whereas the triangles had no enzyme.
To validate the above conditions, dose–response curves were generated for 2,4-pyridinedicarboxylic acid (compound
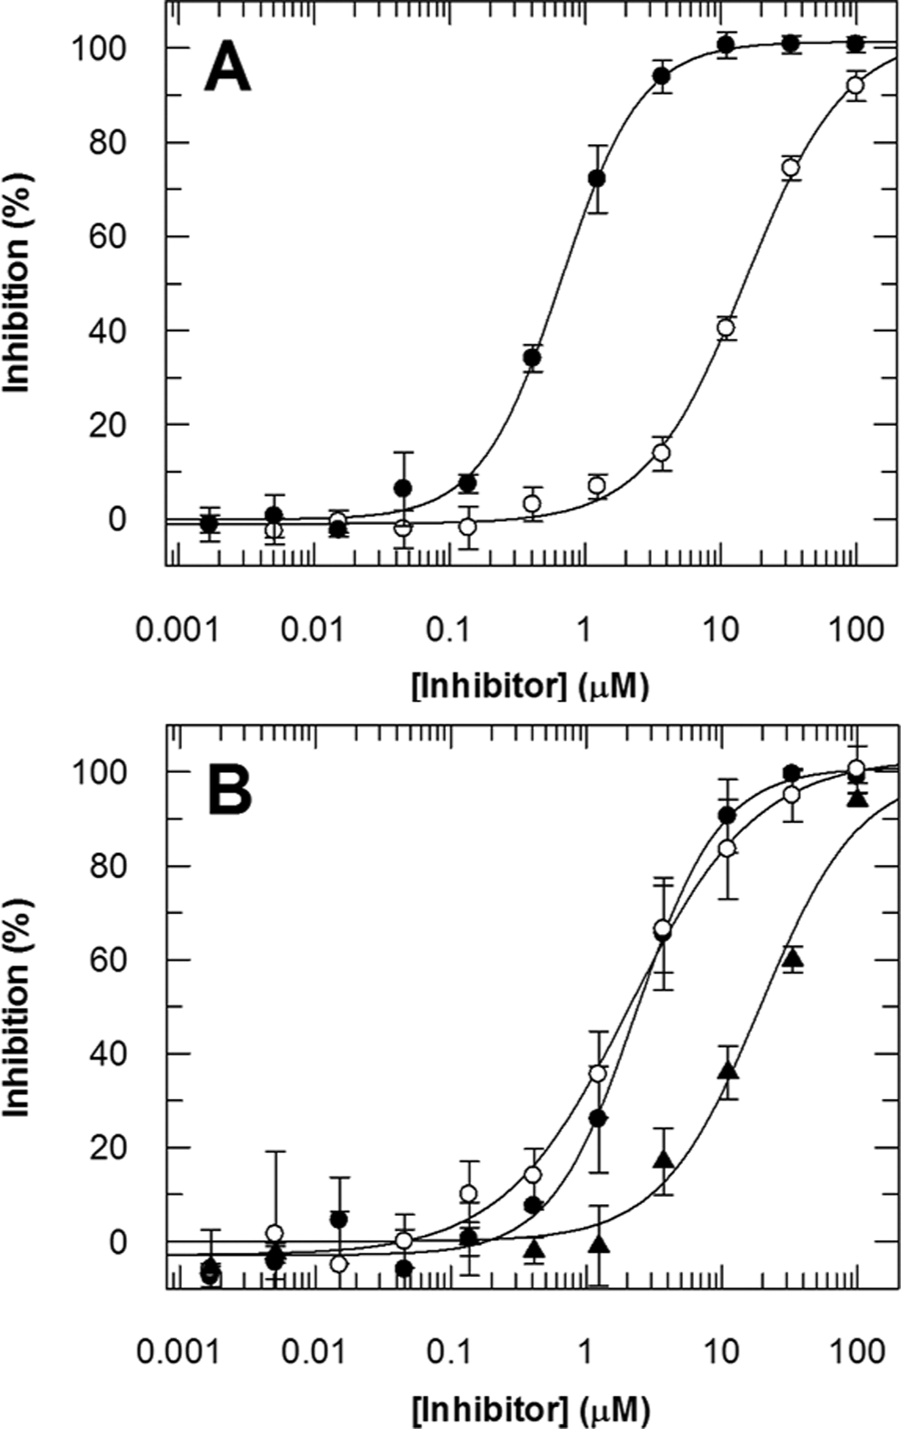
Dose–response curves for compounds
Inhibition of JMJD2C by Compounds
Before proceeding with the screen, the robustness and reproducibility of the assay for single-concentration screening was examined in duplicate using a diverse set of 1000 compounds, each at 10 µM, spread over four 384-well plates. The assay gave a mean Z′ of 0.84.
31
The uninhibited and enzyme-inactivated controls clustered densely at 0% and 100% inhibition, respectively (open circles and triangles,
Screening campaign
A total of 101 226 compounds were screened at a single concentration of 10 µM over 10 days, using two RF-MS instruments. This equates to approximately 6500 compounds per instrument per day. The mean Z′ for the screen was 0.81 (
Fig. 5A
), and the mean robust hit rate was 1.7%. Dose–response curves for compounds
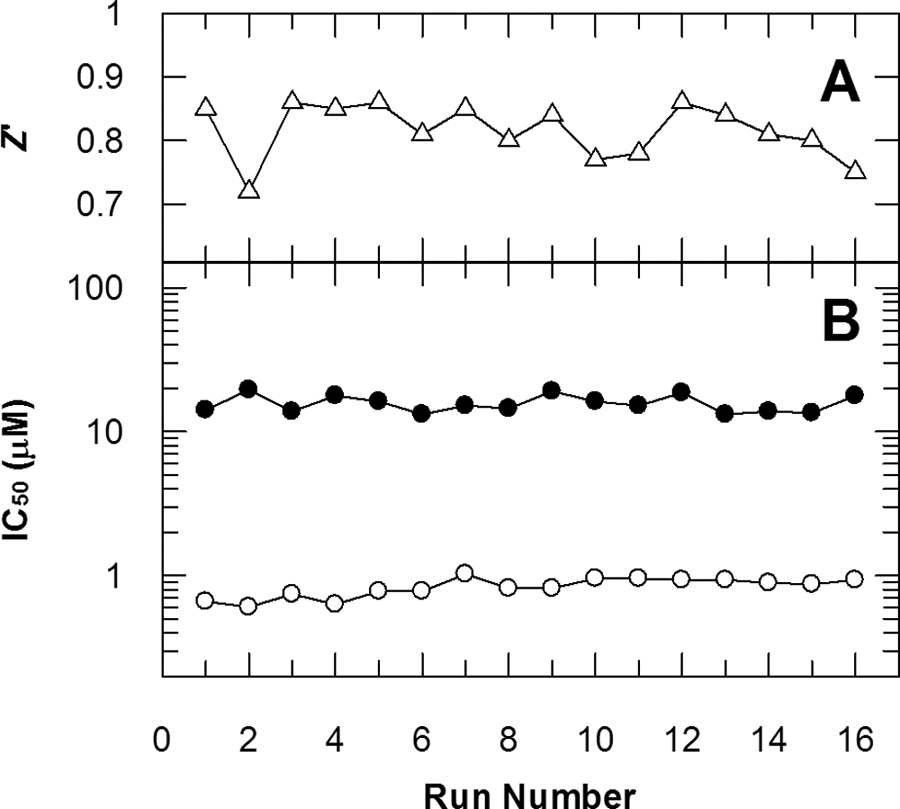
RapidFire mass spectrometry (RF-MS) assay performance during the JMJD2C screen. Plots illustrating the stability in the Z′ value (
From the 101 226 compounds, 2028 were selected for 11-point dose–response curve analysis using 100 µM as the top concentration. Compounds were selected on the basis that they showed greater than 40% inhibition or between 20% and 40% inhibition combined with a molecular weight below 400 and clogP values less than 4. Of the 2028 compounds tested, 1126 showed dose–response curves that could be fitted to equation (2), yielding IC50 values less than 100 µM. The distribution was as follows: 995 compounds showed IC50 values between 10 and 100 µM, 103 compounds between 5 and 10 µM, 24 compounds between 1 and 5 µM, and 4 compounds less than 1 µM. Similarity clustering of the 131 compounds with IC50 values less than 10 µM led to a total of 101 representative compounds spanning 15 chemical clusters and 86 singletons.
Discussion
Here we describe the development and successful implementation of an MS-based assay for the HKDMs, demonstrating the potential of the RF-MS technology for high-throughput screening (HTS) of epigenetic targets. The assay employs mass spectrometry to monitor the 14-Da mass change that accompanies lysine demethylation and uses small peptide substrates that can be readily engineered to improve detection sensitivity without compromising enzyme substrate functionality. The ability to directly measure signals associated with both the substrate and reaction product permits normalization of assay data, thereby minimizing errors that would otherwise result from variability in sampling volume and analyte ionization. This resulted in the production of a highly robust and reproducible assay (
The RF-MS technology enabled the screening of more than 100 000 compounds against JMJD2C, with the identification of 1126 confirmed hits having IC50 values less than 100 µM. The screen was successful at selecting HKDM inhibitors, as demonstrated by the identification of compounds from the 8-hydroxyquinoline (8-HQ) chemotype. This class of compounds has been shown to inhibit hypoxia-inducible factor (HIF-1α) prolyl hydroxylase, JMJD2A, and JMJD2E.12,32,33 The dose–response curves for three of these compounds are shown in
Figure 4B
and the fitted inhibition parameters in
Table 3
. The IC50 values of ~2.2 µM for compounds
The process of compound lead optimization is reliant on the availability of sufficiently sensitive assays to track activity as the compound potency develops. This presents a challenge for the HKDMs, which we have found to have extremely low turnover numbers ranging from 0.012 to 0.089 s−1, depending on the enzyme ( Tables 1 and 2 ). A similarly low turnover number (~0.08 s−1) has previously been reported for JMJD2E. 13 This necessitates the use of relatively high enzyme concentration to observe turnover. For instance, an enzyme concentration of 0.5 µM was required to achieve a signal-to-background ratio of 4.5 in the RF-MS assay for JMJD2C ( Fig. 3 ). This not only presents a significant challenge in terms of generating sufficient protein for large-scale screening but also restricts assay sensitivity through tight-binding limitations. Increasing the sensitivity of the RF-MS method could be achieved by increasing the signal-to-noise ratio in the assay through addressing the significant background signal observed in the product detection channel ( Fig. 3 , open triangles). Given that the JMJD2 enzymes are tolerant to peptide sequence changes, we are exploring minor modifications on the peptide sequence at the carboxyl terminus to shift the molecular masses of the peptide substrate and product away from the contaminating species responsible for the high background. Another potential way to decrease the background is to improve the purity of the peptide substrate.
The ability to develop a mass spectrometric assay using peptide substrates based on the sequence of histone tails offers considerable potential, not only for monitoring lysine methylation but also for the examination of alternative epigenetic marks. In addition to methylation, histone tails have been shown to be modified by diverse covalent mechanisms, including acetylation, phosphorylation, deimination, ubiquitination, sumoylation, ADP-ribosylation, modification by N-acetylglucosamine, and tail clipping. 1 The structure of histone tails can also be altered by noncovalent means, an intriguing example being cis-trans prolyl isomerization of Pro38 of the yeast histone H3. 34 Crosstalk between this large and intricate array of histone modifications occurs in a highly coordinated fashion, resulting in alteration in chromatin structure and gene expression. 1 The RF-MS platform could, in principle, be used to establish a range of peptide-based screening assays monitoring changes in mass associated with enzyme-mediated modifications in covalent histone marks. It is particularly advantageous in situations where differentiation between a number of potential products is required, as in the case of lysine demethylation. For instance, the current MS detection method is able to measure all methylated species of peptide 3 and could therefore be used to study both methylation and demethylation processes at H3K9 by using differentially methylated forms of the peptide substrate. The same principle could be readily applied to the study of methylation at alternative histone lysines and, in cases where sites are in close proximity, to develop generic substrates carrying more than one modified lysine. This may also provide an approach to the assay of other types of modification and to exploration of the interplay between different marks through the development of MS detection methods that permit differentiation between potential products. In short, the ability to harness the analytical power of MS for HTS presents an adaptable approach to the study of many enzymes in this large and diverse epigenetic target class.
Footnotes
Acknowledgements
We thank David Tew, David Wilson, Steve Rees, Jon Hutchinson, Roy Katso, Rachel Grimley, and Penny Smee for valuable discussions. Laurens Kruidenier, Jack Brown, and Mike Woodrow of the EpiNova team are acknowledged for their support and sponsorship of the program. We also thank Margaret Martin and Isabel Marilia of Sample Management Technology Group for help with compound management, Steven Ratcliffe for coordinating peptide ordering, and Laurie Gordon for help with data analysis. We are grateful to Stanley Ng (Structural Genomics Consortium, University of Oxford, Oxford, UK) for providing expression plasmids for JMJD2A, JMJD2C, and JMJD2E.
References
Supplementary Material
Please find the following supplemental material available below.
For Open Access articles published under a Creative Commons License, all supplemental material carries the same license as the article it is associated with.
For non-Open Access articles published, all supplemental material carries a non-exclusive license, and permission requests for re-use of supplemental material or any part of supplemental material shall be sent directly to the copyright owner as specified in the copyright notice associated with the article.