
Abstract
Recent genome-wide RNAi screens have identified >842 human genes that affect the human immunodeficiency virus (HIV) cycle. The list of genes implicated in infection differs between screens, and there is minimal overlap. A reason for this variance is the interdependence of HIV infection and host cell function, producing a multitude of indirect or pleiotropic cellular effects affecting the viral infection during RNAi screening. To overcome this, the authors devised a 15-dimensional phenotypic profile to define the viral infection block induced by CD4 silencing in HeLa cells. They demonstrate that this phenotypic profile excludes nonspecific, RNAi-based side effects and viral replication defects mediated by silencing of housekeeping genes. To achieve statistical robustness, the authors used automatically annotated RNAi arrays for seven independent genome-wide RNAi screens. This identified 56 host genes, which reliably reproduced CD4-like phenotypes upon HIV infection. The factors include 11 known HIV interactors and 45 factors previously not associated with HIV infection. As proof of concept, the authors confirmed that silencing of PAK1, Ku70, and RNAseH2A impaired HIV replication in Jurkat cells. In summary, multidimensional, visual profiling can identify genes required for HIV infection.
Keywords
Introduction
H
Materials and Methods
Chemicals
Chemicals were purchased from Sigma-Aldrich (St. Louis, MO). DRAQ5 was from BioStatus (Leicestershire, UK). siRNA duplexes were from Dharmacon (Lafayette, CO). The siRNA library comprised 1.0 nM of the Dharmacon siARRAY whole human genome siRNA library (Thermofisher, West Lafayette, CO) containing 84 508 siRNAs corresponding to four unique siRNA duplexes targeting each of 21 127 unique human genes. Primary antibodies were from Santa Cruz Biotechnology (Santa Cruz, CA), and all fluorescent secondary antibodies were from Molecular Probes/Invitrogen (Carlsbad, CA). Transfection reagents were from commercial sources.
Cell lines and cell culture
Long terminal repeat (LTR)–green fluorescent protein (GFP) HeLa CD4+ cells (a gift from A. Boese, IP Korea) were produced as described in Bakal et al. 7 Wild-type HeLa (ATCC, Manassas, VA) and GFP-torsin expressing HeLa (a gift from R. Graihle, IP Korea) were cultivated in high glucose glutamax Dulbecco’s modified Eagle’s medium (Invitrogen) supplemented with 110 mg/mL sodium pyruvate, 10% fetal calf serum (FCS; Gibco, Carlsbad, CA), and 1% penicillin streptomycin (Invitrogen). Jurkat E6-1 clones were cultured in RPMI medium 1640 (Invitrogen) supplemented with 10% FCS (Gibco), 1% penicillin streptomycin (Invitrogen), 1 mM sodium pyruvate (Gibco), and 10 mM HEPES. Cell lines were cultivated on arrays for 12 to 72 h for quantifying reverse transfection. For HIV infection, 650 000 LTR-GFP HeLa CD4+ cells were seeded per array (24 × 60 mm) and cultivated in Opti-MEM (Invitrogen), 5% FCS (Gibco), and 1% penicillin streptomycin (Invitrogen) for 28 h. Cells were infected with HIV-1, strain IIIB virus (Daymoon Industries, Cerritos, CA), multiplicity of infection (MOI) = 0.14, and inoculated for 3 h. After the viral supernatant was removed, cells were cultivated in Opti-MEM (Invitrogen) supplemented with 5% FCS (Gibco) and 1% penicillin streptomycin (Invitrogen) for 45 h. Arrays were fixed in 4% (w/v) paraformaldehyde in Dulbecco’s phosphate-buffered saline (PBS) and stained with 2.5 µM Draq5 before imaging.
RNAi array printing
For preparing the reverse transfection solution for array printing, 5 µL of 20 µM siRNA (Thermofisher) was transferred into a 96-well plate. Then, 8 µL of Red mixture, which contains 20 µM Red siGLO (Thermofisher), 5 µL of 1.6 M sucrose dissolved in RNase-free water, and EC buffer (Qiagen, Valencia, CA), was added. Next, Effectene (Qiagen) was added and mixed thoroughly. The mixture was incubated for 20 min at room temperature (RT). Then, 5 µL of 1.6% (w/v) gelatin was added and mixed and printed as 3888 spot arrays (108 × 36 spots) on glass coverslips using SMP9 stealth pins (Telechem, Atlanta, GA) and a high-throughput microarray printer (Genomic Solutions, Ann Arbor, MI) at 22 to 25 °C, 55% to 65% relative humidity (RH), enclosed in a custom-built clean chamber providing a sterile HEPA-filtered atmosphere. Arrays were stored in a desiccator with no significant alterations in performance from 1 week to 18 months postprinting. Seven slides covered the genome and contained 16% of control siRNA spots.
RNAi array acquisition
Arrays were acquired with a point scanning confocal reader (ImageXpress Ultra; Molecular Devices) as 16-bit TIFF files written directly to an external database.
RNAi array image analysis
Images were read directly from the database for analysis using software designed for this purpose. For automated identification and reconstruction of siRNA spots, a miniature image was created from the three-channel 16-bit images acquired for one array by reducing all tiles to a composite image of 3/100 the original scale. We applied an automated grid-fitting algorithm to identify siRNA spots in the entire array. Locations of spots obtained by grid fitting were used to collect pieces of high-resolution pictures to obtain an annotated spot image. The Draq5 intensity and GFP intensity of each cell were retrieved as the integrated intensity of pixels over a disk of a fixed-size radius of 5 pixels around the maximas. We used Delaunay triangulation and the length and intensity along the links between nuclei to measure syncytia formation and cell dispersion (see
Detailed List of the 15 Image Descriptors
RNAi array data analysis
Once images of every siRNA spot for seven genome-wide screens were analyzed, we obtained seven sample values for each of the 15 descriptors and for each spot and more than seven sample values for all controls as CD4, SCRAMBLED, GFP, XPO1, and so on. After normalization of the arrays, we removed the low-frequency signal produced by the difference in density across the cell layer to compare the sample distributions of each siRNA response to our positive control CD4. A statistical test (described later in
Production of lentiviral vectors and transduction of target cells with shRNA
A set of five shRNA-expressing plasmids targeting PKN-1 and six plasmids for Ku70 (Open Biosystems, Huntsville, AL) were tested. Transfection of these plasmids results in the synthesis of RNA that can be packaged into lentiviral particles. Virions are then used to transduce target cells, where shRNA will be expressed. These vectors also carry the puromycin resistance gene, allowing for selection of transduced cells.
To produce lentiviral particles, each shRNA expressor plasmid was transfected in 293-T cells, together with an HIV Gag-Pol expressor (pCMVdR8.2) and a VSV-G coding plasmid (pHCMV-G). 8 Forty-eight hours after transfection, virions produced in the supernatant were aliquoted and stored at −80 °C.
Jurkat cells (3 × 10⁵/mL) were incubated with shRNA lentiviral vectors (40 ng of p24) for 4 h at 37 °C and gently shaken every hour. Cells were then washed once with PBS and cultured in RPMI (10% FCS, penicillin/streptomycin). Forty-eight hours after cell transduction, puromycin (1 µg/mL) was added to the culture’s medium and maintained thereafter. Resistant cultures were obtained within 1 to 2 weeks, after which the concentration of puromycin was lowered to 0.5 µg/mL.
Western blot analysis
Down-modulation of the expression of targeted proteins was assessed by Western blot analysis. Transduced Jurkat cells were lysed, and 40 µg of lysate protein was loaded in sodium dodecyl sulfate polyacrylamide gel electrophoresis (SDS-PAGE) and immunoblot. For PKN-1, the primary antibody was PKN C-19, and the blot was revealed with a donkey anti-goat–horseradish peroxidase (HRP) antibody. For Ku70, the primary antibody was a mouse monoclonal to Ku70 (Abcam, Cambridge, UK), and the blot was revealed with a sheep anti-mouse-HRP antibody (Amersham ECLTM, GE Healthcare, Buckinghamshire, UK). Cultures in which more than 80% down-modulation was observed were further characterized to assess their susceptibility to HIV infection.
HIV replication in shRNA-transduced Jurkat cells
shRNA-transduced Jurkat cells were plated in 96-well plates (2 × 10⁵ in 200 µL/well) and exposed to HIV (clone NL4-3). Infections were performed with 0.1 and 1 ng p24/well (corresponding to low and high MOI, respectively) for 4 h. Cells were then washed and cultured in RPMI (10% FCS, penicillin/streptomycin) supplemented with 0.5 µg puromycin. The percentage of HIV Gag-expressing cells in culture was monitored every 2 to 3 days by permeabilization and intracellular staining with anti-Gag p24 phycoerythrin mAb (KC57; Beckman Coulter, Brea, CA). An isotype-matched mAb was used as a negative control.
RNA isolation and RT-PCR
Total RNA was isolated from siRNA-transfected Jurkat cells using the Trizol method (Invitrogen). cDNA was produced using 1 µg total RNA and MMLV–reverse transcriptase (Promega, Madison, WI) in 25-µL reaction mixtures in the presence of 50 pmole oligo (dT) primer and 20 µM dNTP mixture for 60 min at 37 °C. For PCR amplification, specific oligonucleotide primer pairs (0.2 pmole each) were incubated with 200 ng cDNA, 1 unit of LA Tag polymerase (Takara, Madison, WI), 1× LA PCR buffer 2 (2.5 mM MgCl2), and 100 µM dNTP in 25-µL reaction mixtures. The sequences of primers used in this study were as follows:
RNAseH2A sense primer 5′-GACCCTATTGGAGAGCGAGC-3′ and RNAseH2A antisense primer 5′-GTCTCTGGCATCCCTA CGGT-3′
GAPDH sense primer 5′-TGATGACATCAAGAAGGTGGTGAA G-3′ and GAPDH antisense primer 5′-TCCTTGGAGGCCAT GTGGGCCAT-3′
PCR conditions were 95 °C for 30 s, 54 °C for 30 s, and 72 °C for 3 min, for a total of 40 cycles. The PCR products were applied onto the 1% agarose gel and visualized by ethidium bromide staining.
Forward siRNA transfection and virus infection
Jurkat cells (40 000 cells/well) were transfected in 24-well plates with 1 µM Accell siRNA (Dharmacon) against selected individual RNAseH2A or nontargeting siRNA and incubated for 72 h. Cells were infected with HIV-1 strain IIIB virus (Daymoon Industries) at MOIs of 0.5 or 0.01 for 3 h. After the viral supernatant was removed, cells were cultivated in RPMI medium 1640 (Invitrogen) supplemented with 10% FCS (Gibco), 1% penicillin streptomycin (Invitrogen), 1 mM sodium pyruvate (Gibco), and 10 mM HEPES for 96 h. Viral release was determined by detection of p24 HIV-1 viral core antigen in cell-free supernatants by a p24 enzyme-linked immunosorbent assay (ELISA; PerkinElmer, Waltham, MA).
Results
Establishing visual profiling on array-based imaging screens
We developed a high-content, genome-wide RNAi screen (
(
(
We used 15 imaging parameters
7
to describe HeLa-CD4+ LTR-GFP cells infected with HIV-1 (see
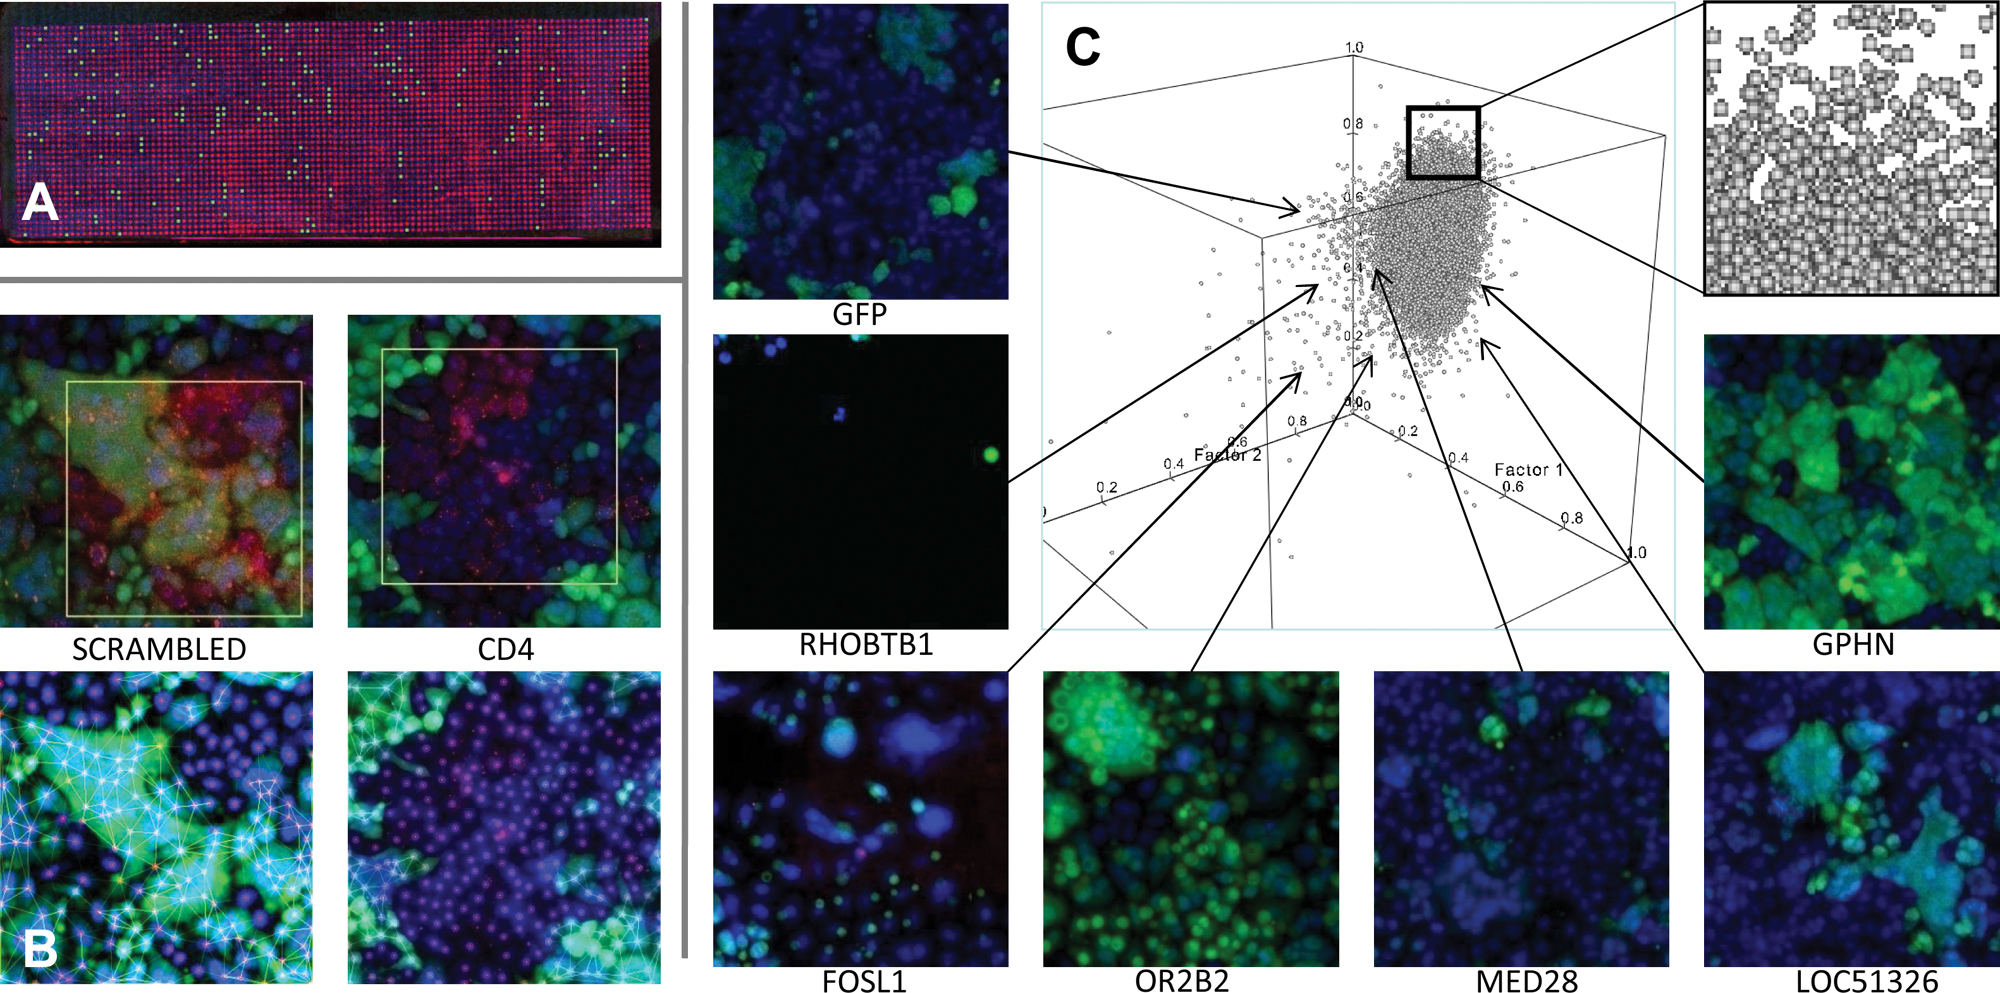
To investigate this multidimensional imaging space on a genome-wide scale, we developed a visual array screening system based on cellular microarrays10–17: siRNAs spotted onto a glass wafer were reverse transfected into cells and then imaged with an automated confocal microscope (
Multidimensional visual profiling can distinguish a CD4-dependent HIV infection block from indirect or unspecific RNAi effects
To test the robustness of multidimensional image profiling, we analyzed whether the 15 visual parameters reliably distinguished a CD4-like HIV infection phenotype from a background phenotype of cells reverse transfected with scrambled siRNA.
We reverse transfected Hela-CD4+ LTR-GFP cells with siRNAs and then infected the cells with HIV-1 (MOI 0.14) for 48 h. Under these conditions, HIV infection was significantly repressed in cells transfected with a CD4 siRNA (
To measure virally induced syncytia formation as well as cell dispersion, the Delaunay triangulation
18
was computed from the set of all nuclear centers to establish a unique neighborhood map linking cells. The minimum value of GFP for unique nucleus–nucleus links was retrieved and used to discriminate syncytial fused from unfused cell clusters (see
To further validate the visual profiling approach, we analyzed whether a multiparametric analysis was sufficient to distinguish effects on virus–host interactions from indirect, pleiotropic, or false-positive effects. In its most skewed representation, a housekeeping RNAi phenotype could block HIV reporter expression by generally slowing transcription efficiency, without otherwise disturbing infection. This was simulated through the GFP-RNAi-based knockdown of the LTR-driven GFP, which significantly knocks down HIV reporter levels without affecting HIV infection. Intriguingly, when comparing the visual profiles of CD4-depleted, HIV-infected cells with those transfected by GFP siRNA, 15-dimensional distributions for both populations were strikingly different (Wilks’ lambda: 0.685 << 0.9). Neither of the two populations revealed any detectable expression of the LTR-GFP reporter, but only in the case of CD4 knockdown was a lack of syncytia formation measured. Therefore, the visual profiling approach can apparently discern the additional morphological symptoms imprinted on the host cell by infection in CD4 knockdown cells. This is a crucial result, as it allowed the exclusion of false positives embedded in the transcriptional machinery of infected host cells.
To scrutinize the type of housekeeping functions identified, we analyzed the visual profile induced by knockdown of a core housekeeping gene. As the nuclear transport pathway has been represented through several karyopherin and nucleoporin hits in previous HIV screens,3,4,20 we used the exportin XPO1 as an example housekeeping gene. Exportin1 is an essential nuclear export factor and plays a role in the export of the unspliced viral HIV mRNA during the late viral replication cycle. 21 Knockdown of XPO1 blocks protein transport by stopping ribosomal subunit export and stopping import factor recycling. The nuclear transport block severely impairs cell growth and, as a consequence, HIV replication. The underlying aim of this “housekeeping” experiment was to establish whether the 15-dimensional imaging measurement had sufficient parameters to identify differences between XPO1- and CD4-depleted cells caused by the nuclear transport block, such as a change in nucleus volume, cell size, or, eventually, cell density.
The image analysis did not identify XPO1 as part of the CD4 population (XPO1 vs CD4 distribution had a Wilks’ lambda of 0.540 << 0.9). The ability of the analysis to distinguish the housekeeping defect may be based on one of the 15 parameters, such as nucleo-cytoplasmic intensity ratio, or a cumulative combination of minor effects on several parameters.
A further comparison between CD4 and rab9a knockdown, known to play a role in the HIV life cycle, showed that visual profiling excluded genes involved in the late replication cycle, as would be expected in our experimental setup (rab9a didn’t show significant 15-dimensional distribution difference with scrambled, data not shown). However, there was also gene knockdown showing a distinct profile of CD4 from a scrambled siRNA background, but which nonetheless does not fit the profile of CD4. One such example given here is p65, a major transcriptional regulator. We decided not to follow up on that factor group as the goal of this study was not to identify a maximum number of human HIV cofactors but rather to be as precise as possible in identifying genes that reproduce a CD4-like replication block when depleted. The controls described above show that the principle of 15-dimensional visual profiling can effectively achieve this task.
Fifty-six genes reproducing the visual profile of a CD4-dependent replication block
Seven complete human genomes in siRNA were cultivated for 28 h with the LTR-GFP HeLa CD4+ cell line to permit host gene silencing. Arrays were then infected with HIV-1 (MOI of 0.14) for 3 h, washed, and further incubated for 45 h prior to imaging. Once the arrays were imaged, the identity of each spot was retrieved, and HIV infection was independently analyzed on each spot using the following image and data analysis strategy.
The array is a large experiment with a low-frequency spatial variation due to imperfect cell density across its surface. Given variations in cell culture, the measurements of infection were normalized across the arrays. We used a median filter with a radius size of 3 spots to filter result arrays (see
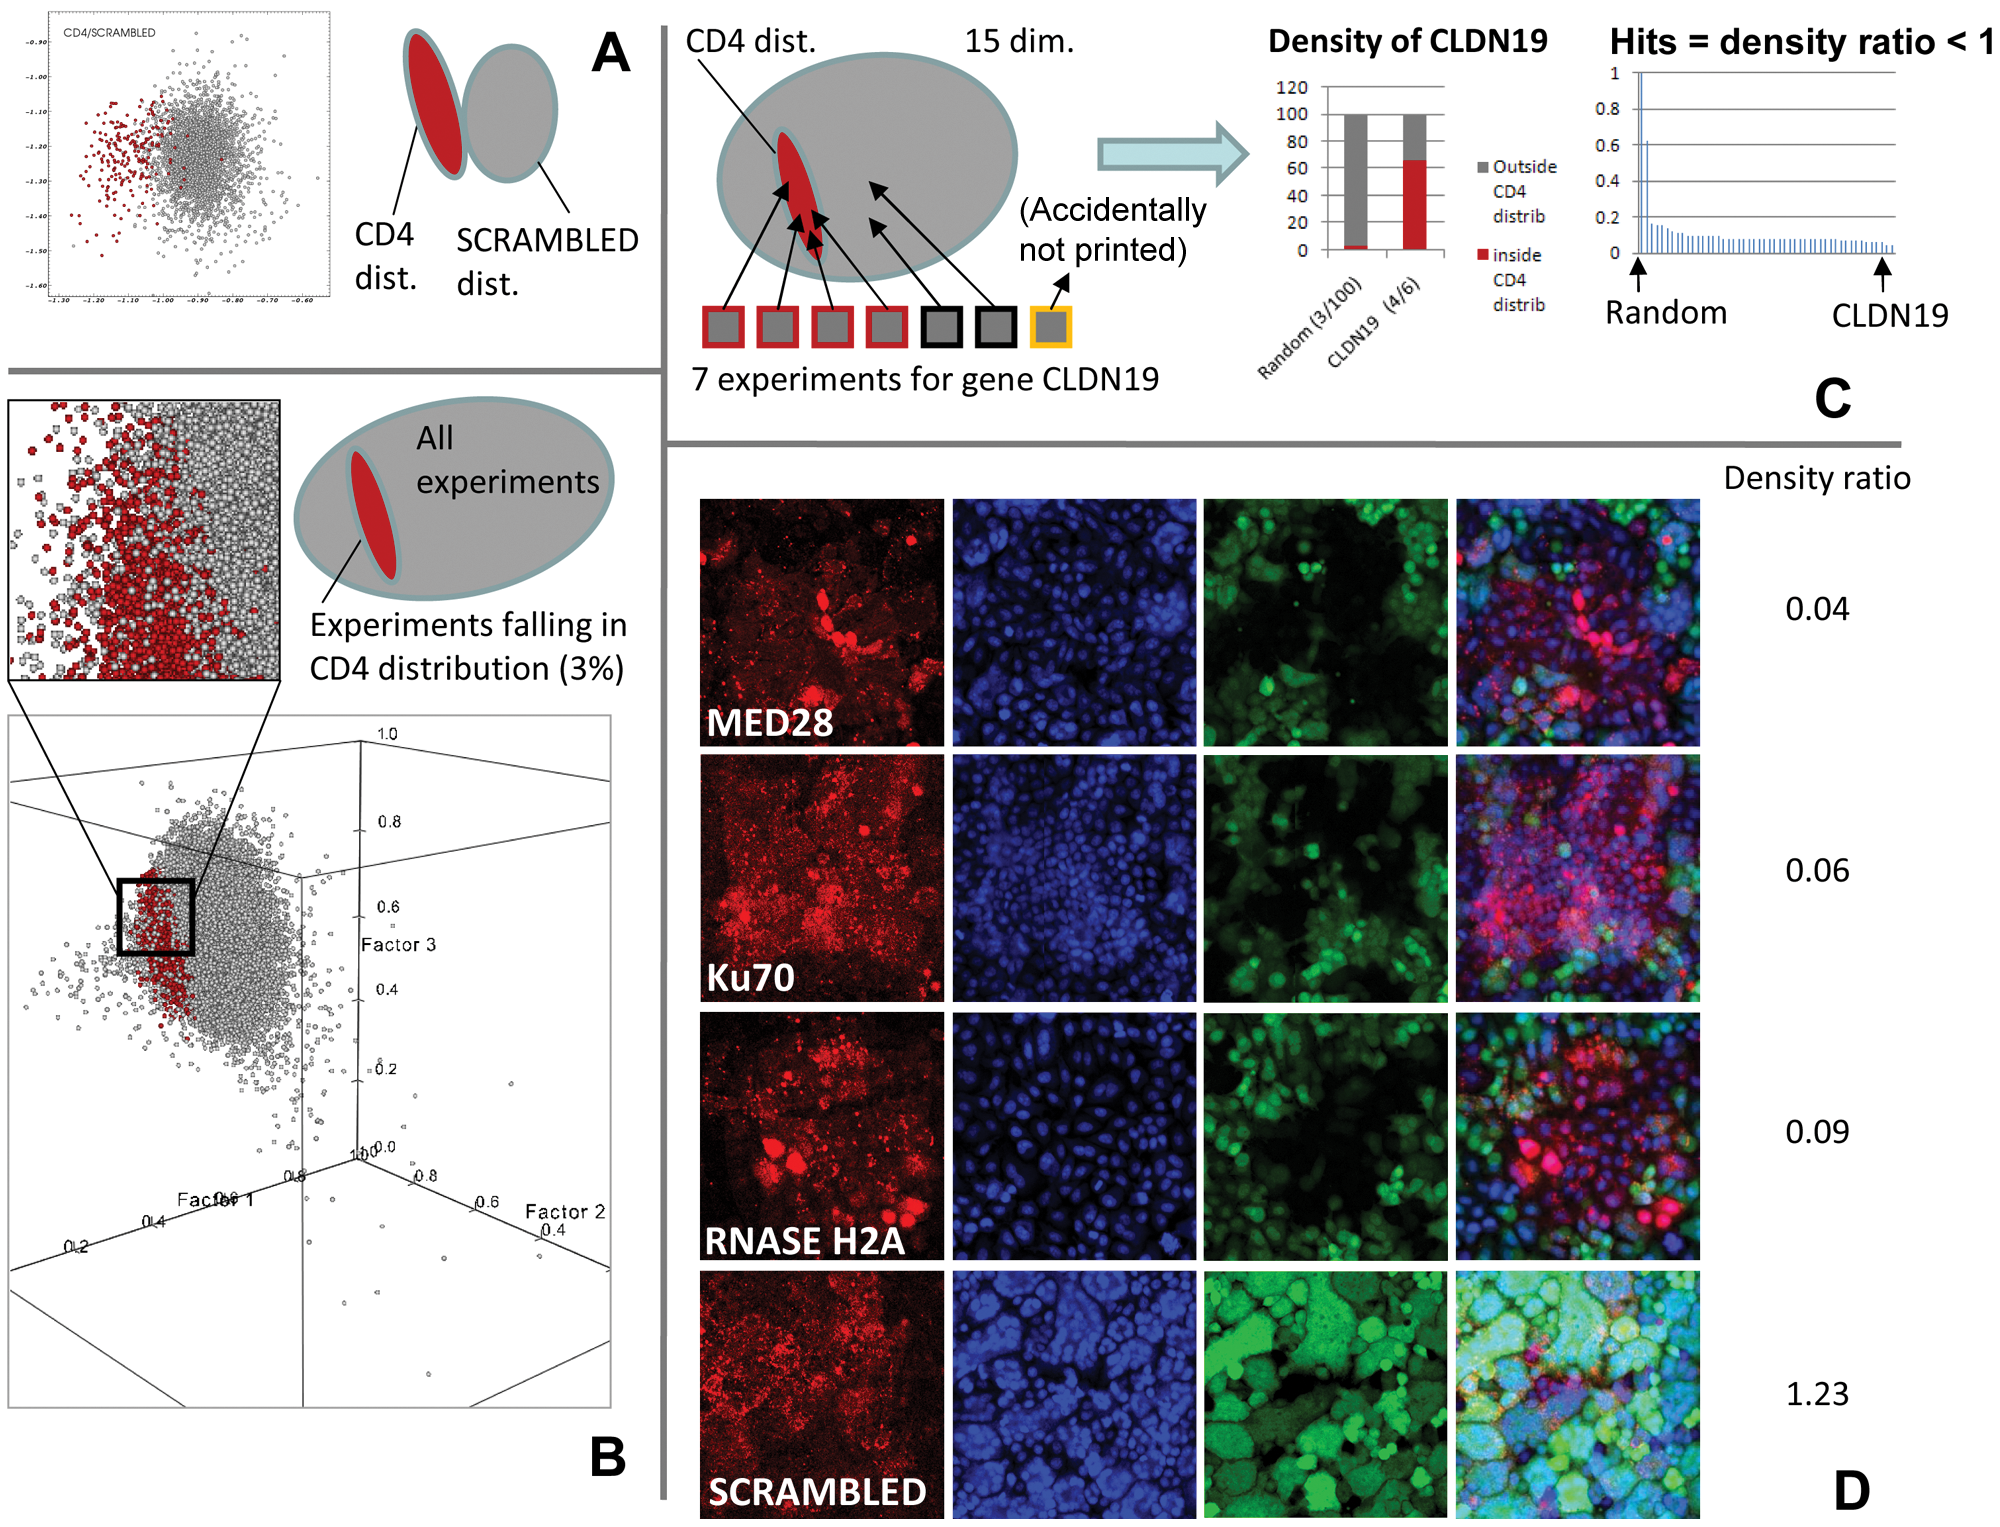
We computed the 15-dimensional Mahalanobis metric relative to CD4 and scrambled classes for all 190 512 data points. We selected the points closer to CD4 than scrambled and simultaneously with a distance to the CD4 class center inferior to the square root of a given G, which is determined from a χ2 (with 15 degrees of freedom) as corresponding to a gating probability chosen to be at least 0.99. This identified 1680 experiments (0.8%) as potentially similar to CD4.
Because we performed seven independent genome-wide screens, we computed a density score for each siRNA within the CD4 class. For each gene, the ratio between the percentages of experiments inside the CD4 class versus outside was computed. All genes less than a score of 1 were considered to have an abnormally high representation in the CD4 class, and the lower the score, the stronger that representation. For example, CD4 has a score value of 0.043, which means it is 23 times (1/0.043) denser inside the CD4 class than outside. A score lower than 0.1 means a density at least 10 times higher inside the CD4 class than outside (
List of Hits, Their Function, and Direct Known or Putative Interaction with HIV-1

Italicized entries = known as involved in HIV replication. Bold entries = secondarily tested in Jurkat cells in this study.
List of Hits Expressed in T Lymphocytes, Macrophages, or Dendritic Cells

PKN1 Ku70 or RNAseH2A depletion in Jurkat cells impairs HIV1 replication
To assess the significance of the screening results, it is important to demonstrate for some of the identified genes that they affect HIV replication in human T lymphocytes. Our aim was not to perform a systemic analysis of all identified proteins but rather to bring a proof of concept for the validity of our screening procedure.
We selected 3 genes from the list of these 56 identified genes: PKN1, Ku70, and RNAseH2A on HIV replication. PKN1 (also termed PAK1) is a kinase involved in various signaling pathways, whose implication in HIV replication has been reported. 22 The DNA-PK is a trimeric nuclear protein kinase consisting of a catalytic subunit and the Ku70/Ku80 complex that regulates its kinase activity. DNA-PK is a component of the dsDNA break repair pathway. Ku80 facilitates retroviral integration, 23 but the role of Ku70 in this process remains largely unknown. The implication of RNAseH2A during HIV replication has not been studied so far. Mutations in the RNAseH2A gene have been shown to result in the neurological disorder Aicardi-Goutières syndrome (AGS). 24
We used two methods to examine the effect of gene knockdown on HIV replication in Jurkat cells: shRNA-mediated silencing in stably transduced Jurkat cell lines and transient transfection of siRNA. For CD4, PKN1, and Ku70, up to six shRNAs in a lentiviral vector were transduced into Jurkat cells, and stable cell lines were produced. We selected the shRNAs that were more efficient in silencing the target proteins (
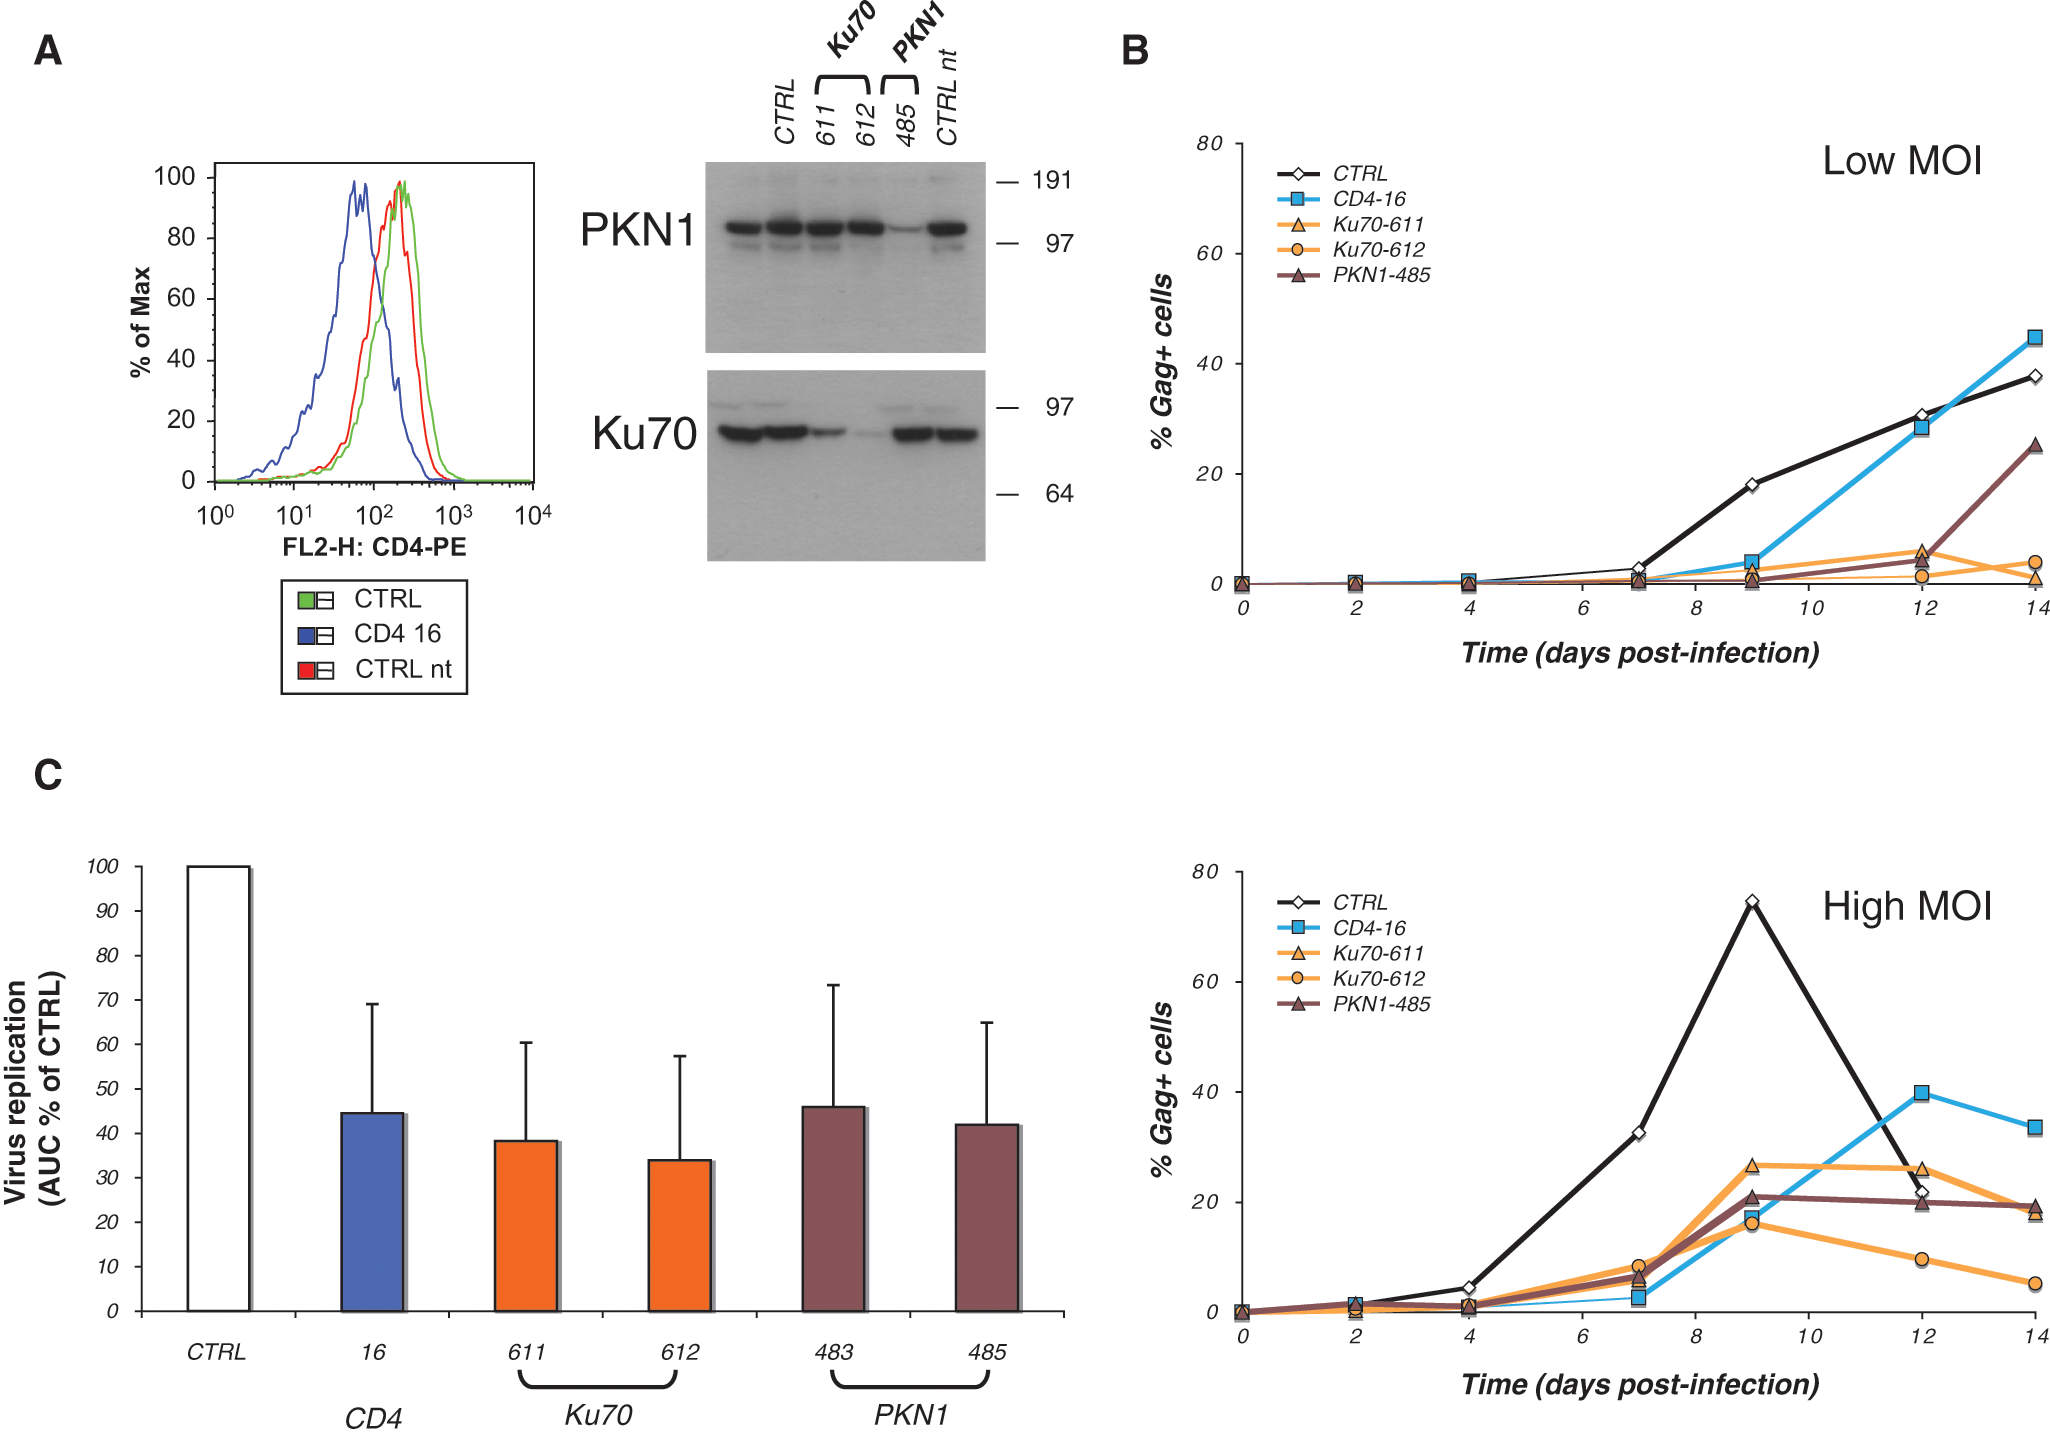
Ku70 and PKN1 down-modulation in Jurkat T cells impairs HIV replication. Jurkat cells were transduced with lentiviral vectors encoding shRNA against CD4, Ku70, or PKN1. As controls, cells transduced with an irrelevant shRNA (CTRL, directed against a murine protein) or nontransduced Jurkat cells (CTRL nt) were used. (
We then studied the role of RNAseH2A in HIV replication. Lentiviral-mediated shRNA silencing did not lead to efficient downregulation of RNAseH2A (not shown). Transient transfection of Jurkat cells with RNAseH2A siRNAs gave robust silencing of RNAseH2A expression by RT-PCR (
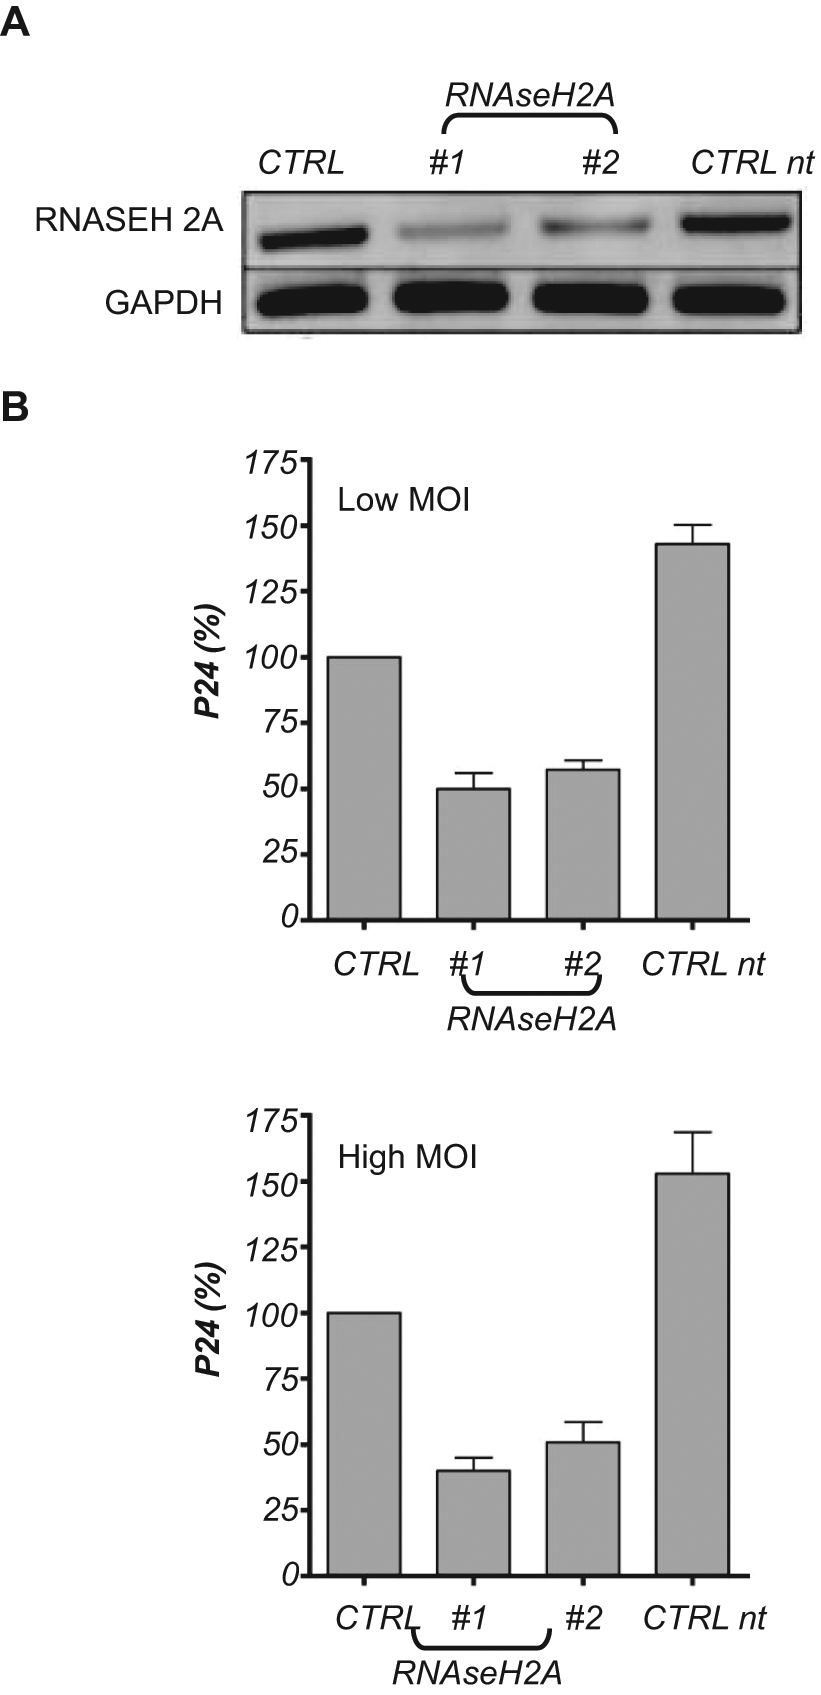
RNAseH2A facilitates HIV replication. Jurkat cells were transfected with individual siRNA #1,#2 against RNAseH2A. As controls, cells transfected with nontargeted siRNA (CTRL, scramble siRNA) or nontransfected Jurkat cells (CTRL nt) were used. (
Discussion
During the past decade, the combined worldwide research effort on HIV and host virus interactions has yielded a list of about 25 host factors shown to play a crucial role in the viral infection. In contrast, in the past 3 years, several genome-wide analyses have identified multiple additional cofactors: 273 by Brass et al., 3 295 by König et al., 6 224 by Zhou et al., 4 and 252 by Yeung et al. 5 Of note, the study by Yeung et al. 5 used a relevant T cell line (Jurkat), whereas the previous screens relied on epithelial/fibroblast adherent cells. Although this impressive increase in scientific output shows the potential of genome-wide, systematic approaches, it also highlights its limitations: Very little overlap was found between the results. 2 Notably, this cannot be explained by differences in assay procedures, which are based on similar principles. Furthermore, all groups have performed extensive work in following up on the verification of their genes employing independent approaches, and it is reasonable to assume that the identified genes are correct: All these genes do affect the HIV infection, directly or indirectly.
The meta-analysis by Bushman et al. 2 revealed that among 842 genes, only 34 were represented in any two of those assays with an average overlap of 6%. We have also cross-examined our hit list with the results of each of those three screens and also obtained a low correlation finding CD4, MED28, CXCR4, ERP27, CSPP1, and DNAJA2 in common with at least one of those screens in our selected hits. This corresponds to 6% of the HIV human host factors we identified, indicating that our selection methods correlate as poorly with previous approaches as they correlate to one another. In addition, from the 34 genes represented in any two of those previous screens and identified by the Bushman et al. 2 meta-analysis, 9 appeared in our analysis as having a density score inferior to 0.5. Those genes are MED28, CD4, CXCR4, CRSP2, CTDP1, TRIM55, JAK1, RANBP2L1, and p65.
Why are the genes identified in the independent screening assays different? A closer analysis would suggest that the issue lies in a combination of a highly sensitive assay system with nonstringent selection criteria. The sensitivity of the assay system is based in the close interaction between viral replication and host cell function, where any change in cellular function will affect the elevated viral replication rates of a laboratory-optimized assay system. A broad and pleiotropic response of hits combined with a nonstringent selection system will inevitably produce a high ratio of false positives. Indeed, three factors appear to contribute to the lack of stringency in the hit selection system of previous screens:
Previous analyses chose arbitrary threshold levels favoring a selection of a small fraction of the experiments in a primary screen. In Brass et al., 3 this threshold is defined at two standard deviations from the mean of the microplate; in König et al., 6 it is 45% of infectivity; in Zhou et al., 4 it is two standardized mean differences; and in Yeung et al., 5 it is twofold mRNA enrichment in cells that survived HIV infection. Accordingly, all studies chose an arbitrary value on the axis of apparent infectivity (cell number) under which primary hits are selected. On one hand, such a selection criterion removes between 95% 4 and 98% 3 of the genes, many of which may nevertheless constitute further hits. On the other hand, thresholding will also select false positives from the tail of the distribution. Issues concerning this kind of analysis for the RNAi screen were underlined by Birmingham et al. 25
The issue of thresholding is compounded by the lack of sufficient selection parameters. The screens mostly use a small number of measurements for identifying hits, such as cell number and reporter production. Systematic gene silencing clearly has numerous consequences on cell function, producing a large variety of unknown phenotypes (
Finally, in those previous works, the experiments were generally only performed in duplicate, but siRNA screens are now known to show high variation. 25
To tackle these problems, screen complexity was reduced by focusing on early steps of HIV infection (gene knockdowns that resemble CD4 silencing), reducing the number of host–viral interaction steps. To simultaneously increase hit selection stringency—at the primary screen—we applied a specific selection algorithm that employs 15 criteria across seven genome-wide screens comprising >190 000 experiments (including controls) to discriminate CD4 block from other phenotypes (
Our procedure individually profiled all infectious knockdown experiments on a genome-wide level. Fifteen parameters seem sufficient to specifically profile and recognize the morphometric state of CD4 viral infection block, as syncytia formation and GFP reporter production will respond starkly differently from infected cells (3% of experiments fall in the CD4 distribution). However, the level of specificity that a given constellation of 15 parameters can convey becomes apparent when we are discerning unspecific effects on viral replication. Not only will the knockdown of GFP deviate from the 15-dimensional CD4 profile, but housekeeping genes such as XPO1 will have cellular effects in addition to the viral replication block, which makes these profiles different from the reference. It will be worth determining further the phenotype of other housekeeping genes.
However, it is important to keep in mind that the gain in specificity is a trade-off, in that many host genes that are both directly involved in viral interaction and have an essential housekeeping function will not be selected. In contrast to the much more comprehensive list of the previous studies,3–6 we identify a small set of genes that may be essential for viral replication, the knockdown of which does otherwise not affect cell viability.
In this study, our aim was not to precisely determine at which stage of the viral life cycle the cellular proteins are implicated. This will require further investigation. Our goal was to demonstrate that the screening method identified genes that are HIV host factors. As a proof of concept, we confirmed that three of the selected proteins—namely, PKN1, Ku70, and RNAseH2A—also regulate HIV replication in the Jurkat T cell line.
Further work on the host biology of the human host factors identified here will require use of primary lymphocytes and other physiologically relevant cellular targets of HIV to exclude factors that are not therapeutic targets. Notably, some of the identified proteins are probably expressed in epithelial-like cells and not in lymphocytes. This is the case for claudin 19, which is not expressed in T cells and whose implication in HIV replication is questionable. A caveat of using HeLa cells is that T cell–specific factors may be missed in the screen.
In summary, the list of 56 human host factors may not capture all aspects of host viral interactions during the early steps of the HIV infection yet generates a number of prime cellular targets for therapy development. This novel genome-wide screening technique may also be used for the study of microbial–host interactions and other pathological or physiological cellular processes.
Footnotes
Acknowledgements
The work, conducted at Institut Pasteur Korea, was supported by Institut Pasteur Korea and the Korean Ministry of Science and Technology. The work conducted by Olivier Schwartz’s laboratory was supported by grants from Agence Nationale de Recherche sur le SIDA (ANRS), Sidaction, CNRS, European Community (FP7 contract 201412), and Institut Pasteur. There was no commercial support for this project.
NE and AG conceived, designed, and implemented the genome-wide microarray biology, technology, and software. UN suggested screening HIV. MPW designed and performed the HIV infection. YJK, NYK, HCK, SYC, SJ, FM, VP, NC, OS, and NE performed experimental work and hit confirmation. AG performed image and data analysis, NE and AG interpreted the data, and AG, NE, and UN wrote the article.
References
Supplementary Material
Please find the following supplemental material available below.
For Open Access articles published under a Creative Commons License, all supplemental material carries the same license as the article it is associated with.
For non-Open Access articles published, all supplemental material carries a non-exclusive license, and permission requests for re-use of supplemental material or any part of supplemental material shall be sent directly to the copyright owner as specified in the copyright notice associated with the article.