
Abstract
High-throughput RNA interference (RNAi) screening has opened up a path to investigating functional genomics in a genome-wide pattern. However, such studies are often restricted to assays that have a single readout format. Recently, advanced image technologies have been coupled with high-throughput RNAi screening to develop high-content screening, in which one or more cell image(s), instead of a single readout, were generated from each well. This image-based high-content screening technology has led to genome-wide functional annotation in a wider spectrum of biological research studies, as well as in drug and target discovery, so that complex cellular phenotypes can be measured in a multiparametric format. Despite these advances, data analysis and visualization tools are still largely lacking for these types of experiments. Therefore, we developed iScreen (image-Based High-content RNAi Screening Analysis Tool), an R package for the statistical modeling and visualization of image-based high-content RNAi screening. Two case studies were used to demonstrate the capability and efficiency of the iScreen package. iScreen is available for download on CRAN (http://cran.cnr.berkeley.edu/web/packages/iScreen/index.html). The user manual is also available as a supplementary document.
Introduction
RNA interference (RNAi) is a loss-of-function technique mediated via either small interfering RNAs (siRNAs) or short hairpin RNAs, and it has been widely used for functional genomics studies in a genome-wide pattern. 1 A typical genome-wide high-throughput screen (HTS) uses 96-well or 384-well plates, with each well corresponding to the knockdown of one gene. For traditional high-throughput RNAi screening, there is usually one single summarized endpoint based on cell population (for example, cell viability) from each well. Data from such screenings can be visualized and analyzed to pick up hits associated with a specific biological phenotype. Most current data analysis software for high-throughput RNAi screening experiments focuses on analyzing single-readout screening results.2,3 However, for most biological studies of complex human diseases such as cancer, a single cell has to be analyzed and multiple parameters obtained, such as cell size, DNA content, cytoplasm-nucleus translocation, and number of fluorescence-labeled organelles, to quantify complex cellular status. 4 Therefore, efforts have been made in recent decades to help profile complex biological phenotypes using advanced microscopy imaging technology.5,6 Recently, image-based high-content RNAi screening, in which RNAi is integrated with automated imaging technology, has boosted research through its ability to capture complex multivariate cellular phenotypes and provide a higher-level description of biological processes to annotate gene functions and profile cellular phenotypes.7,8 Image-based high-content screening experiments have been dramatically affecting novel drug- and target-discovery strategies across a large swath of biological systems 9 ; most of these studies have been focused on studying mechanisms of action. 10
For image-based high-content RNAi screening experiments, there are usually readouts from hundreds of cells per well, which greatly affects the analysis and interpretation of such data sets. For regular HTS experiments, the readout from each well can be compared directly with those from control wells or with the population mean to identify hits, whereas in high-content screening experiments, the distribution of readouts across cells within each well needs to be compared with those from the controls. As a result, statistical models are essential to analysis and hit identification in high-content screening experiments. Computational approaches and tools have been developed for such high-content screenings for data analysis, and most have been focused on feature extraction 11 and classification of heterogeneous cell types. 12 For example, imageHTS 13 provides tools to segment cells and extract quantitative cell features. It uses the Support Vector Machine classifier to predict cell types and apply simple ways to extrapolate from cell-level data to the well level, such as using the mean values across all cells. Although the feature extraction step is important for image-based high-throughput RNAi screening, the ultimate goal of analysis is to identify which genes are associated with phenotypical readouts. To identify gene-phenotype associations, it is critical to use the cell-level readouts appropriately while controlling for other potential confounding factors, such as cell size and cytoplasmic contents. In addition, how to efficiently integrate into data analysis the readouts from the positive or negative control wells within the same plate is still an open question. A data visualization tool is also lacking to control experimental quality and plot the analysis results across plates or experimental factors for image-based high-content screening. Therefore, developing software to address these important questions would facilitate the analysis and interpretation of image-based high-content screening experiments.
In this study, we developed a new R package for analyzing and visualizing image-based high-content screening experiments ( Fig. 1 ). In this package, users can easily visualize the data and perform rigorous statistical analysis to fit hierarchical multivariate data from image-based high-content screening to control for potential confounding factors. In addition to the default analysis pipeline, users can also integrate other existing software tools or their own analysis functions into the iScreen package to perform customized data analysis. For example, users can easily integrate SbacHTS software 3 and DecoRNAi software 14 together with the iScreen package to perform background correction, off-target effect suppression, and hit identification for image-based high-throughput RNAi screening. Furthermore, the iScreen package can be incorporated into existing pipelines for image-based high-content screening analysis.
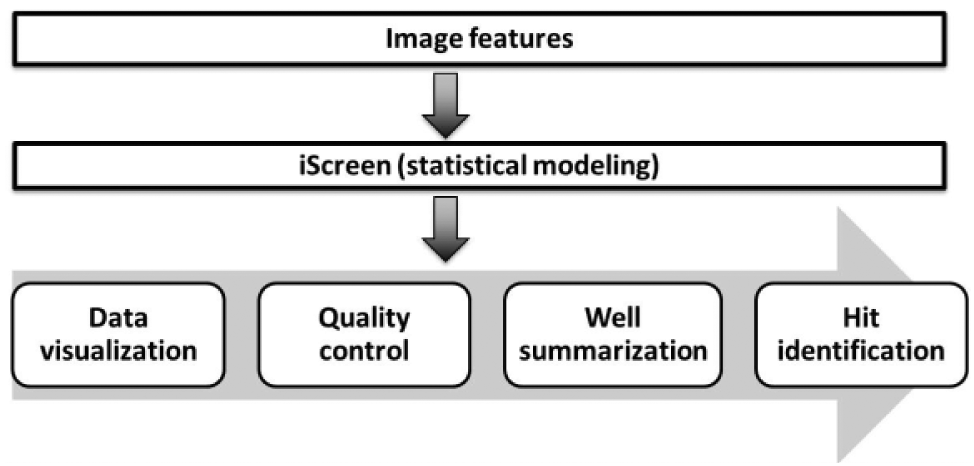
Workflow of the iScreen package. Extracted image features are imported into iScreen and models using a generalized linear model or custom function to summarize high-dimensional image data into the well level. Meanwhile, both raw data and analysis can be visualized to examine data quality. Summarized data can be used to pick hits.
Materials and Methods
Experimental Procedure
HeLa cells were plated in 96-well plates. Pools of siRNA were planted in each well to knock down a specific gene. Autophagosomes and/or virus were labeled as green or red respectively as described. 8
Image and Data Preprocessing
Images were preprocessed using Pipeline Pilot software to extract information about the location of autophagosomes and/or virus proteins, number of organelles, cell size, and so on as described. 8
Analysis Pipeline
As shown in Figure 1 , once image features are extracted, high-dimensional image data sets are imported into the iScreen package for downstream analysis. A heat map, boxplot, and scatter plot are used to visualize data and control quality. For example, position effect could be examined using a heat map; batch effect, such as difference across different experimental dates, will be observed using a boxplot. Thereafter, the user could specify one of several generalized linear models or integrate a custom function to analyze data, such as comparison with control wells on the same plate while controlling other confounding factors such as cell size, so data from each well can be summarized. Based on summarized statistics, the user can select the cutoff to pick up hits for further experimental validations. Each step will be delineated in the following descriptions.
Data Visualization
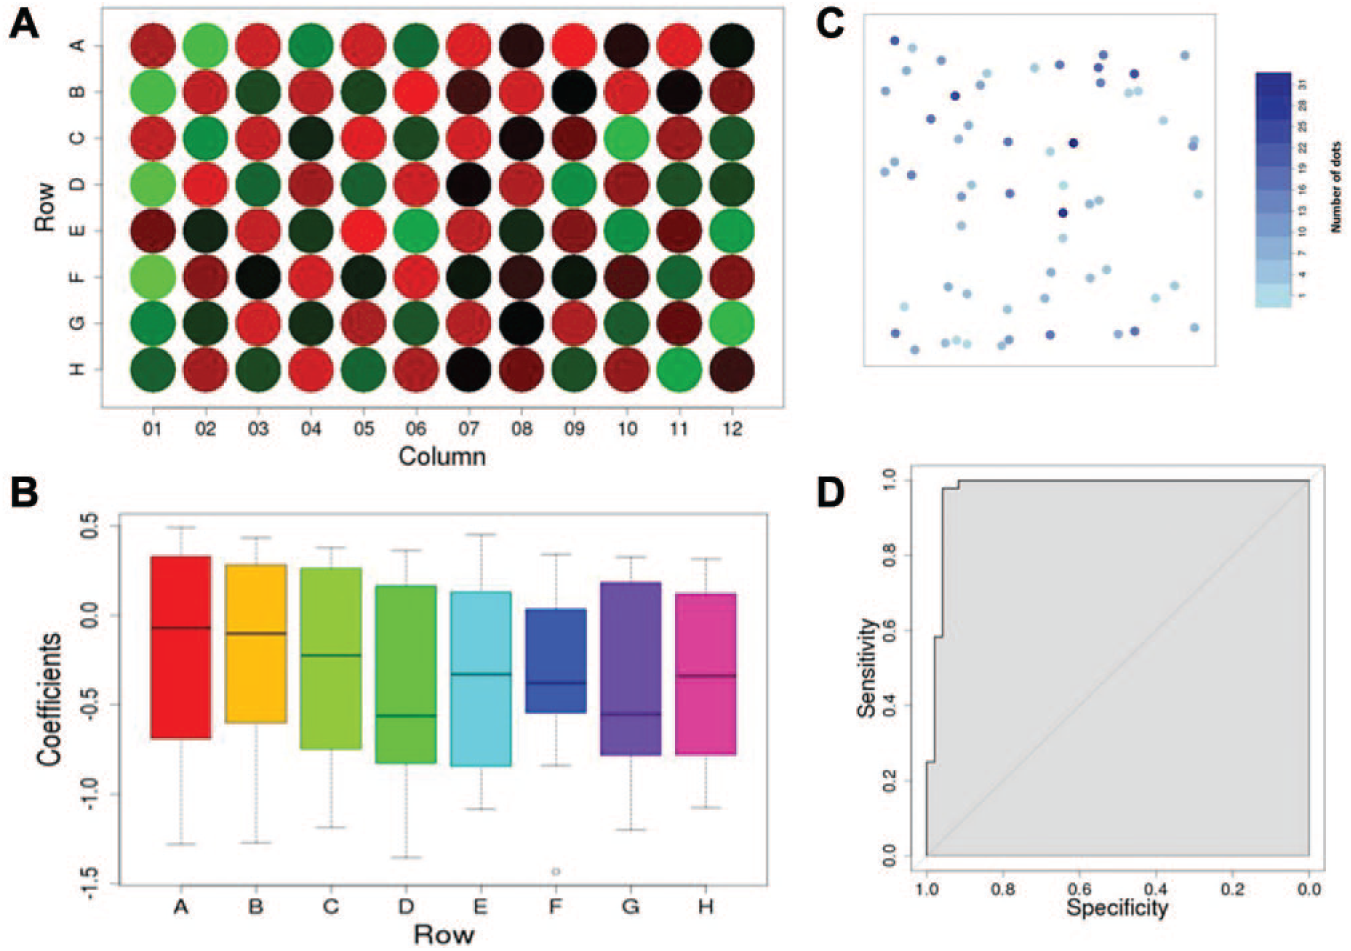
The iScreen package provides visualization tools to examine raw data, display analysis results, and conduct quality control. For example, users can plot analysis results using a heat map plot ( Fig. 2A ): in each well, the mean of the number of autophagosomes was calculated and plotted using a red-green color scheme; position effect could be observed, if any, and the user has a preliminary impression of raw data. In addition, quality control can be carried out using built-in tools such as a boxplot ( Fig. 2B ). For example, for each plate, raw data could be plotted based on row number (or column number if desired), and the user can also plot raw data based on plate number or experimental date to examine batch effect (figure not shown here).
(
Built-in Analysis Functions
For data analysis, iScreen provides flexible statistical models for data summarization and hit identification (genes with significant associations with phenotypes). Because the phenotypic readouts from the image-based high-content RNAi screening may follow different distributions, the appropriate analysis methods could be different for various applications. To allow for a flexible analysis plan, the iScreen package uses a generalized linear model (GLM) framework, which covers a variety of distributions from the exponential family, including Gaussian, Poisson, gamma, and binomial distributions. In GLMs,
User-Defined Functions for Customized Analysis
In addition to the GLMs, users can also apply other statistical models to analyze their data. For example, alternative ways to analyze co-localization events in our second case study include marker correlation analysis. 15 To facilitate custom analysis, the iScreen package allows users to incorporate self-defined functions to model and analyze data. In this way, the customized functions can be integrated with other iScreen analysis and visualization tools to construct a user-defined analysis pipeline.
Results and Discussion
Case Study 1
We applied the iScreen analysis pipeline to analyze high-content screening experimental data and identify cellular autophagy factors. In this experiment, hundreds of cells were planted in each well (on microplates) in which one gene was knocked down by RNA interferences. The number of autophagosomes (green dots in the images) in each cell was counted and compared with negative controls within the same plate. Users could visualize the well-level data by plotting raw data from each well of the microplate. For example, based on the location information of each cell from the same well, we can plot the number of autophagosomes in each cell using a color scheme (
Fig. 2C
): on the plot, both axes represent the x coordinates and y coordinates, respectively, and each dot represents a cell, the color of which is proportional to the number of autophagosomes in each cell. To perform the comparison, we modeled the count data using a Poisson regression model (which is one type of GLM):
To evaluate the performance of the model implemented in the iScreen package, we designed an experiment with active and inactive siRNAs alternately planted in wells across the plate. Four wells treated with inactive siRNAs on the 12th column were used as the on-plate controls, and for each of the other wells, data were fitted into the iScreen model to evaluate the deviation from the control wells and then summarized into a coefficient β i . After estimation of the coefficients, we can use them to rank wells and integrate known siRNA activity information to calculate sensitivity and specificity for the whole plate. Using this experiment, we evaluated the analysis performance using the receiving operating characteristics plot ( Fig. 2D ), and the area under the curve was 0.975, representing high accuracy in hits identification.
Case Study 2
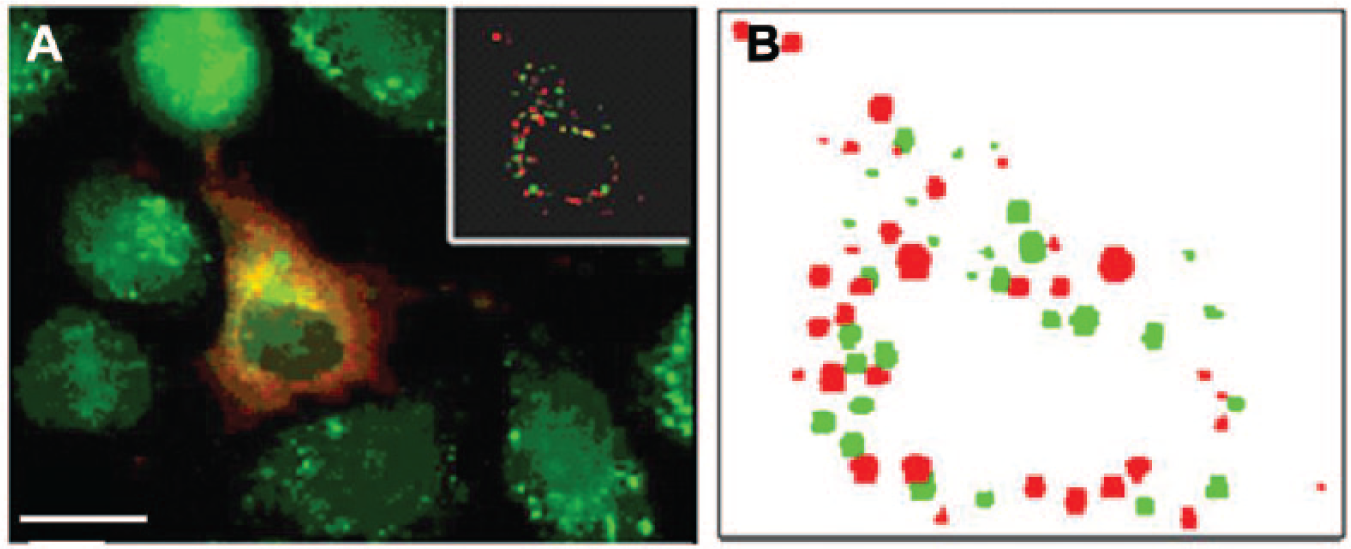
In the second case study, image-based high-content screening was carried out to detect the genes required for the co-localization of Sindbis virus capsid proteins with autophagosomes. 8 Co-localization events were defined as either touching or overlapping between autophagosomes and viral proteins in the same cell. Figure 3A is a snapshot showing the co-localization of viral proteins (red dots) and autophagosomes (green dots). To capture this pattern, we developed a built-in visualization tool in iScreen for displaying the information (including the size and location of each dot; Fig. 3B ) extracted from imaging analysis: the plot represents the content in an image, in which red dots represent viral proteins and green dots represent autophagosomes, and therefore, co-localization can be easily observed. In addition, because the figure is reconstructed from the features (e.g., size and location of each dot) extracted from the image, it allows users to check and confirm that the features have been extracted appropriately.
(
The number of co-localization events in each cell was modeled as a Poisson distribution for each well. To determine whether treatment with a siRNA leads to significant changes of the magnitude of autophagosome-virus co-localization, we used the following model implemented in the iScreen package:
In our software packages, we also provide flexibility for the user to incorporate user-defined functions into the analysis pipeline. For example, an alternative way to analyze the co-localization events in our second case study is to use marker correlation analysis. Red dots and greens dots are considered as two different kinds of markers, and marker correlation analysis is used to evaluate the correlation between them. If one gene knockdown can significantly change the correlation between two markers, the gene might be of biological interest.
Recently, image-based high-content RNAi screening has emerged as a powerful technique for studying the complex phenotypic outcomes of gene functions. Given the fact that specific tools were lacking for such analysis, we developed the iScreen R package to facilitate data analysis and visualization. Experimental validation shows the performance and capability of the iScreen package through two case studies via either the default analysis pipeline or the integration of custom-defined functions. In some image-based high-content RNAi screening, gene information might not be available. Flexible in such cases, iScreen allows the user to perform statistical modeling using well address as a variable to select hits.
Footnotes
Declaration of Conflicting Interests
The authors declared no potential conflicts of interest with respect to the research, authorship, and/or publication of this article.
Funding
The authors disclosed receipt of the following financial support for the research, authorship, and/or publication of this article: This work was supported by National Institutes of Health grants 5R01CA152301, 1R01CA172211, and U19AI109725 and by Cancer Prevention Research Institute of Texas awards RP101251 and RP120718.
References
Supplementary Material
Please find the following supplemental material available below.
For Open Access articles published under a Creative Commons License, all supplemental material carries the same license as the article it is associated with.
For non-Open Access articles published, all supplemental material carries a non-exclusive license, and permission requests for re-use of supplemental material or any part of supplemental material shall be sent directly to the copyright owner as specified in the copyright notice associated with the article.