
Abstract
Aurora A kinase is a key regulator of mitosis, which is upregulated in several human cancers, making it a potential target for anticancer therapeutics. Consequently, robust medium- to high-throughput cell-based assays to measure Aurora A kinase activity are critical for the development of small-molecule inhibitors. Here the authors compare measurement of the phosphorylation of two Aurora A substrates previously used in high-content screening Aurora A assays, Aurora A itself and TACC3, with a novel substrate Lats2. Using antibodies directed against phosphorylated forms of Aurora A (pThr288), P-TACC3 (pSer558), and P-Lats2 (pSer83), the authors investigate their suitability in parallel for development of a cell-based assay using several reference Aurora inhibitors: MLN8054, VX680, and AZD1152-HQPA. They validate a combined assay of target-specific phosphorylation of Lats2 at the centrosome and an increase in mitotic index as a measure of Aurora A activity. The assay is both sensitive and robust and has acceptable assay performance for high-throughput screening or potency estimation from concentration–response assays. It has the advantage that it can be carried out using a commercially available monoclonal antibody against phospho-Lats2 and the widely available Cellomics ArrayScan HCS reader and thus represents a significant addition to the tools available for the identification of Aurora A specific inhibitors.
Keywords
Introduction
A
It remains unclear whether there are therapeutic advantages to selectively targeting one Aurora kinase over the other, and therefore the development of both selective and combined small-molecule inhibitors of Aurora A and B is being actively pursued in parallel. The high degree of structural similarity within the catalytic domain of Aurora A and B has made the generation of selective adenosine triphosphate (ATP)–competitive inhibitors a challenging task, and those that have been described typically exhibit a concentration window of selectivity above which they become dual inhibitors. For example, the Aurora A–selective inhibitor MLN8054 is selective for Aurora A in cells up to approximately 1 to 2 µM but, at higher concentrations, also inhibits Aurora B. 3 Consequently, robust medium- to high-throughput cell-based assays to measure Aurora A and Aurora B kinase activity are critical for the development of small-molecule inhibitors against these targets. Automated microscope-based, high-content screening (HCS) assays are rapidly becoming the technology of choice for high-throughput cytological profiling, as they can extract detailed information at the single cell level more efficiently and effectively than flow cytometry or plate reader–based approaches.7,8 The wide availability of robust and specific antibodies against the phosphorylated Aurora B substrate histone H3 (Ser10), which produce an intense chromatin-wide signal, has enabled the measurement of this marker by HCS to become the standard approach to measuring Aurora B cellular activity. 9 In contrast, the development of HCS assays to measure phosphosubstrates of Aurora A has proved more difficult as these substrates are usually restricted to the centrosomes of mitotic cells, making image analysis challenging. Nevertheless, two reports from Millennium Pharmaceuticals (Cambridge, MA) initially demonstrated the feasibility of HCS to measure markers of Aurora A activity at the centrosome; one measured autophosphorylation of the Thr288 residue of Aurora A itself, 3 and the other measured the translocation of TACC3, which is recruited to the centrosome after phosphorylation of Ser558 by Aurora A. 10 However, these assays employed antibodies or proprietary analytical software that are not currently commercially available, making their adoption in other labs difficult. Hence, there continues to be a reliance on low-throughput methods such as Western blotting and manual qualitative immunofluorescence analysis to assess the activity of Aurora A. Therefore, there is a critical need for the development of validated HCS assays using commercially available software and antibodies to measure the cellular activity of Aurora A. Here, we investigated the suitability of three markers of Aurora A activity at the centrosome, P-AurA, P-TACC3, and P-Lats2 for the development of an HCS assay using the Cellomics ArrayScan platform (Cellomics, Pittsburgh, PA). The most robust assay developed consisted of measurement of P-Lats2 at the centrosome using a commercially available mouse monoclonal antibody, combined with measurement of a mitotic index, which is a mechanistic marker of Aurora A activity.
Materials And Methods
Antibodies
Anti-pT288 Aurora A was purchased from Bethyl Laboratories (Montgomery, TX), anti-pS83 Lats2 from CycLex (Nagano, Japan), and anti-MPM2 or Texas Red–conjugated anti-MPM2 from Upstate (Millipore, Billerica, MA). A custom phosphospecific P-S558-TACC3 antibody was raised and purified against a previously described phosphopeptide sequence 11 by Moravian Biotechnology (Brno, Czech Republic). Alexa Fluor 488 and Alexa Fluor 546 conjugated secondary antibodies were purchased from Invitrogen (Carlsbad, CA).
Immunocytochemistry
HeLa cells were grown in Dulbecco’s modified Eagle’s medium (DMEM) supplemented with 10% fetal bovine serum and plated at a density of 10 000 cells/well in 96-well plates (clear/black ViewPlate; Perkin Elmer, Waltham, MA). Compound was added 16 h later for 7 h; all treatments were done in triplicate. Cells were fixed in cold methanol for 8 min followed by three washes in phosphate-buffered saline (PBS). Cells were then incubated for 30 min in PBS containing 0.2% cold water fish skin gelatin (FSG; Sigma, St. Louis, MO), then stained with antibodies to MPM2 (1:1000) and phospho–Aurora A or phospho-TACC3 (both at 1:500) or with antibody to phospho-Lats2 alone (1:500). All antibody dilutions were carried out in 0.2% FSG. Antibodies were then detected with goat anti-rabbit IgG conjugated to Alexa Fluor 488 (1:300) and goat anti-mouse IgG conjugated to Alexa Fluor 546 (1:300) for the P-AurA and P-TACC3 assays or goat anti-mouse IgG conjugated to Alexa Fluor 488 (1:300) for the P-Lats2 assay, all diluted in 0.2% FSG with 300 nM DAPI (Cambridge Bioscience, Cambridge, UK). Cells stained with anti-phospho-Lats2 were further stained with antibody to MPM2 conjugated with Texas Red (1:500).
Imaging and analysis
Image acquisition in three channels was carried out using an ArrayScan II HCS Reader from Cellomics. Image analysis was performed using the Cell Health Profiling V2 Bioapplication, supplied with the ArrayScan II HCS Reader. A 20× 0.4 NA objective was used for imaging. DAPI was used to identify and count individual nuclei in channel 1. One hundred mitotic cells per well (or 50 fields) were counted using object selection parameters to select only MPM2-positive cells, which typically had an average intensity of MPM2 staining (channel 3) approximately 8- to 10-fold higher than interphase cells. In channel 2, the nuclear mask was first expanded using a TargetCirc-ModifierCh3 value of 3, then eroded using a user-defined fluorescence intensity threshold, to enable identification of the centrosomes. Average pixel intensity for P-Lats2 staining was measured for each individual cell, and then a mean per cell was calculated for each well. The critical well-level output parameters reported by the Cell Health Profiling Bioapplication were %SelectedCells (i.e., percentage cells MPM2 positive) and Mean TargetAvgIntenCh2. IC50 and EC50 values were calculated from four-parameter or biphasic dose–response curves that were fitted using XLfit (IDBS, Guildford, UK) or Prism (GraphPad Software, La Jolla, CA).
Results And Discussion
Validation of immunofluorescence-compatible antibodies for phosphorylation targets of Aurora A
To develop a high-content assay to quantify Aurora A inhibition, three phosphorylation targets of Aurora A in mitosis were assessed in parallel for their potential to act as markers of Aurora A kinase activity: TACC3 (Ser558), Lats2 (Ser83), and the autophosphorylation site of Aurora A (Thr288) ( Fig. 1A ). We purchased off-the-shelf rabbit polyclonal pT288-Aurora A and mouse monoclonal pS83-Lats2 antibodies and had a rabbit polyclonal pS558-TACC3 antibody custom made because none were commercially available. The suitability of these antibodies for immunofluorescence was assessed in HeLa cells, which were fixed, stained with antibody, and then counterstained with DAPI to enable visualization of the nuclei and identification of mitotic cells ( Fig. 1B ). This showed the staining for all three marker antibodies to be exclusively localized to the spindle poles of mitotic cells and absent from interphase cells. This is consistent with the staining pattern obtained previously for pT288-Aurora A and pS558-TACC3 using different antibodies3,11 and for pS83-Lats2 using the same mouse monoclonal antibody. 12 These results confirmed the suitability of these antibodies for use in the development of a high-content immunofluorescence assay.
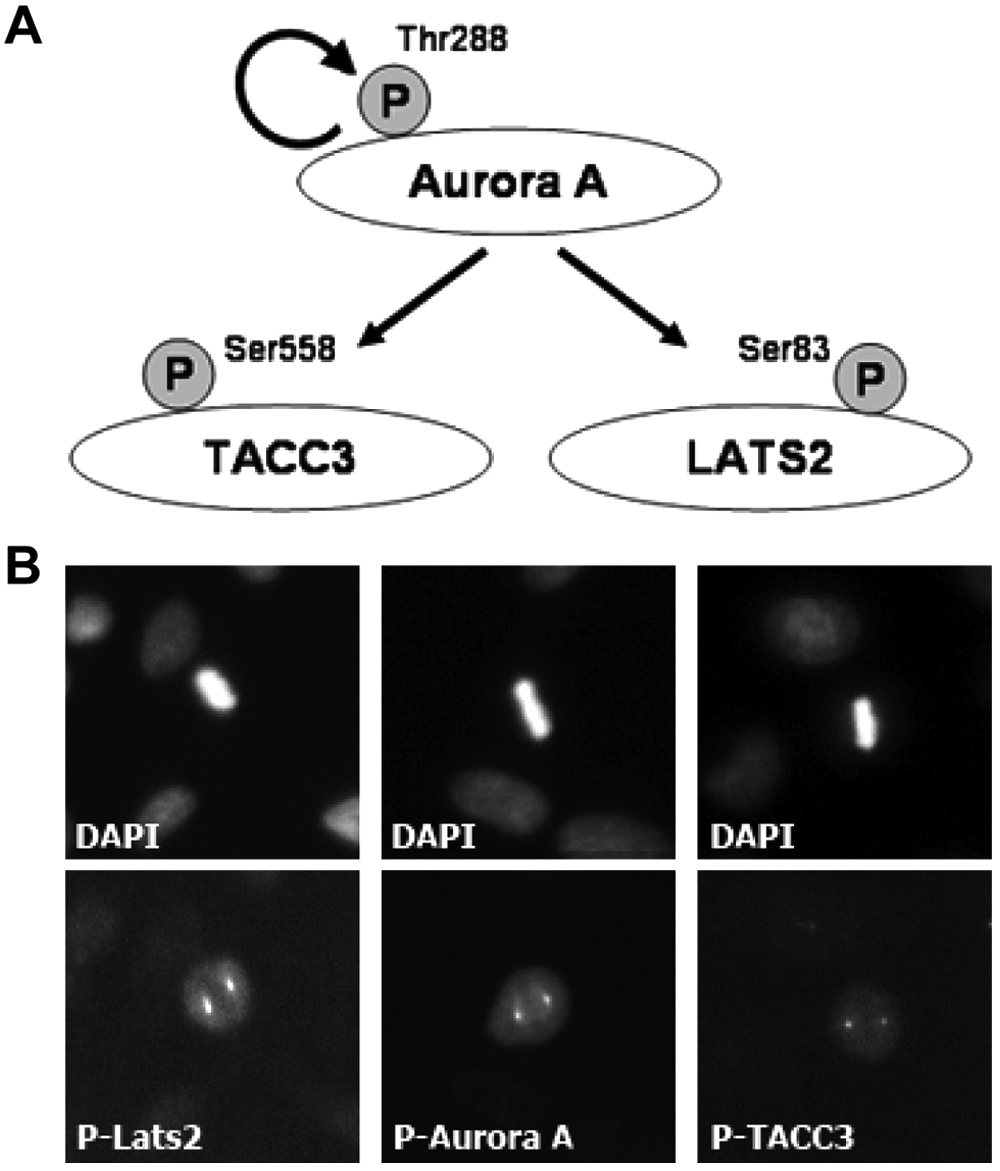
Preliminary characterization of potential Aurora A activity markers. (
Image acquisition and analysis of markers at the centrosomes of mitotic cells
We used a Cellomics ArrayScan HCS Reader as the platform for development of the assay. This system consists of a fully automated fluorescence microscope with integrated image analysis software and plate handling, making it amenable to medium-throughput screening. We established the assay in a 96-well format using HeLa cells, which were chosen after a preliminary analysis of a panel of adherent cell lines (data not shown) because of their relatively flat morphology. This means the mitotic spindle typically forms parallel to the cell culture surface, which maximizes the likelihood of both mitotic centrosomes being in the same focal plane during image acquisition. As all three potential activity markers are found only in mitotic cells, which typically comprise only 3% to 4% of an asynchronous HeLa cell population, it was critical to identify the mitotic subpopulation to be able to detect measurable changes in marker staining intensity ( Fig. 2 ). To identify mitotic cells, we used a monoclonal antibody to MPM2, which is a phosphoepitope generated in mitosis and commonly used to identify mitotic cells by immunofluorescence ( Fig. 2 ). Therefore, in the final assay, cells were fixed and stained with the MPM2 and the phosphospecific Aurora A substrate antibodies and then counterstained with DAPI. Images were acquired using the 20× objective lens and analyzed using the integrated Cell Health Profiling Bioapplication software ( Fig. 2 ). Individual cells were identified in channel 1 using a nuclear mask based on DAPI staining, and the mitotic subpopulation was identified and selected for further analysis by applying a minimum MPM2 intensity threshold in channel 3. The intensity of phosphoantibody staining (channel 2) in mitotic cells was then determined by applying a minimum intensity threshold, which restricted the measurement of fluorescence intensity to the centrosomes.
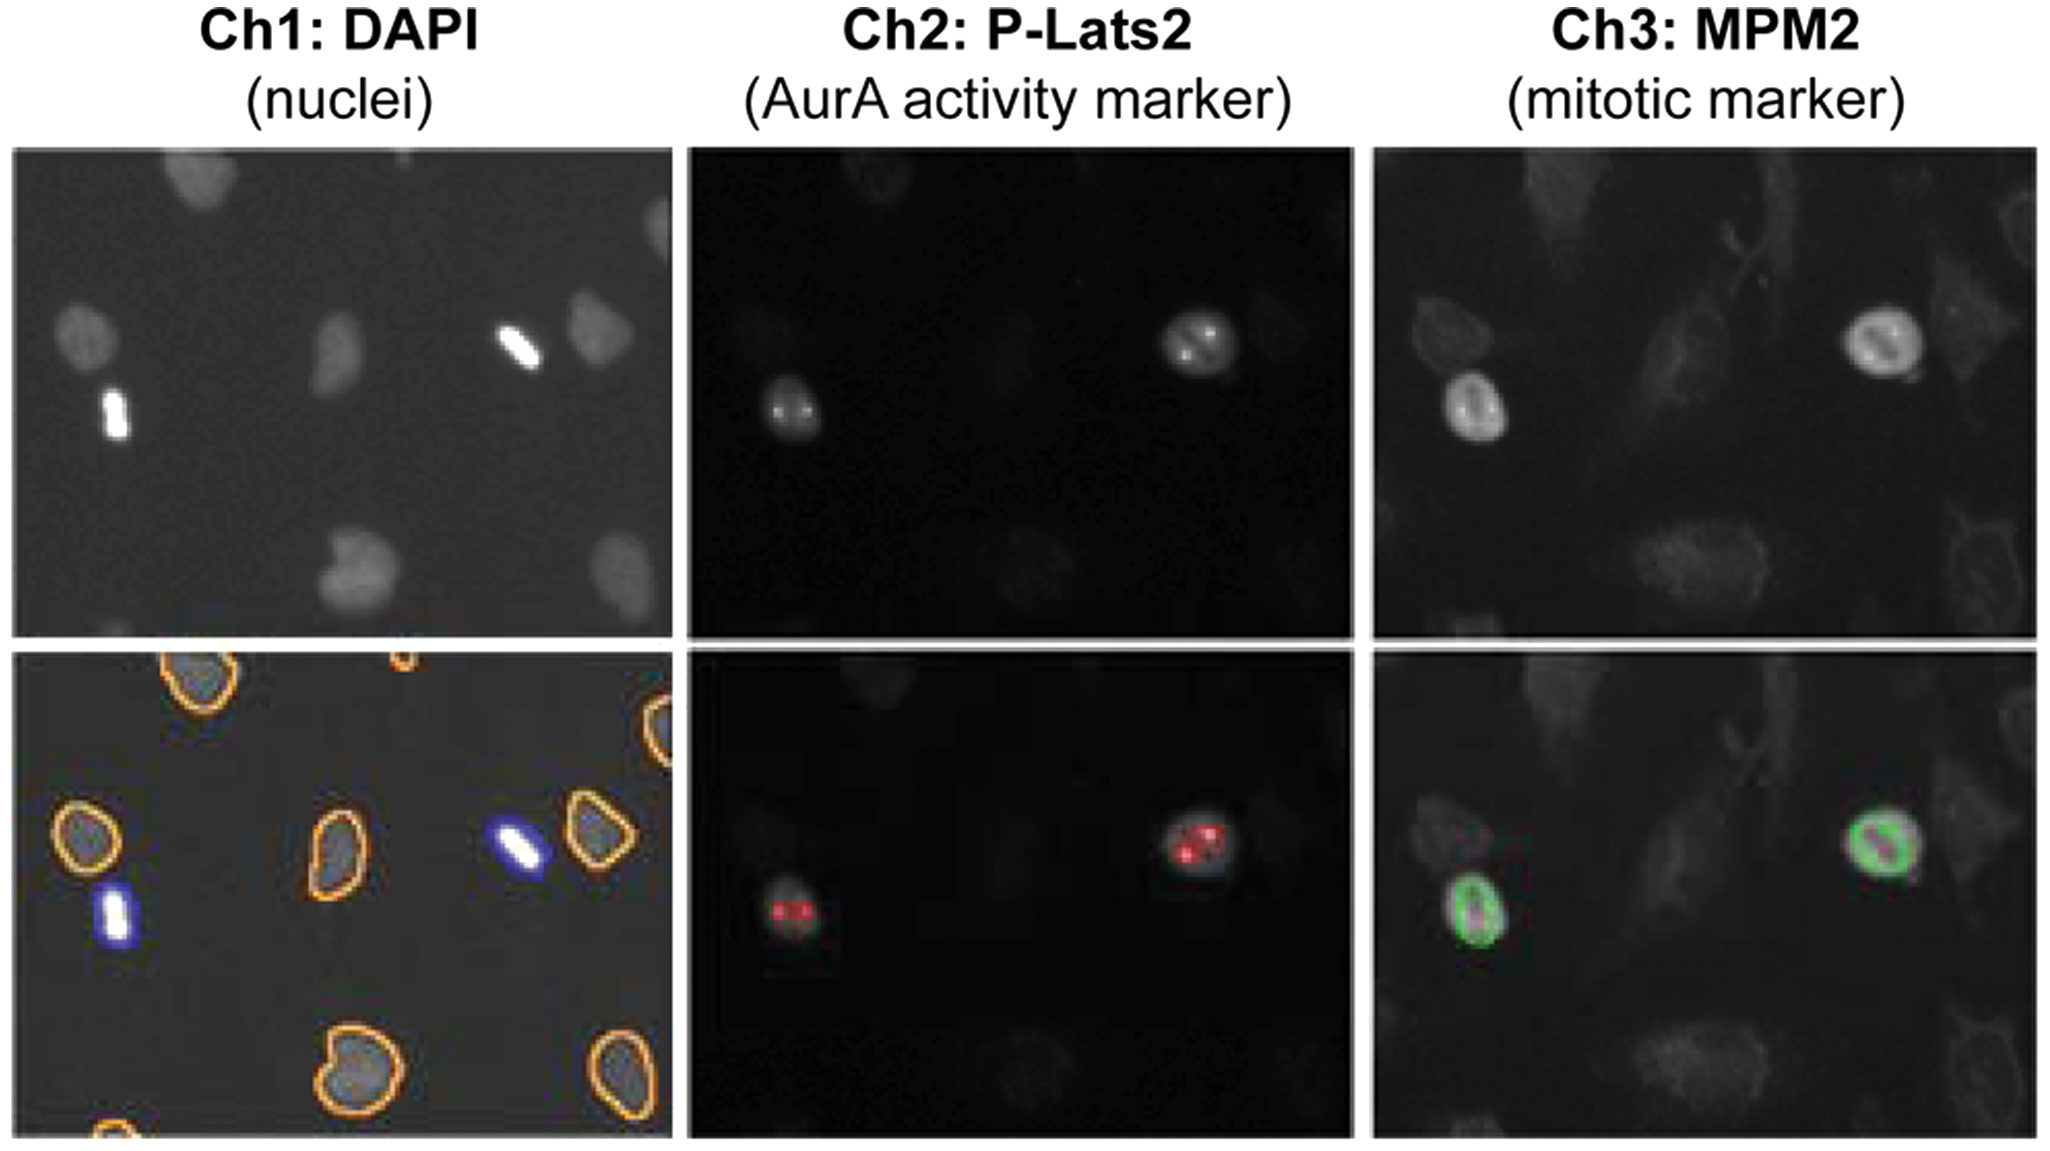
Development of an Aurora A activity assay on the Cellomics ArrayScan with application of user-defined intensity thresholds. Cells were fixed and stained with DAPI and antibodies to P-Lats2 and MPM2. Images were acquired in three channels using the 20× objective and analyzed using the Cell Health Profiling Bioapplication. Individual cells were identified in channel 1 using a nuclear mask based on DAPI staining (shown as orange or blue outlines). Cells were then selected for further analysis by applying a minimum-intensity threshold for mitotic cells in channel 3 (green outlines). Selected cells (i.e., MPM2 positive) are marked in channel 1 by a blue outline; rejected cells are shown in orange. Finally, an intensity threshold was applied in channel 2 to limit measurement of P-Lats2 staining intensity to spots of high intensity, that is, the centrosome (red outlines).
P-Lats2, P-AurA, and P-TACC3 antibodies are equally sensitive markers of Aurora A activity
To assess the sensitivities of the three markers to Aurora A inhibition, we determined the dose–response relationship for the reference small-molecule Aurora A inhibitor VX680 (MK-0457) 13 after a 7-h exposure ( Fig. 3 ). All three markers showed a dose-dependent decrease in intensity in response to VX680 ( Fig. 3A – C ), which was confirmed by visual inspection of the raw images ( Fig. 3E ). In contrast, the levels of a centrosomal marker, gamma tubulin, remained relatively constant. This indicates that our measurement of the decrease in levels of phosphorylated Aurora A substrates reflects a decrease in kinase activity rather than a nonspecific effect resulting from loss of centrosomal integrity ( Fig. 3D ). P-AurA and P-Lats2 yielded monophasic sigmoidal dose–response curves, and the IC50 values for inhibition of staining showed them to be equally sensitive to Aurora A inhibition and correlated well with the concentration-dependent inhibition of P-AurA as measured using a Western blot–based assay ( Table 1 ; data not shown). In contrast, P-TACC3 exhibited a biphasic dose–response curve, but the IC50 calculated from the first phase suggested it was as sensitive a marker of Aurora A inhibition as P-AurA and P-Lats2 ( Table 1 ; Fig. 3C ).
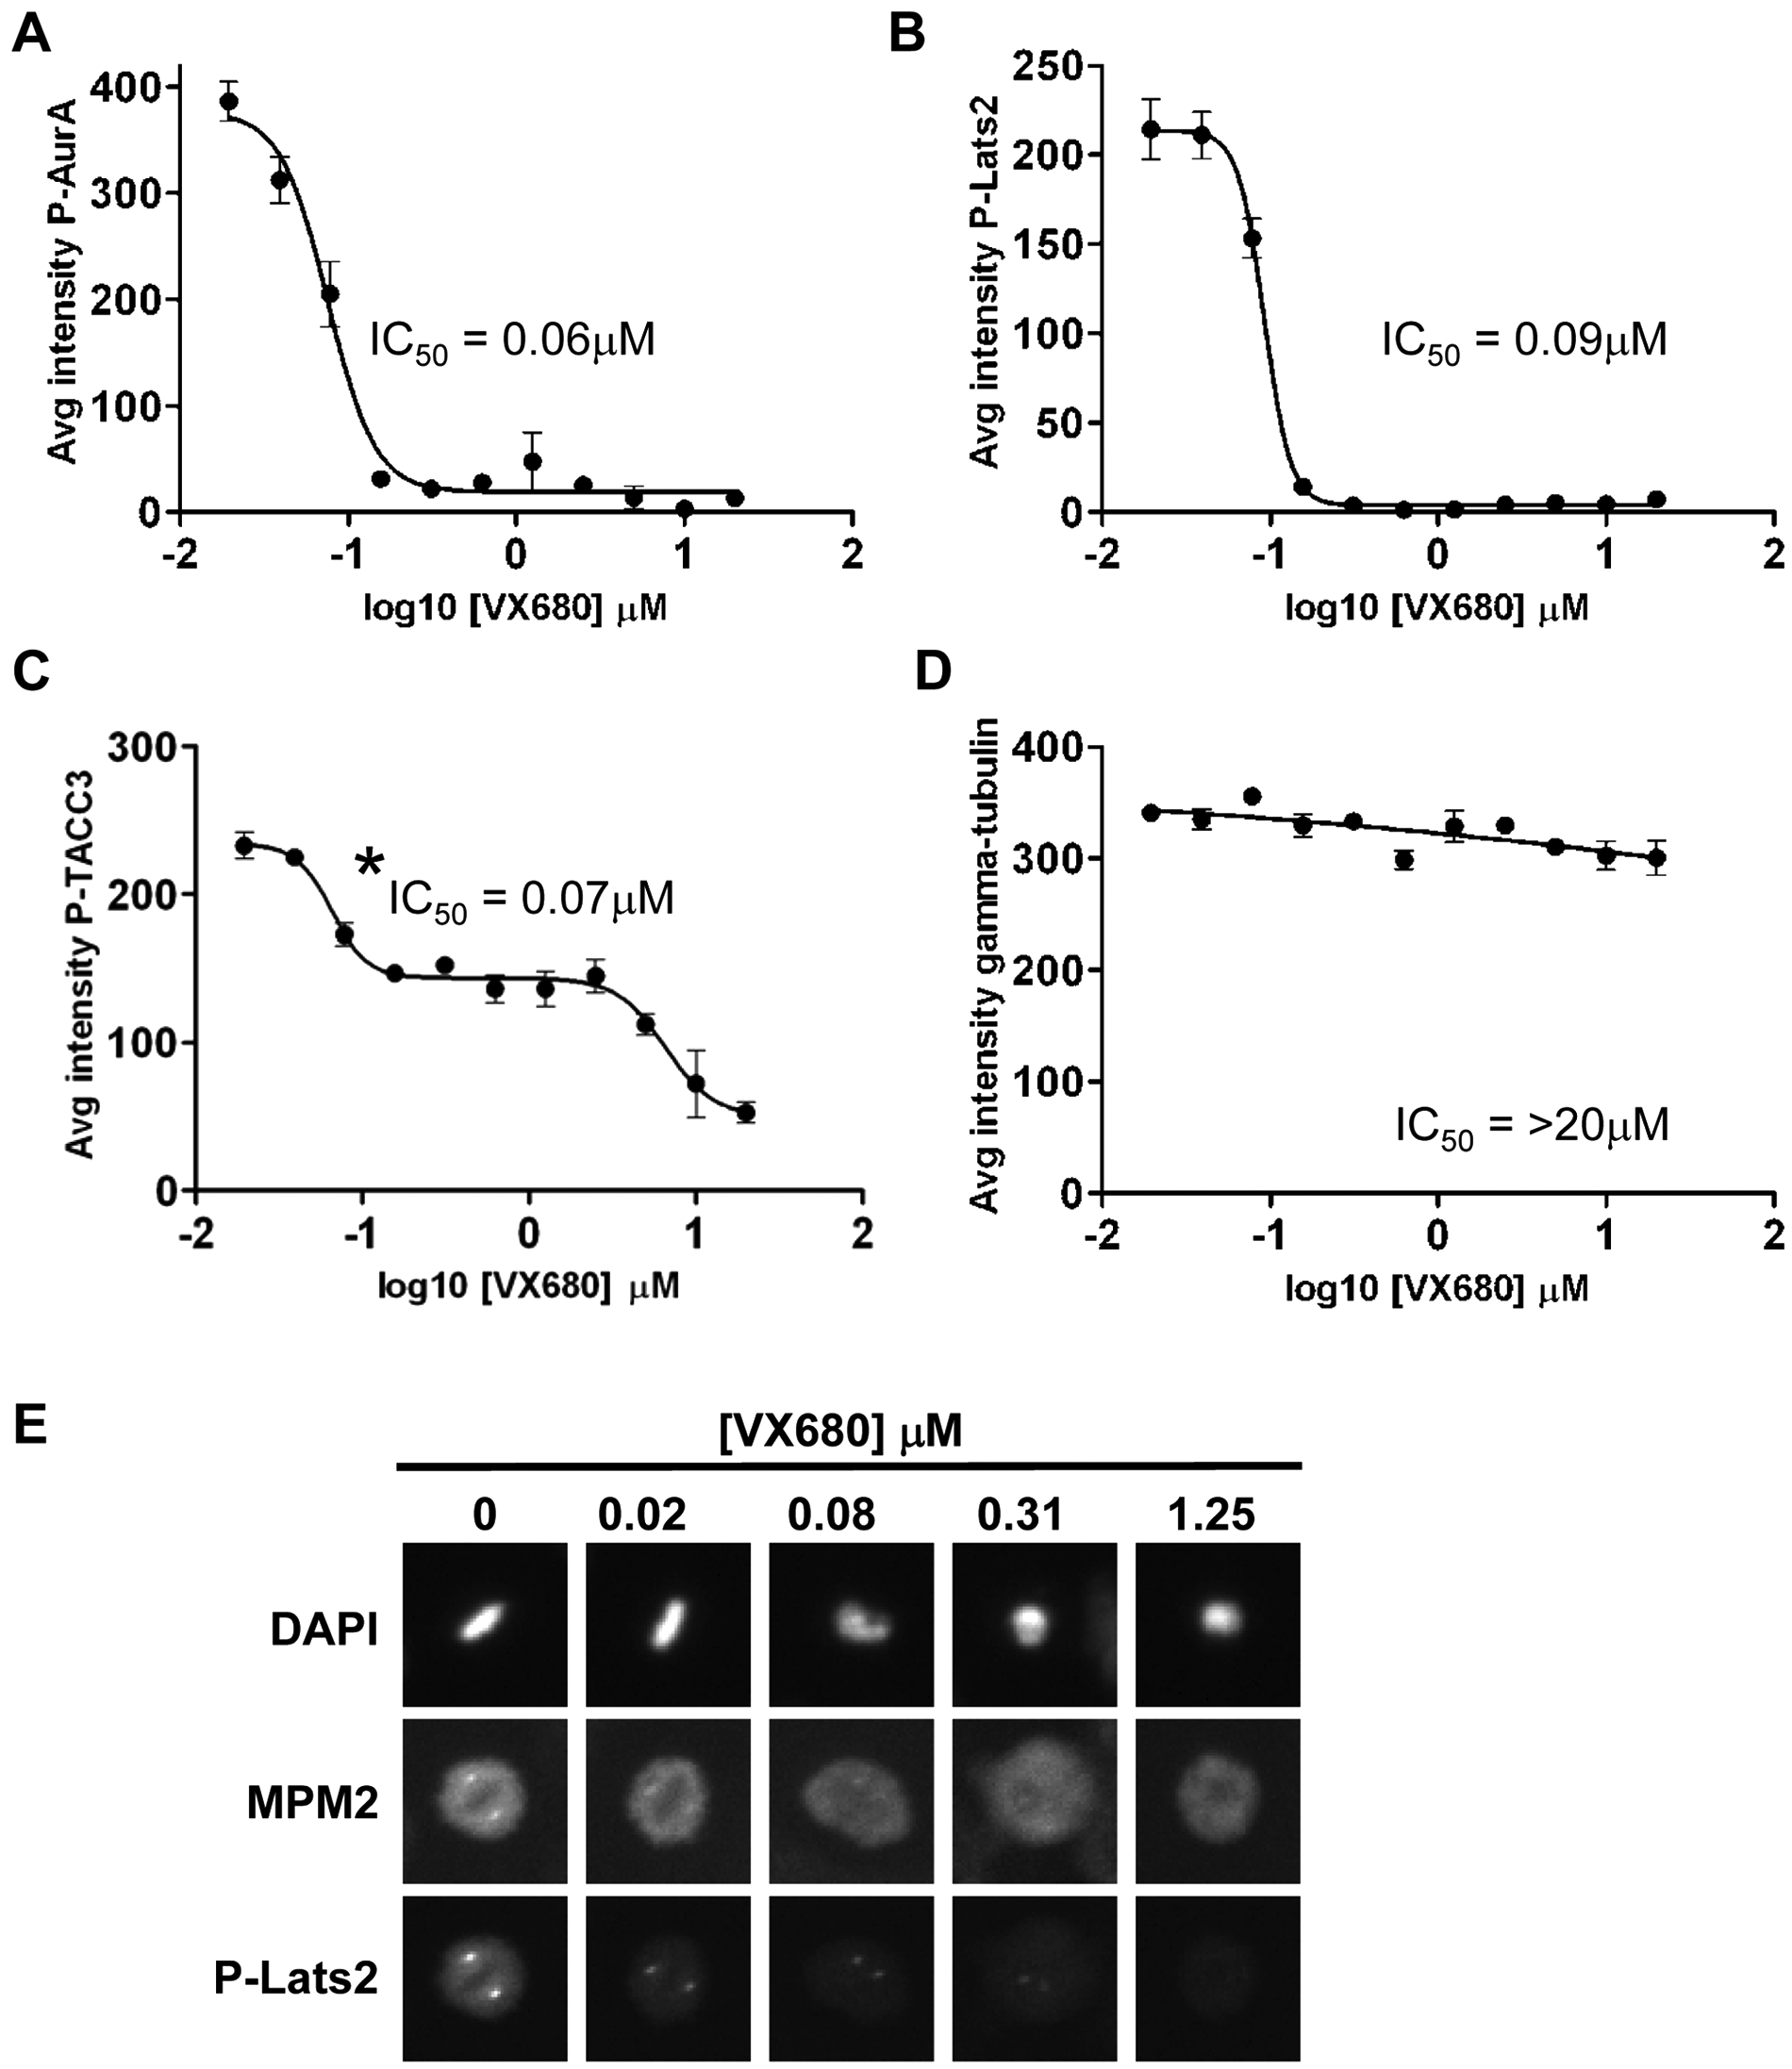
Dose-dependent effects of VX680 on intensity of Aurora A activity markers at the centrosome. Average intensity of staining per cell in channel 2 is shown for each of four centrosomal proteins: (
Comparison of Assay Validation Statistics for Three Markers of Aurora A Activity
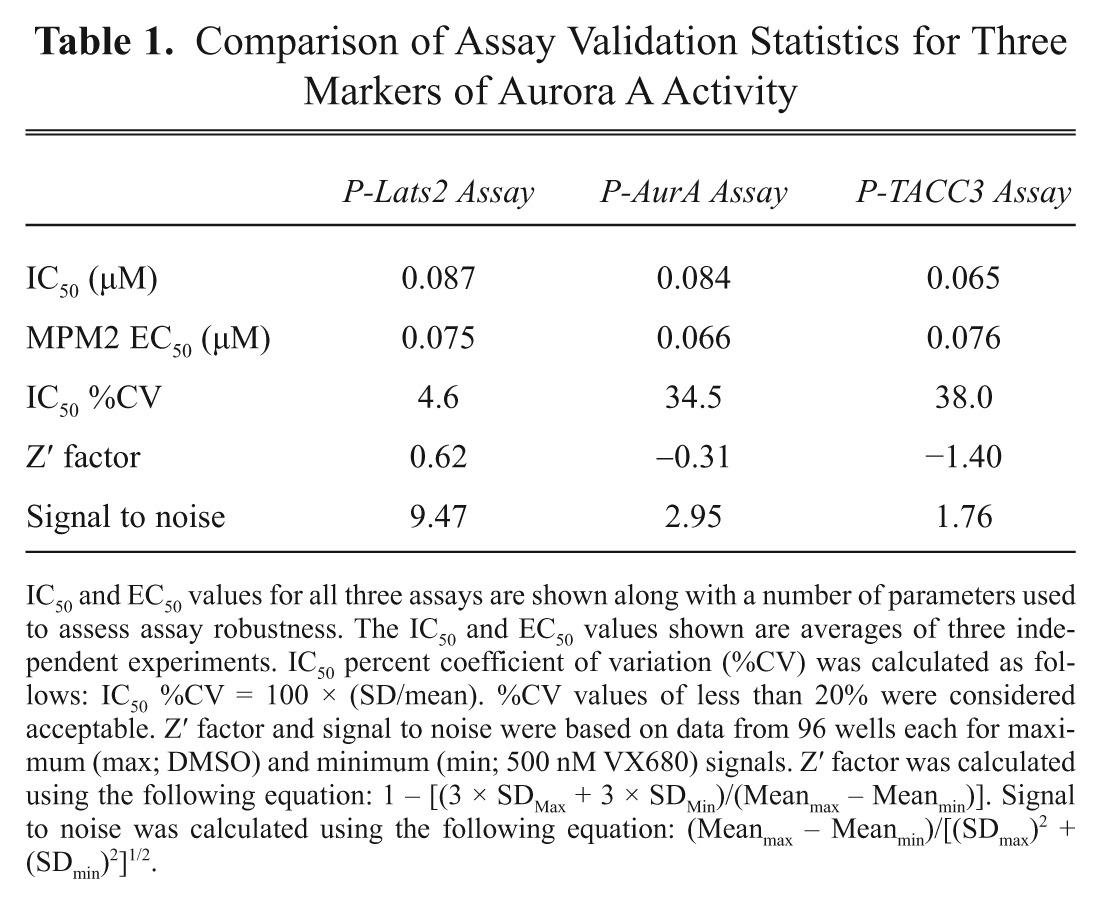
IC50 and EC50 values for all three assays are shown along with a number of parameters used to assess assay robustness. The IC50 and EC50 values shown are averages of three independent experiments. IC50 percent coefficient of variation (%CV) was calculated as follows: IC50 %CV = 100 × (SD/mean). %CV values of less than 20% were considered acceptable. Z′ factor and signal to noise were based on data from 96 wells each for maximum (max; DMSO) and minimum (min; 500 nM VX680) signals. Z′ factor was calculated using the following equation: 1 – [(3 × SDMax + 3 × SDMin)/(Meanmax – Meanmin)]. Signal to noise was calculated using the following equation: (Meanmax – Meanmin)/[(SDmax)2 + (SDmin)2]1/2.
The inclusion of MPM2 in the assay also enabled us to quantify the effects of VX680 on the mitotic index, which is a mechanistic marker for Aurora A inhibition. 3 The close similarity between the IC50 values for P-AurA, P-Lats2,and P-TACC3 with the MPM2 EC50 further validates all three as being sensitive markers of Aurora A inhibition ( Table 1 ). To confirm that the reduction in marker staining was specific for Aurora kinase inhibition and not an indirect consequence of the VX680-induced mitotic delay, we tested nocodazole, a microtubule-binding agent with no Aurora inhibitory activity, in the assay. As expected, this was a potent inducer of mitotic arrest (MPM2 EC50 = 32 nM) but had no effect on the staining intensity of any of the three Aurora A markers (data not shown), which shows that mitotic arrest per se does not interfere with the level of these markers in HeLa cells.
P-Lats2 gave the most robust HCS Aurora A activity assay
A number of standard assay performance statistics were calculated for the use of each of the three markers in the HCS assay with VX680 ( Table 1 ). The Z′ factor and signal-to-noise ratio were calculated as measures of an assay’s robustness for use in single-concentration high-throughput screening (HTS), with Z′ > 0.5 being considered ideal for screening. 14 Only the P-Lats2 assay generated a Z′ factor within the acceptable range; in addition, it gave a markedly higher signal-to-noise ratio compared to either P-Aurora A or P-TACC3. To compare the reproducibility of the three markers for potency estimation from concentration–response experiments, we determined the percent coefficient of variation (%CV) for IC50 calculated from three independent replicate experiments ( Table 1 ). This showed that the P-Lats2-based HCS assay was far more reproducible compared to P-AurA or P-TACC3 and that it was the only assay with a CV <20%, which is typically considered desirable. Therefore, we conclude that the HCS Aurora A activity assay based on the P-Lats2 antibody is the most robust assay of the three.
To further evaluate the P-Lats2 assay, we tested two other commercially available reference Aurora kinase inhibitors—the Aurora A–selective MLN8054 3 and the Aurora B–selective AZD1152-HQPA, which is the active metabolite of the prodrug AZD1152. 15 As expected, we found that MLN8054 inhibited the phosphorylation of Lats2 with an IC50 of 0.33 ± 0.06 µM (mean ± SD; n = 3), which correlated well with its ability to increase the mitotic index (MPM2 EC50 = 0.25 ± 0.10 µM), whereas AZD1152-HQPA was a poor inhibitor of P-Lats2 (IC50 ranged from 5.6 to >20 µM) and had little effect on the mitotic index (MPM2 EC50 ranged between 7.5 and >20 µM). This further confirms P-Lats2 as a specific marker of cellular Aurora A activity.
Discussion
In this study, we compared three potential markers of Aurora A activity for the development of a cell-based HCS assay for the identification of small-molecule Aurora A inhibitors, using the Cellomics ArrayScan HCS platform. The best-performing assay was based on the detection of P-Lats2 at the centrosome of mitotic cells, which is sufficiently robust to be suitable for use in either single-concentration HTS screening or potency estimation from concentration–response experiments. HCS platforms are ideally suited to this type of subpopulation analysis, which avoids the need for cell cycle synchronization as would be required for cell population–based techniques such as immunoblotting. To identify the mitotic subpopulation, we used a monoclonal antibody to MPM2, which was the approach previously taken for the successful development of an HCS-based P-AurA assay. 3 This was in preference to using an antibody against phosphohistone H3 (ser10), another commonly used mitotic marker, which is generated by Aurora B kinase activity and therefore subject to inhibition and hence assay interference by most of the small-molecule inhibitors likely to be profiled in the assay. 9 The inclusion of MPM2 staining in the assay had the additional benefit that the effects of an inhibitor on the mitotic index could be monitored simultaneously, thereby providing a secondary mechanistic marker for Aurora A inhibition. To our knowledge, this is the first description of an HCS-based Aurora A activity assay using P-Lats2 as a marker. Moreover, the demonstration that pharmacological inhibition of Aurora A suppresses the phosphorylation of Lats2 on Ser83 corroborates the original report describing Lats2 as a phosphorylation target of Aurora A based on biochemical approaches. 12 To our knowledge, no other kinases are known to phosphorylate Ser83, and therefore this assay is likely to be highly specific for the identification of small-molecule Aurora A inhibitors in HTS screens.
The previously reported HCS assay based on the measurement of P-AurA at the centrosomes in mitotic cells used P-T288–AurA antibodies that are not currently commercially available. 3 We tested a commercially available P-T288–AurA antibody and found it to be as sensitive a marker of Aurora A activity as the P-Lats2 antibody; however, compared to P-Lats2, the HCS assay based on P-AurA failed to meet the necessary robustness criteria for routine use to profile compounds. No detailed assay robustness statistics (e.g., Z′ factor) were reported for the published P-AurA assay, 3 and therefore it is unclear whether the variability we detected was related to the antibody or some intrinsic property of the marker itself. The previously reported HCS assay based on the translocation of TACC3 to the centrosomes of mitotic cells used a commercially available (non-phospho-specific) TACC3 antibody in conjunction with a custom-made software program ProGuru, which is not commercially available. 10 We tested a custom-made P-TACC3 antibody and found that the level of staining at the centrosomes decreased in a dose-dependent manner in response to Aurora A inhibition with sensitivity similar to that observed for P-AurA and P-Lats2. This is consistent with the published TACC3 relocation assay, which also showed very similar levels of sensitivity to a P-AurA-based assay. 10 However, in contrast to P-Lats2 and P-AurA, the P-TACC3 assay exhibited a biphasic dose–response curve in response to VX680, with one intriguing potential explanation for this being the existence of a second kinase that contributes to the phosphorylation of Ser558, which is inhibited at higher VX680 concentrations. In contrast to the P-Lats2 assay, the P-TACC3 assay failed to meet the necessary assay criteria for robustness and is therefore not suitable for use in the routine profiling of compounds.
The assay we describe is suitable for automation, and we will demonstrate its use as part of a screening cascade for Aurora A inhibitors elsewhere. One advantage of the P-Lats2 HCS assay over the two previously published assays is that all the assay components are commercially available—it uses an off-the-shelf P-Lats2 mouse monoclonal antibody and the analysis software integrated into the Cellomics ArrayScan, which is a widely available HCS platform. Moreover, the image analysis is straightforward and should be easy to replicate using the software integrated with other HCS platforms or with freestanding packages such as Metamorph. Assessment of the phosphorylation status of Lats2 is likely to extend beyond its use in an assay, and we note that it provides powerful potential as a pharmacodynamic marker to assess the efficacy of Aurora A inhibitors in both preclinical and clinical studies.
Footnotes
Acknowledgements
This work was funded by Cyclacel Pharmaceuticals.