
Abstract
This study describes the evaluation, validation, and use of contactless postcolumn fractionation of bioactive mixtures with acetylcholine binding protein (AChBP) affinity analysis with help of a spotter technology. The high-resolution fractionation tailors the fractionation frequency to the chromatographic peaks. Postcolumn reagents for AChBP bioaffinity profiling are mixed prior to droplet ejection into 1536-well plates. After an incubation step, microplate reader analysis is used to determine bioactive compounds in a mixture. For ligands tested, a good correlation was found for IC50s determined in flow injection analysis mode when compared with traditional radioligand binding assays. After the evaluation and validation, bioaffinity profiling of actual mixtures was performed. The advantage of this “atline” technology using postcolumn bioaffinity analysis when compared to continuous flow online postcolumn bioaffinity profiling is the possibility to choose postcolumn incubation times freely without compromising resolution due to diffusion effects.
Keywords
Introduction
We now describe the evaluation, validation, and use of contactless postcolumn fractionation of bioactive mixtures with acetylcholine binding protein (AChBP) 10 affinity analysis with help of this spotter technology. AChBP is a structural analogue of the extracellular ligand-binding domain of nicotinic acetylcholine receptors (nAChRs) that constitute potential pharmaceutical targets against pain relief, Alzheimer disease, Parkinson disease, epilepsy, anxiety, and several cognitive and attention deficits.11–15 AChBP displays comparable ligand pharmacology to the α7 nAChR in particular14,15 and originates from mollusks. Since the first crystal structure was published in 2001, 16 it has become a target to identify novel ligands for nAChRs. We chose to use the AChBP biochemical assay format in the high-resolution spotted offline mode instead of the recently described online format 10 because the offline format has the capability of identifying compounds with slow binding kinetics (e.g., a low kon), which rely upon and necessitate long incubation times for binding.
The setup as shown in Figure 1 was used where the biochemical AChBP assay constituents were directed into the spotter via 2 prespotter connected superloops. For this, the LC eluent was mixed with AChBP and tracer ligand DAHBA (based on fluorescence enhancement) prior to spotting into a 1536-well microtiter format for subsequent biochemical affinity plate reader readout. Parallel MS detection was performed for identification of bioactive compounds in mixtures.
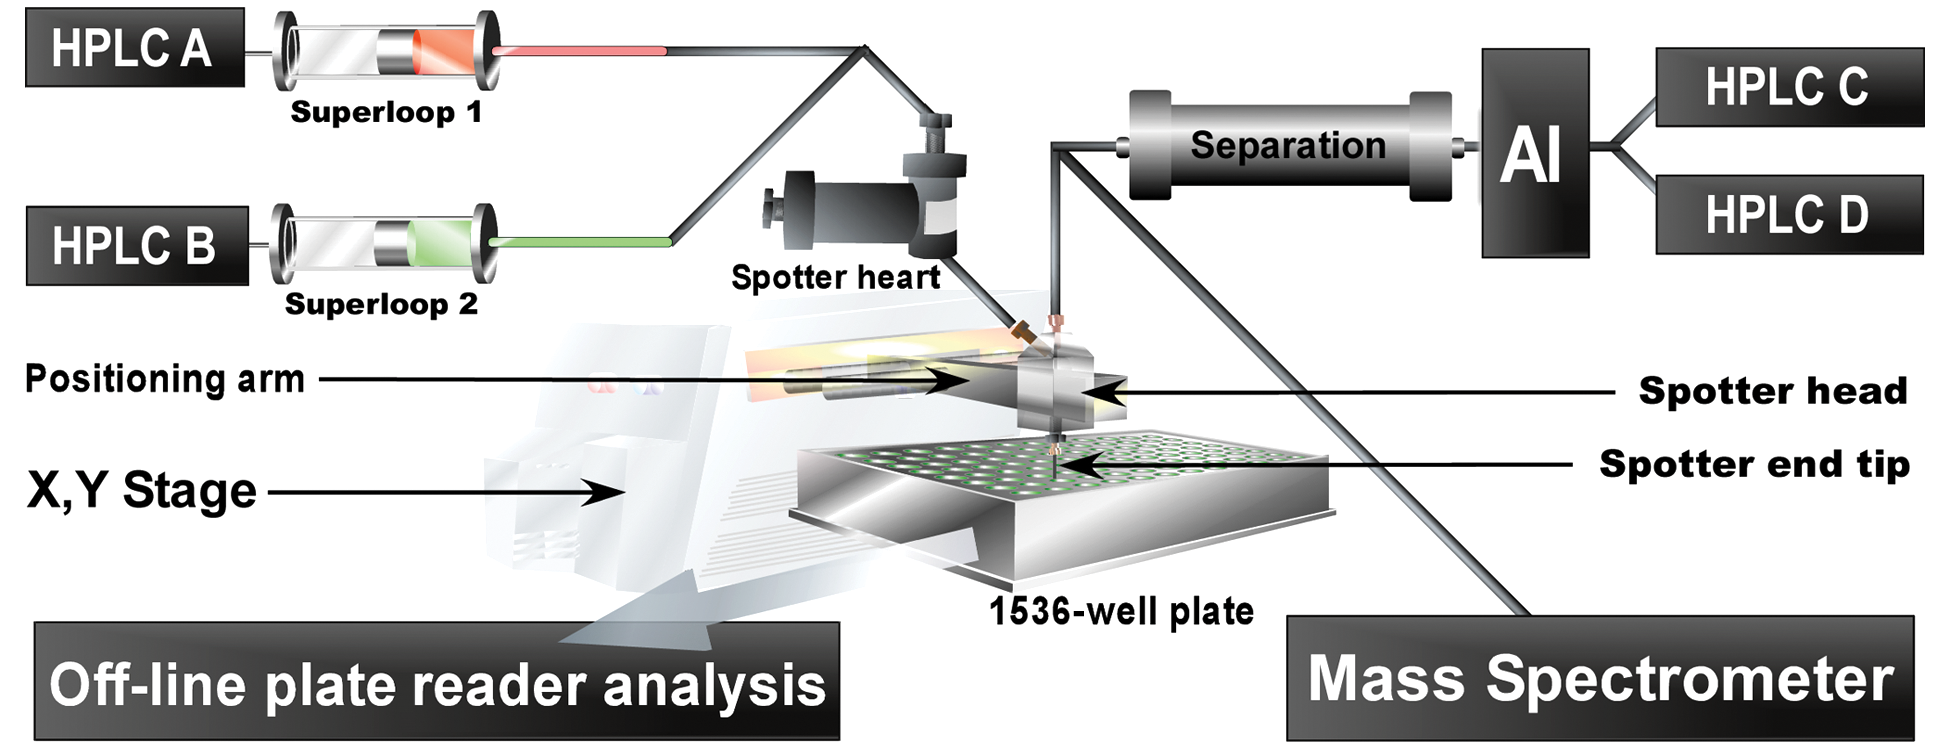
Schematic view of the setup. High-performance liquid chromatography (HPLC) pump C and D provide a gradient LC separation followed by a split to MS and the postcolumn contactless spotter technology. The spotter heart mixes acetylcholine binding protein (AChBP) and tracer ligand DAHBA and provides the pulses (via a rapid hammering device) for the actual spotting process. For the spotting process, the mixed-in DAHBA and AChBP (housed in superloop 1 and 2, respectively, and operated by HPLC pump A and B) are pulsed into the spotter head, where they are mixed in with LC eluent and subsequently spotted via the spotter end tip into a 1536-well plate. After incubation, a plate reader is used for bioaffinity analysis. AI = autoinjector.
Materials and Methods
Chemicals and reagents
The ligands (1) VUF10537, (2) VUF10536, (3) VUF10942, (4) VUF10541, (5) VUF10539, (6) VUF10663, (7) VUF10751, (8) VUF10709, (9) VUF10710, and (10) VUF10737 were used for this study. The chemical structures of these ligands, including nicotine and epibatidine, are given in Figure 2 . All ligand stock solutions were made in DMSO (10–2M) and stored at -80 °C. The mixture analyzed contained the compounds 6, 7, 8, 9, and 10 in a concentration of 20 µM in 10% methanol (MeOH)/90% water (v/v). Acetonitrile (high-performance liquid chromatography [HPLC] grade), S-nicotine, epibatidine, α-bungarotoxin (batch no. 017K4062 and 056K4113) were from Sigma Aldrich (Zwijndrecht, the Netherlands). Fluorescein and DMSO were purchased from Riedel-de Haën (Seelze, Germany). The synthetic route to 5-(diethylamino)-2-((2-(pyridin-3-yl)-5,6-dihydropyridin-3(4H)-ylidene)methyl)phenol (tracer ligand DAHBA) is described by Kool et al. 10 Enzyme-linked immunosorbent assay (ELISA) blocking reagent (ELISA BR) was from Hoffmann-La Roche (Mannheim, Germany). MeOH (HPLC grade) was from Biosolve (Valkenswaard, the Netherlands), and formic acid was from Merck (Zwijndrecht, the Netherlands).
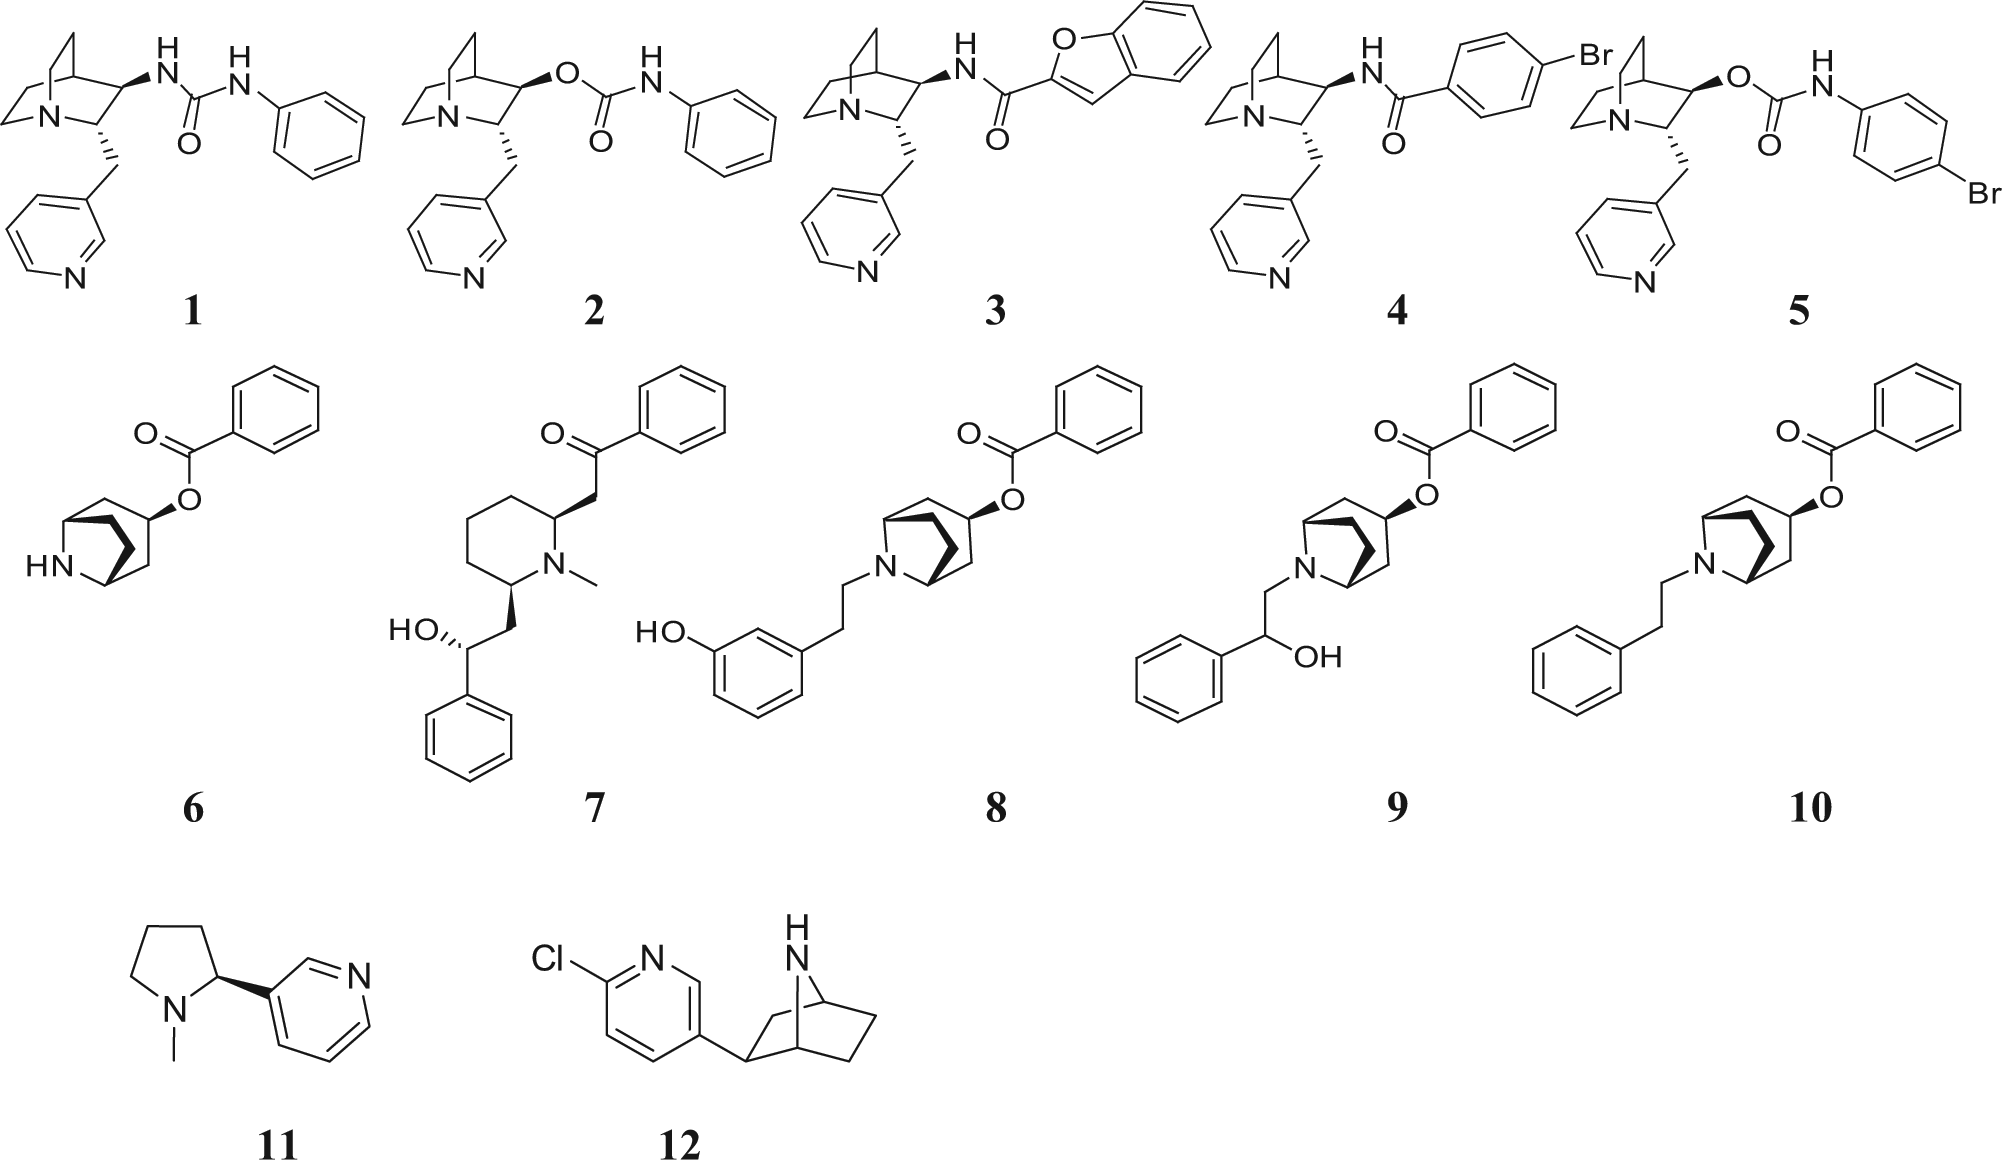
Structures of the ligands used for the study. (1) VUF10537, (2) VUF10536, (3) VUF10942, (4) VUF10541, (5) VUF10539, (6) VUF 10663, (7) VUF10751, (8) VUF10709, (9) VUF10710, (10) VUF10737, (11) nicotine, (12) epibatidine.
Biochemical assay
Baculovirus with the pFastbac I vector in Sf9 insect cells was used for expressing the Ls-acetylcholine binding protein (AChBP; from snail species Lymnaea stagnalis). Expression and purification from the medium is described by Celie et al. 15 The assay is based on the competition of ligands with the tracer ligand DAHBA, which has an increased fluorescence yield in the active site of AChBP. 10 The following TRIS/PBS buffer was used: 1 mM KH2PO4, 3 mM Na2HPO4, 0.16 mM NaCl, and 20 mM Trizma-base at pH 7.5 with 400 mg/L ELISA BR. For operation of the superloops (10 mL in-house–built superloops) delivering the biochemical assay constituents (AChBP and tracer ligand DAHBA), two Shimadzu LC10ADvp pumps (50 µL/min) were used, resulting in continuous delivery of 6.6 nM AChBP (lower superloop) and 150 nM DAHBA (upper superloop) to an inverted Y-shaped mixing piece prior to coupling to the spotter heart. The superloops were kept on ice and operated at a flow rate of 50 µL/min. The LC eluent was postcolumn mixed with the biochemical assay constituents during the spotting process in the black, flat-bottomed 1536-well plates from Brand (Wertheim, Germany). This gave a ratio of postcolumn eluent to assay components of 1:8 in every collected fraction. Incubation of the plates was subsequently done at 4 °C in the dark for 3 h before plate reader analysis with a Victor3 1420 multilabel counter (Perkin Elmer, Wallac, Oy, Finland). As readout time per well, 0.1 s with excitation and emission filters of 485 nm and 535 nm, respectively, were used. The signals recorded from all wells were finally used for construction of bioaffinity chromatograms in Excel.
Apparatus
Spotter
A detailed description of the spotter technology and connection to the whole setup is given by Kool et al. 9 In short, the key of the spotter technology is the hitting of a flexible section in flow-through tubing by a rod-shaped hammering device positioned in the magnetic switch part of a solenoid valve. The size/volume of the ejected droplets is controlled by the hammering frequency and the inner diameter of the spotter outlet tube (PEEK or fused silica). The spotter head is fitted to the robotic arm (at the Z-stage) of a modified Gilson 234 autoinjector (Middleton, WI). Here, the spotter was operated at a droplet ejection frequency of 3 Hz with ˜0.5 µL per droplet ejected with fractions of 2 s, thus having six droplets (3 µL) spotted per well.
Spotter performance with 1536-well microtiter plates
For evaluating the performance and repeatability of the spotting process in 1536-well microtiter plates, in comparison to the performance and repeatability of the actual plate reader analysis, three different experiments were conducted. For this, 30 nM fluorescein in phosphate buffer (100 mM; pH 7.4) was used. First, the fluorescein solution was directly spotted onto 1536-well microtiter plates using the setup ( Fig. 1 ) in eluent infusion mode (without the LC column) and operating only one superloop with the fluorescein solution. Second, 1536-well microtiter plates were filled by using a contact-based flow-fractionation approach similar to the one described by Giera et al. 8 also in the eluent infusion mode. Third, 1536-well plates were filled by submersion in the fluorescein solution under vacuum followed by a 1 min centrifugation step at 1000 rpm of the 1536-well microtiter plates. After the three different well plate preparation processes, all plates were analyzed with a microplate reader to evaluate the differences in fluorescence per well and corresponding standard deviations.
Mass spectrometry
A Bruker micrOTOF-Q instrument (Bruker Daltonics, Bremen, Germany) equipped with an electrospray ionization source was used in the positive-ion mode. The specific MS operating conditions were the same as described previously. 9
Liquid chromatography
For operation in gradient LC mode (with two Shimadzu LC-10ADvp pumps; Shimadzu, Hertogenbosch, the Netherlands), a Waters Xterra MS C18 column (2.1 × 100 mm, 3.5 µm particles; Milford, MA) with guard column was used with a flow rate of 125 µL/min. Mobile phase A consisted of H2O-MeOH-formic acid (98.9%-1%-0.1% [v/v/v]) and mobile phase B of H2O-MeOH-formic acid (1%-98.9%-0.1% [v/v/v]). The gradient used was 6 min at 0% mobile phase B followed by a linear increase to 100% mobile phase B in 35 min followed by 2 min at 100% mobile phase B. Equilibration occurred by performing a linear decrease to the starting conditions in 1 min followed by 4 min of re-equilibration time. After the LC column, a 1:9 splitting of the flow to the biochemical assay and MS, respectively, was applied. The resulting amount of organic modifier entering the bioassay during the whole gradient did not significantly influence the bioassay (data not shown.)
Results and Discussion
This article describes the use of a postcolumn contactless spotting technology for high-resolution fractionation of LC eluents into 1536-well plates, enabling incubation with the AChBP and bioaffinity assessment. The methodology allows simultaneous identity profiling by MS and parallel high-resolution bioaffinity assessment of the collected fractions (2 s per fraction) after LC separation. In this way, individual bioactive compounds can be identified in mixtures as such together with a simultaneous MS-based chemical identification. Prior to fractionation, the necessary biochemical reagents are mixed with the LC eluent. Multiple droplets were spotted into each well of a microtiter plate, allowing for control of the total volume per well (six droplets, corresponding to 2-s fractions). After spotting and mixing of biochemical reagents, any incubation time of choice can be chosen as necessary to reach equilibrium or the desired signal prior to the microplate reader analysis. The reconstructed bioaffinity chromatograms are correlated to the parallel measured MS data in order to identify the bioactive compounds in the mixtures analysed. First, the spotting repeatability and microplate reader repeatability in combination with 1536-well plates were evaluated chemically using fluorescein. Then, the evaluation, validation, and actual high-resolution bioactivity profiling of pure compounds as well as mixtures toward AChBP by the nanofractionation spotter technology were performed.
Evaluation of the spotting repeatability in 1536-well microtiter format
To evaluate the repeatability of the spotting process in 1536-well format, 1536-well plates were filled with fluorescein (30 nM) in phosphate buffer (100 mM, pH 7.4) in three different ways followed by plate reader analysis. Initially, this was done by a flow-fractionation approach in which the end-tip of the spotter made contact with every well during the fractionation process. This setup was similar to a contact-based fractionation device,
8
operated in eluent infusion mode (without the LC column). The second approach comprised submersion of 1536-well microtiter plates in the same buffer with fluorescein under vacuum to ensure that all wells were completely filled. Subsequently, the microtiter well plates were centrifuged prior to the plate reader analysis. In this case, the fluorescein concentration in every well should be exactly the same, thus allowing evaluation of the efficiency of the plate reader only. The third approach consisted of using the current spotter setup, in the eluent infusion mode, with only one superloop operating and delivering the fluorescent solution. This is to spot the buffer with the fluorescein into the 1536-well microtiter plates. In the supplemental data,
Evaluation, validation, and actual high-resolution bioactivity profiling of pure compounds and mixtures on the AChBP aided by the nanofractionation spotter technology
The reason for using the AChBP biochemical assay format in this offline mode rather than the recently described online format 10 is the capability of the offline format to identify compounds with slow binding kinetics, which require long incubation times for binding equilibrium to be reached. Efficient measurement of these types of compounds, such as α-bungarotoxin, 17 a peptidic antagonist of the α7 nAChR with a molecular weight of ˜8000 Da, is not possible with the online format. Because biochemical assay development of the fluorescence enhancement–based AChBP bioassay was already known, 10 we used these optimized biochemical assay conditions for direct transfer to the offline biochemical assay for this work.
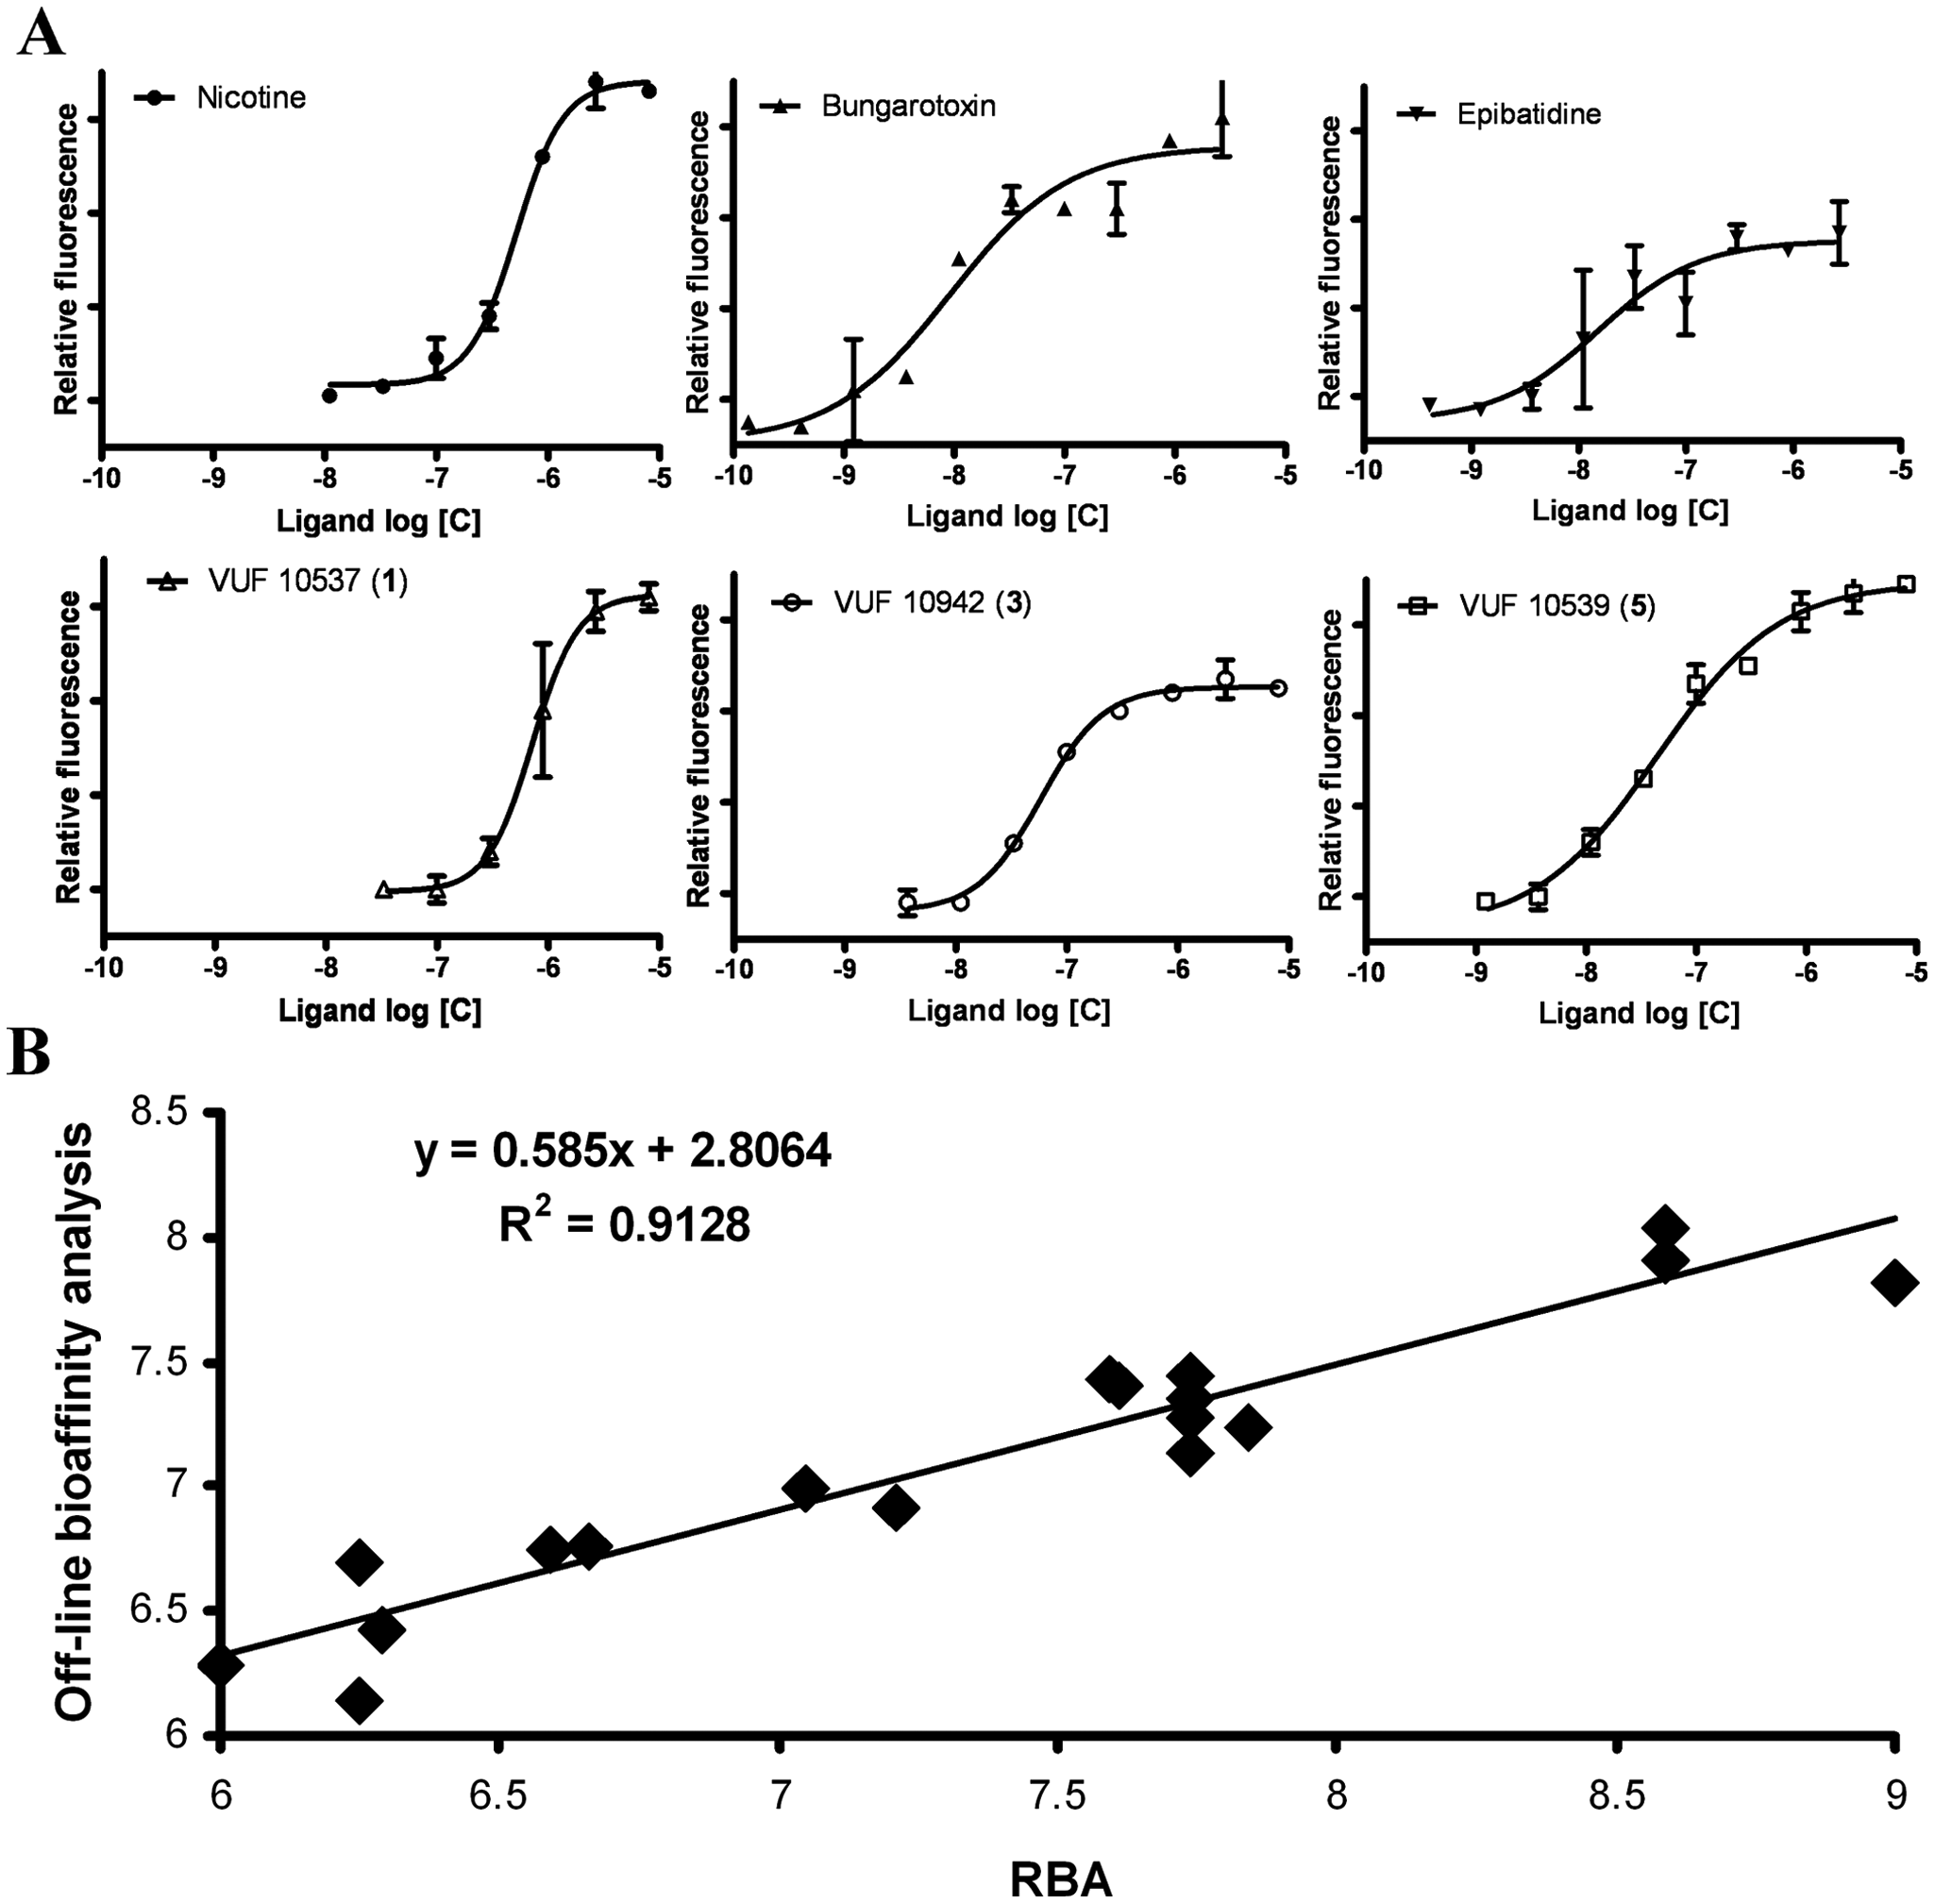
First, different test ligands were injected in the flow injection analysis mode in a serially diluted fashion. The chemical structures of these ligands are presented in
Figure 2
. Ligands 1 to 5 are known α7 nAChR ligands that were synthesized in house and were shown to have high affinities for AChBP. Ligands 6 to 10 result from an in-house fragment optimization project on AChBP. After the eluent was mixed in with the biochemical assay and spotted into 1536-well microtiter plates, an incubation of 3 h was allowed. Then, the fluorescence response in every well was determined, and individual well-based fluorescence responses indicative of bioaffinities were plotted in time to construct bioaffinity chromatograms. This resulted in high-resolution bioaffinity chromatograms comparable with traditional online HRS bioaffinity traces18,19 but with the possibility of using biochemical assays with long incubation times. A typical result from four different ligands injected in triplicate at each concentration can be found in the supplemental data in
Bioaffinities Analyzed from the Plate Reader Readout–Based Bioaffinity Chromatograms Resulting from the Online Spotted Postcolumn Biochemical Assay
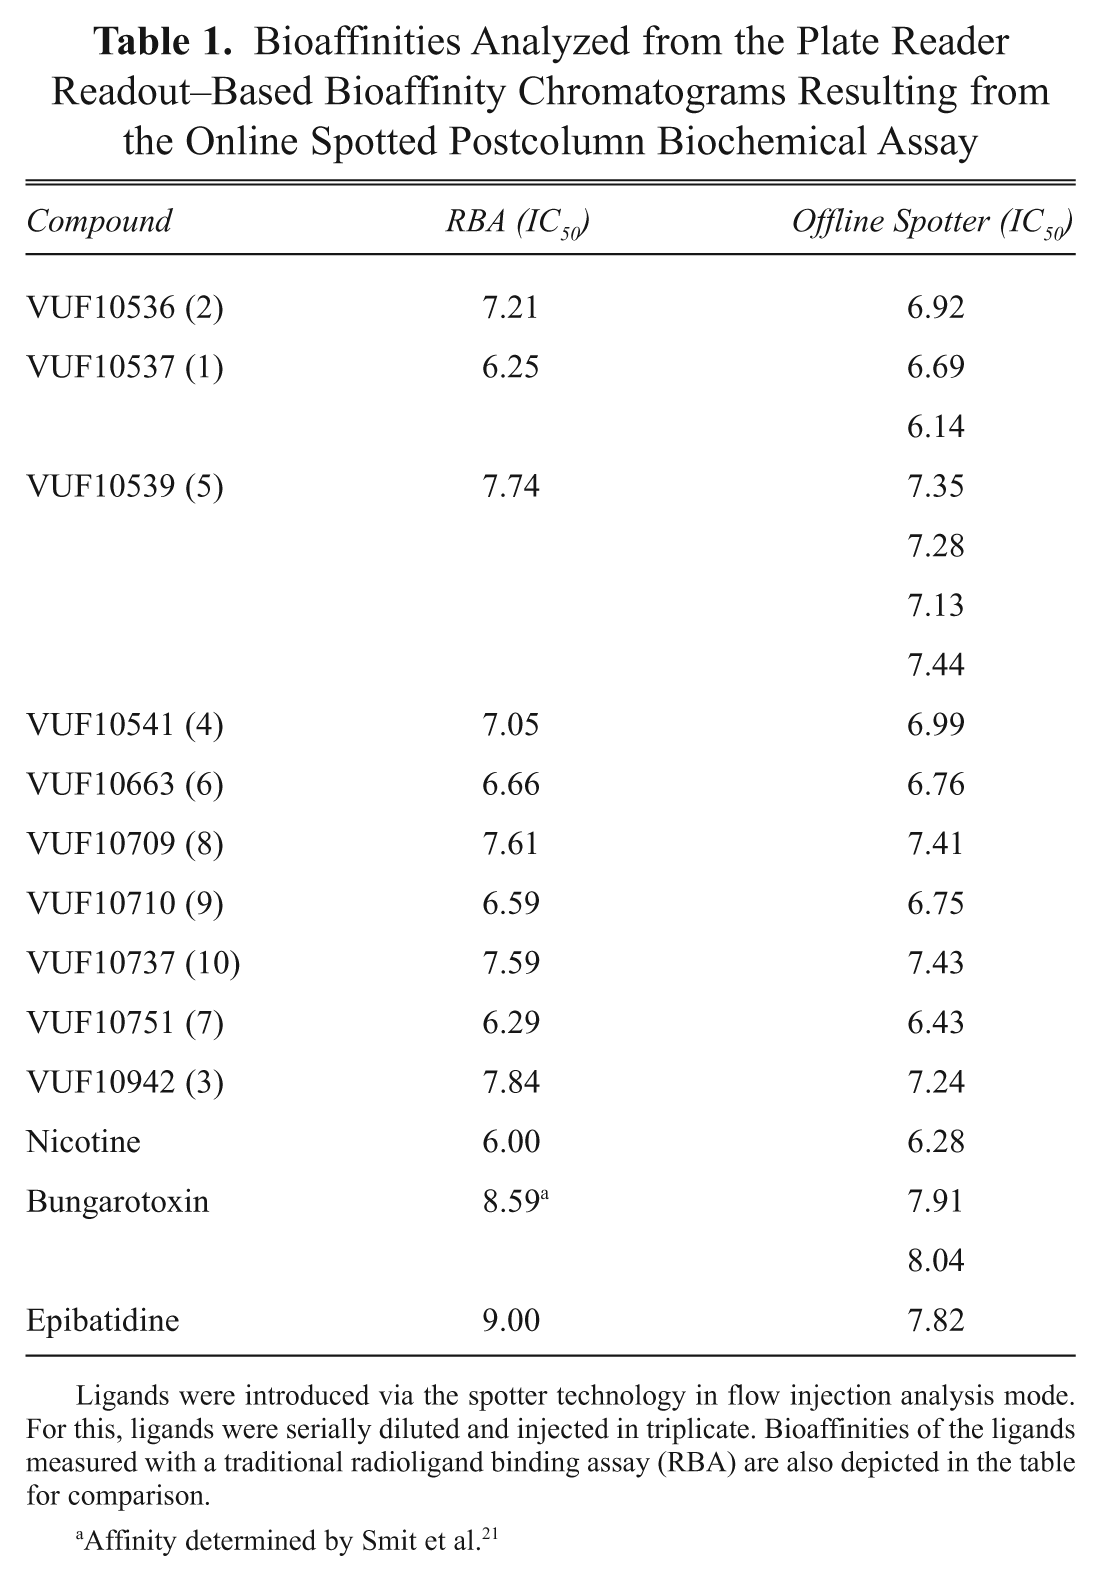
Ligands were introduced via the spotter technology in flow injection analysis mode. For this, ligands were serially diluted and injected in triplicate. Bioaffinities of the ligands measured with a traditional radioligand binding assay (RBA) are also depicted in the table for comparison.
Affinity determined by Smit et al. 21
(
For the actual postcolumn hyphenation process, the spotter technology was coupled to gradient reversed-phase LC and in parallel with MS ( Fig. 1 ) to allow mixture analysis. In Figure 4 , the lower two (reconstructed) chromatograms represent the bioaffinity trace of a mixture (2 and 10 µL injected, respectively) and the upper chromatogram the MS trace measured in parallel. The figure shows that efficient and correlated high-resolution bioaffinity analysis toward AChBP is possible, employing long incubation times, with parallel MS for compound identification. This implies that the technology is thus applicable for bioaffinity analysis of ligands with slow binding kinetics in mixtures. The discrete well-based fractionation allowed us to freely choose postcolumn incubation times without compromising resolution.
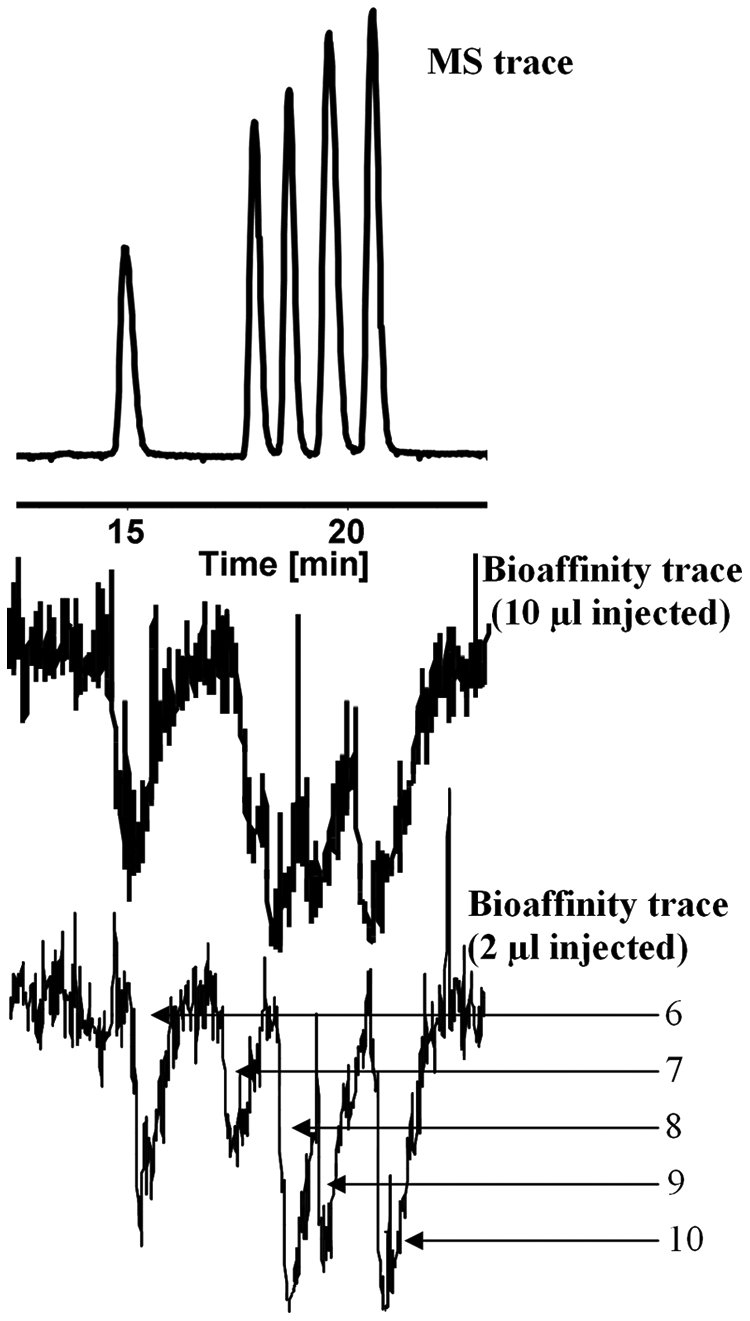
The two lower chromatograms (13–23 min of the total chromatograms are shown) represent the bioaffinity traces of a mixture injected with two different injection volumes (2 µL and 10 µL). The upper trace is the parallel MS trace (from 10 µL injected).
Footnotes
References
Supplementary Material
Please find the following supplemental material available below.
For Open Access articles published under a Creative Commons License, all supplemental material carries the same license as the article it is associated with.
For non-Open Access articles published, all supplemental material carries a non-exclusive license, and permission requests for re-use of supplemental material or any part of supplemental material shall be sent directly to the copyright owner as specified in the copyright notice associated with the article.