
Abstract
With early assessment of inhibitory properties of drug candidates and their circulating metabolites toward cytochrome P450 enzymes, drug attrition, especially later in the drug development process, can be decreased. Here we describe the development and validation of an at-line nanofractionation platform, which was applied for screening of CYP1A2 inhibitors in Phase I metabolic mixtures. With this platform, a metabolic mixture is separated by liquid chromatography (LC), followed by parallel nanofractionation on a microtiter well plate and mass spectrometry (MS) analysis. After solvent evaporation, all metabolites present in the nanofractionated mixture are assayed utilizing a fluorescence CYP1A2 inhibition bioassay performed on the plate. Next, a bioactivity chromatogram is constructed from the bioassay results. By peak shape and retention time correlation of the bioactivity peaks with the obtained MS data, CYP1A2-bioactive inhibiting metabolites can be identified. The method correctly evaluated the potency of five CYP1A2 inhibitors. Mixtures comprising potent inhibitors of CYP1A2 or in vitro–generated metabolites of ellipticine were evaluated for their inhibitory bioactivities. In both cases, good LC separation of all compounds was achieved and bioactivity data could be accurately correlated with the parallel recorded MS data. Generation and evaluation of Phase II metabolites of hydroxylated ellipticine was also pursued.
Introduction
Sensitive, robust, and high-throughput tests have become essential in late drug discovery to early drug development studies, allowing more toxicity assays to be run for larger compound numbers. Routine methods used for early evaluation of the inhibition potency of new chemical entities (NCEs) for relevant cytochrome P450 (CYP) isoforms involve the use of liver microsomes1,2 or recombinant CYP enzymes expressed in bacteria 3 or yeasts, 4 together with specific probe substrates. These bioassays are based on a single-enzyme paradigm, which means that if a compound being tested inhibits the enzymatic metabolism of the probe substrate, it will inhibit all substrates for that particular enzyme. 5 For bioassay readout, stand-alone fluorescence and liquid chromatography (LC) with fluorescence, ultraviolet (UV) absorbance, and tandem mass spectrometry (MS/MS) detection are standard techniques used in screening for CYP inhibitors.6 –8 All these methods have the common bottleneck that they can only be applied for the analysis of pure compounds. This limitation implies that if individual metabolites present in metabolic mixtures are to be assessed for their potency to inhibit one or more relevant CYPs, the metabolites first have to be generated in relatively large quantities, purified by LC, and then concentrated. This is a cumbersome process, especially if many metabolic mixtures have to be tested. This bottleneck was overcome with the development of postcolumn bioaffinity methodologies, also known as high-resolution screening (HRS), which integrates a chromatographic separation of compounds present in complex mixtures with subsequent on-line biological assaying and parallel mass spectrometry. 9 In this on-line setup, individual components of a mixture are separated with high-performance liquid chromatography (HPLC) and then directed to a continuous-flow reaction coil in which enzyme, a fluorogenic substrate, and necessary bioassay cofactors are continuously infused. The on-line approach can be done with fluorescence and UV detection, as well as with parallel MS detection.10,11 Although the on-line approach was successfully used for the detection and evaluation of CYP inhibitors present in academic mixtures 12 and metabolic mixtures, 11 and for screening natural extracts for inhibition of other enzymes, 13 it is limited to bioassays requiring short incubation times. Incubation times longer than 3 min will cause excessive peak broadening, thereby making accurate detection and identification of bioactives difficult. In order to cope with this drawback of HRS, in recent years an at-line screening technology hyphenating chromatographic separation with both MS and high-resolution nanofractionation has been developed. This analytical methodology allows postcolumn high-density well plate–based bioassaying with parallel chemical analysis (MS), and facilitates profiling of biologically active mixtures using complicated bioassays and/or bioassays with long incubation times.9,14
Here we describe the design and implementation of an at-line nanofractionation methodology in 384-well plate format for the screening of metabolic mixtures for drugs and their metabolites that inhibit CYP1A2. Results obtained from the CYP1A2 bioassay are plotted as bioassay chromatograms in order to correlate inhibiting compounds to MS data for chemical identification. CYP1A2 is mainly present in the liver (about 13%–15%) 15 and is involved in the metabolism of drugs, such as caffeine, tacrine, and phenacetin, and naturally occurring compounds, for example, coumarin and flavonoids. 15 CYP1A2 can be inhibited in a reversible and/or irreversible (mechanism-based inhibition [MBI]) manner by several clinical drugs, including rutaecarpine and furafylline.16,17 The main advantage of the approach presented here compared with the earlier published HRS work 18 is the possibility to expose the nanofractionated metabolites to much longer incubation times, which enables kinetic studies (measurement in time per well). The longer incubation time allows MBI and other types of time-dependent inhibition (TDI) to be measured sensitively. Other types of TDI include the formation of metabolites with potent reversible inhibitory properties, which, as in the case of MBI, requires longer incubation times and/or preincubation steps to be effectively detected. For an accurate detection of MBI, a preincubation of the drug with the enzyme of interest is required, as the drug first undergoes metabolic transformation by the enzyme, during which a reactive intermediate is formed, which next binds irreversibly to the active sites of that enzyme, causing its inhibition. 17 The present study describes method development and optimization, followed by validation using a set of standard CYP1A2 inhibitors presented as a mixture. For proof of principle, the CYP1A2-inhibiting potential and parallel structure elucidation of in vitro–generated Phase I metabolites of ellipticine are discussed. The study is finalized with the in vitro generation and preliminary assignment of Phase II metabolites of the earlier obtained Phase I metabolic mixtures of ellipticine.
Experimental
Chemicals
Acetonitrile (ACN) and formic acid (FA) were from Biosolve B.V. (Zwijndrecht, Netherlands); DMSO and hydrochloric acid (HCl) were from Riedel-de Haen (Valkenswaard, Netherlands); alpha-naphthoflavone (αNF), fluvoxamine maleate, alamethicin (from Trichoderma viride), uridine 5-diphospho glucuronic acid (UDPGA) trisodium salt, glucose-6-phosphate (G-6-P), G-6-P dehydrogenase, monopotassium phosphate (KH2PO4), Trizma base, and
At-Line High-Resolution Nanofractionation Platform with Parallel MS Detection
The platform consisted of a gradient HPLC system, an in-house built nanofractionator, and a mass spectrometer ( Fig. 1 ).
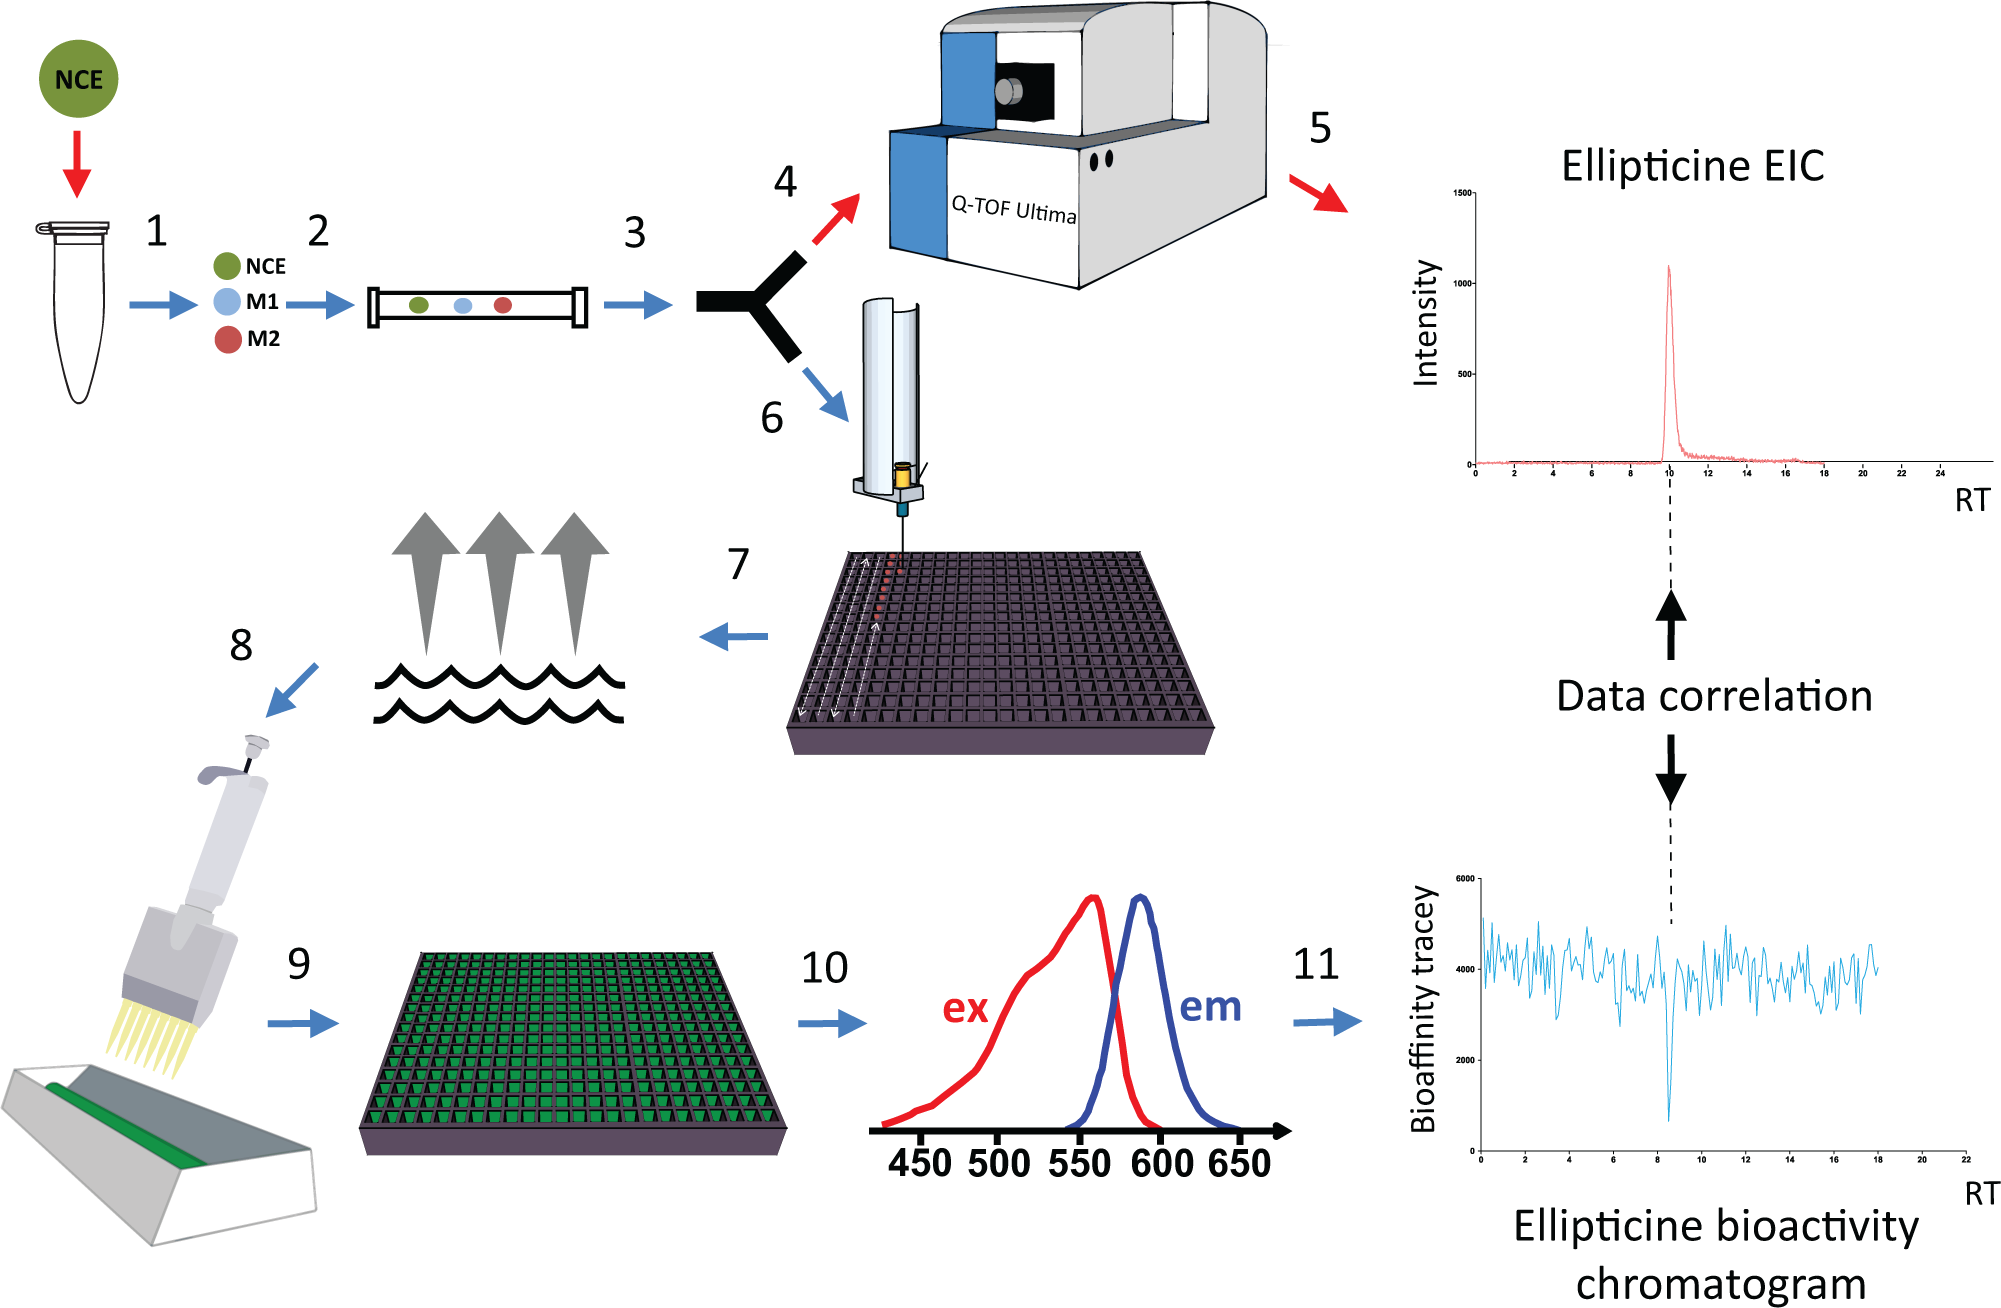
At-line high-resolution nanofractionation system with parallel MS detection. New chemical entity (NCE). (1) In vitro generation of Phase I metabolic mixture of a drug. M1, metabolite 1; M2, metabolite 2. (2) Chromatographic (C18) separation of the metabolites. (3) Split of the eluate in a 1:9 ratio. (4) Ten percent of the eluate is going to MS. (5) MS data acquisition. (6) Ninety percent of the eluate is nanofractionated on a 384-well plate. (7) Evaporation of the solvent. (8) Bioassay mixture containing CYP1A2 enzyme, 7-ethoxyresorufin, and NADPH is robotically pipetted over the well plate. (9 and 10) Inhibitory activity of metabolites toward CYP1A2 analyzed with a fluorescence plate reader. (11) Reconstruction of bioassay readout.
HPLC with Split to High-Resolution Nanofractionation System
A Gilson 234 autoinjectior module (Villiers-Le-Bel, France) was used to inject 50 µL of sample for LC separation. Standards and mixtures were separated using an XBridge C18 (4.6 × 100 mm; 5 µm) analytical column from Waters (Manchester, UK) in combination with an XBridge guard column packed with the same material. For the separations, gradient elution was used mixing two mobile phases, which were delivered by two Shimadzu LC-20AD pumps (‘s Hertogenbosch, Netherlands). Mobile phase A consisted of 98% water, 2% ACN, and 0.1% FA (v/v/v), and mobile phase B was 2% water, 98% ACN, and 0.1% FA (v/v/v). For a standard mixture consisting of four potent inhibitors, the following gradient elution program was applied: 0–2 min, 0%–20% B; 2–4 min, 20% B; 4–6 min, a linear increase to 45% B; 6–7 min, isocratic at 45% B; 7–9 min, a linear increase to 80% B; 9–11.5 min, a linear increase to 90% B; 11–12.5 min, isocratic at 90% B; in 0.5 min, return to starting conditions; and 13–18 min, equilibration at 0% B. Metabolic mixtures of ellipticine were separated with the following gradient: 0–2 min, 10% B; 2–36.5 min, a linear increase to 27% B; 36.5–37 min, a steep increase to 90% B; 37–42 min, isocratic at 90% B; 42–42.5 min, return to starting conditions of 10% B; and equilibration until 50 min. The flow rate was kept at 0.6 mL/min throughout each analytical run, and separation was performed at 37 °C using a CTD-30 column oven from Shimadzu. The column effluent was split 1:9, with the 10% portion directed to the mass spectrometer via a Shimadzu SPD-20A UV detector set at 240 nm. The 90% portion was nanofractionated onto black 384-well microtiter plates (Greiner Bio One, Alphen aan den Rijn, Netherlands).
Nanofractionation System
A detailed description of the nanofractionation system can be found elsewhere.21,22 Briefly, the nanofraction collector consisted of a modified 235 Gilson autosampler. To efficiently collect droplets onto a high-density microtiter well plate, a fused-silica capillary extension was connected to the LC outlet PEEK tubing using a standard PEEK connector, which was mounted to the robotic arm of the Gilson 235 in order to move the capillary over the well plate. The height of the silica capillary tip was fixed at 1–2 mm above the plate using an in-house-made height adjustor. Capillary tip well-to-well movement was done every 6 s in a serpentine fashion. All nanofractionation operations were controlled with in-house developed software (Ariadne, Vrije Universiteit, Amsterdam). Following nanofractionation, the plates were vacuum centrifuged overnight (O/N) using a RVC 2-33 CD plus maxi concentrator (SalmenKipp, Breukelen, Netherlands), with rotation set at 1500 rpm and pressure at 0.10 mbar. The temperature in the rotating chamber was maintained at 30 °C. After vacuum evaporation, the dried plates were ready for at-line bioassaying, or they were stored at –20 °C until analysis.
Mass Spectrometry
An Ultima quadrupole time-of-flight (q-ToF) mass spectrometer from Waters was used parallel to at-line nanofraction collection. Electrospray ionization (ESI) was employed in positive mode. The capillary voltage was 3 V, the source temperature 100 °C, the desolvation temperature 200 °C, and the nitrogen flow 50 L/h. Acquired data were analyzed with MassLynx v4.0 software from Waters. For final high-resolution MS and MS/MS analysis of the metabolic mixtures, a Maxis HD q-ToF mass spectrometer (Bruker Daltonics, Bremen, Germany) was used, together with an IonBooster ion source. Experimental details on these analyses can be found in the Supplementary Information.
At-Line CYP1A2 Inhibition Bioassay
Freeze-dried plates were screened for the presence of CYP1A2 inhibitors with an at-line-performed fluorescence-based bioassay. For this, the well-established catalytic reaction 7-ethoxyresorufin-O-deethylation, known as EROD, was used for bioassay readout. In this reaction, in the presence of the cofactor NADPH, the substrate 7-ethoxyresorufin is converted into the highly fluorescent product resorufin by CYP1A2. 23 The EROD bioassay was optimized for use in combination with nanofractionation (see Supplementary Information, “EROD Assay Optimization” section). The optimized bioassay reagent mixture consisted of 2.5 mM MgCl2, 0.2 mM NADPH, 1.5 µM 7-ethoxyresorufin, and 2 nM CYP1A2 in 0.1 M phosphate buffer at pH 7.4. For all bioassay measurements, the enzyme and substrate working solutions were prepared freshly and separately in two Greiner tubes by diluting them in a buffer containing MgCl2 and NADPH. The solutions were kept on ice. The substrate and enzyme solutions were gently mixed for approximately 10 s prior to pipetting with a Multidrop 384 from Thermo Scientific (Ermelo, Netherlands) set to dispense 40 µL of the bioassay mixture into all 16 rows of a 384-well plate.
The multilabel well plate reader Victor 3 (PerkinElmer, Waltham, MA), with optical filter excitation/emission wavelength 530/572 nm and temperature kept at 37 °C, was used to measure the fluorescence signal kinetically. Each plate was measured 10 times with time intervals of 3.1 min, generating a kinetic curve for each well. The slope of each kinetic curve was calculated and used as the bioassay response for reconstructing a bioassay chromatogram. In these so-called reconstructed bioassay chromatograms, the slopes measured for each well were plotted against the time of the nanofraction collection of that particular well. From these chromatograms, the presence of CYP1A2 inhibitors could be identified as negative peaks.
IC50 Measurements for Assay Validation
Inhibitory potencies of five known inhibitors of CYP1A2 were determined using the nanofractionation system. The resulting values were then compared with those obtained after standard (i.e., not postcolumn) plate reader assaying. For the nanofractionation approach, different concentrations of the following ligands were used: fluvoxamine (0.16-100 µM), αNF (0.032-100 µM), ellipticine (0.002-100 µM), 9-hydroxyellipticine (0.01-100 µM) and rutaecarpine (0.032-100 µM). Structures of the inhibitors are depicted in Supplemental Figure S1 . For the standard nonchromatographic plate reader assaying, 17 different concentrations were used, ranging from 0.003 µM to 200 µM for all inhibitors tested. A volume of 10 µL of each inhibitor solution at four times the final concentration was pipetted into a well, and then the plate was vacuum centrifuged O/N. The plate was bioassayed the following day. From the collected data, IC50 curves were constructed, for which the response values were normalized between 0% and 100%. All IC50 values were determined with PRISM v5 software using the equation log(inhibitor) versus normalized response-variable slope.
In addition, to show that MBI can roughly be distinguished from reversible inhibition, reaction curves generated with selected concentrations of inhibitors under study (9-hydroxyellipticine, rutaecarpine, and furafylline) were compared and evaluated. The two known mechanism-based inhibitors used were rutaecarpine and furafylline.
Detection of CYP1A2 Inhibitors Present in Mixtures
Standard Mixture
Four potent inhibitors of CYP1A2, 9-hydroxyellipticine, rutaecarpine, αNF (20 mM stock concentration), and ellipticine (40 mM stock concentration), were mixed in 50:50 (v/v) ACN–water to a final concentration of 1, 0.2, 1, and 4 µM for 9-hydroxyellipticine, rutaecarpine, αNF, and ellipticine, respectively. Of this mixture, 50 µL was analyzed by the at-line nanofractionation system with parallel MS detection. For information on the separation gradient, see the Experimental section. The nanofractions were then vacuum centrifuged and subsequently exposed to the CYP1A2 bioassay.
Phase I and Phase II Metabolic Incubations of Ellipticine
Phase I metabolites of ellipticine were generated in vitro according to a modified protocol detailed in Kool et al. 24 Briefly, a 50 µL (DEX)-induced rat liver microsomal incubation containing 100 µM ellipticine was metabolized at 37 °C for 90 min, followed by ice-cold ACN protein precipitation and SpeedVac evaporation of the supernatant.
Phase II metabolites were generated in vitro using an earlier produced Phase I metabolic mixture of ellipticine. Briefly, 100 μL of an evaporated Phase I metabolic mixture was incubated in a total volume of 80 µL of DEX-induced RLMs mixed with 50 µg/mL alamethicin in the presence of 5 mM UDPGA at 37 °C for 90 min. To stop the reaction, 400 µL of ice-cold ACN was added. The samples were then centrifuged and the supernatant collected and transferred to clean glass vials, where they were then analyzed by LC-MS. Detailed descriptions of the Phase I and II metabolic incubations can be found in the Supplementary Information sections “Phase I Metabolic Incubation” and “Phase II Metabolic Incubation.”
Results and Discussion
This study describes the development and demonstration of an at-line high-resolution nanofractionation platform with parallel MS for rapid screening of CYP1A2 inhibitors in metabolic mixtures. For this, samples containing potent inhibitors of CYP1A2 present in a mixture, and Phase I metabolites of ellipticine, were separated with HPLC, followed by nanofractionation on 384-microtiter-well plates with parallel MS detection. Nanofractions were collected at a frequency of 6 s per well, as shown optimal by Mladic et al., 14 for achieving good metabolite detectability, while collecting a sufficient number of data points to construct bioactivity chromatograms.
Bioassay Validation for Application to Nanofractionation Analytics
IC50 Determination
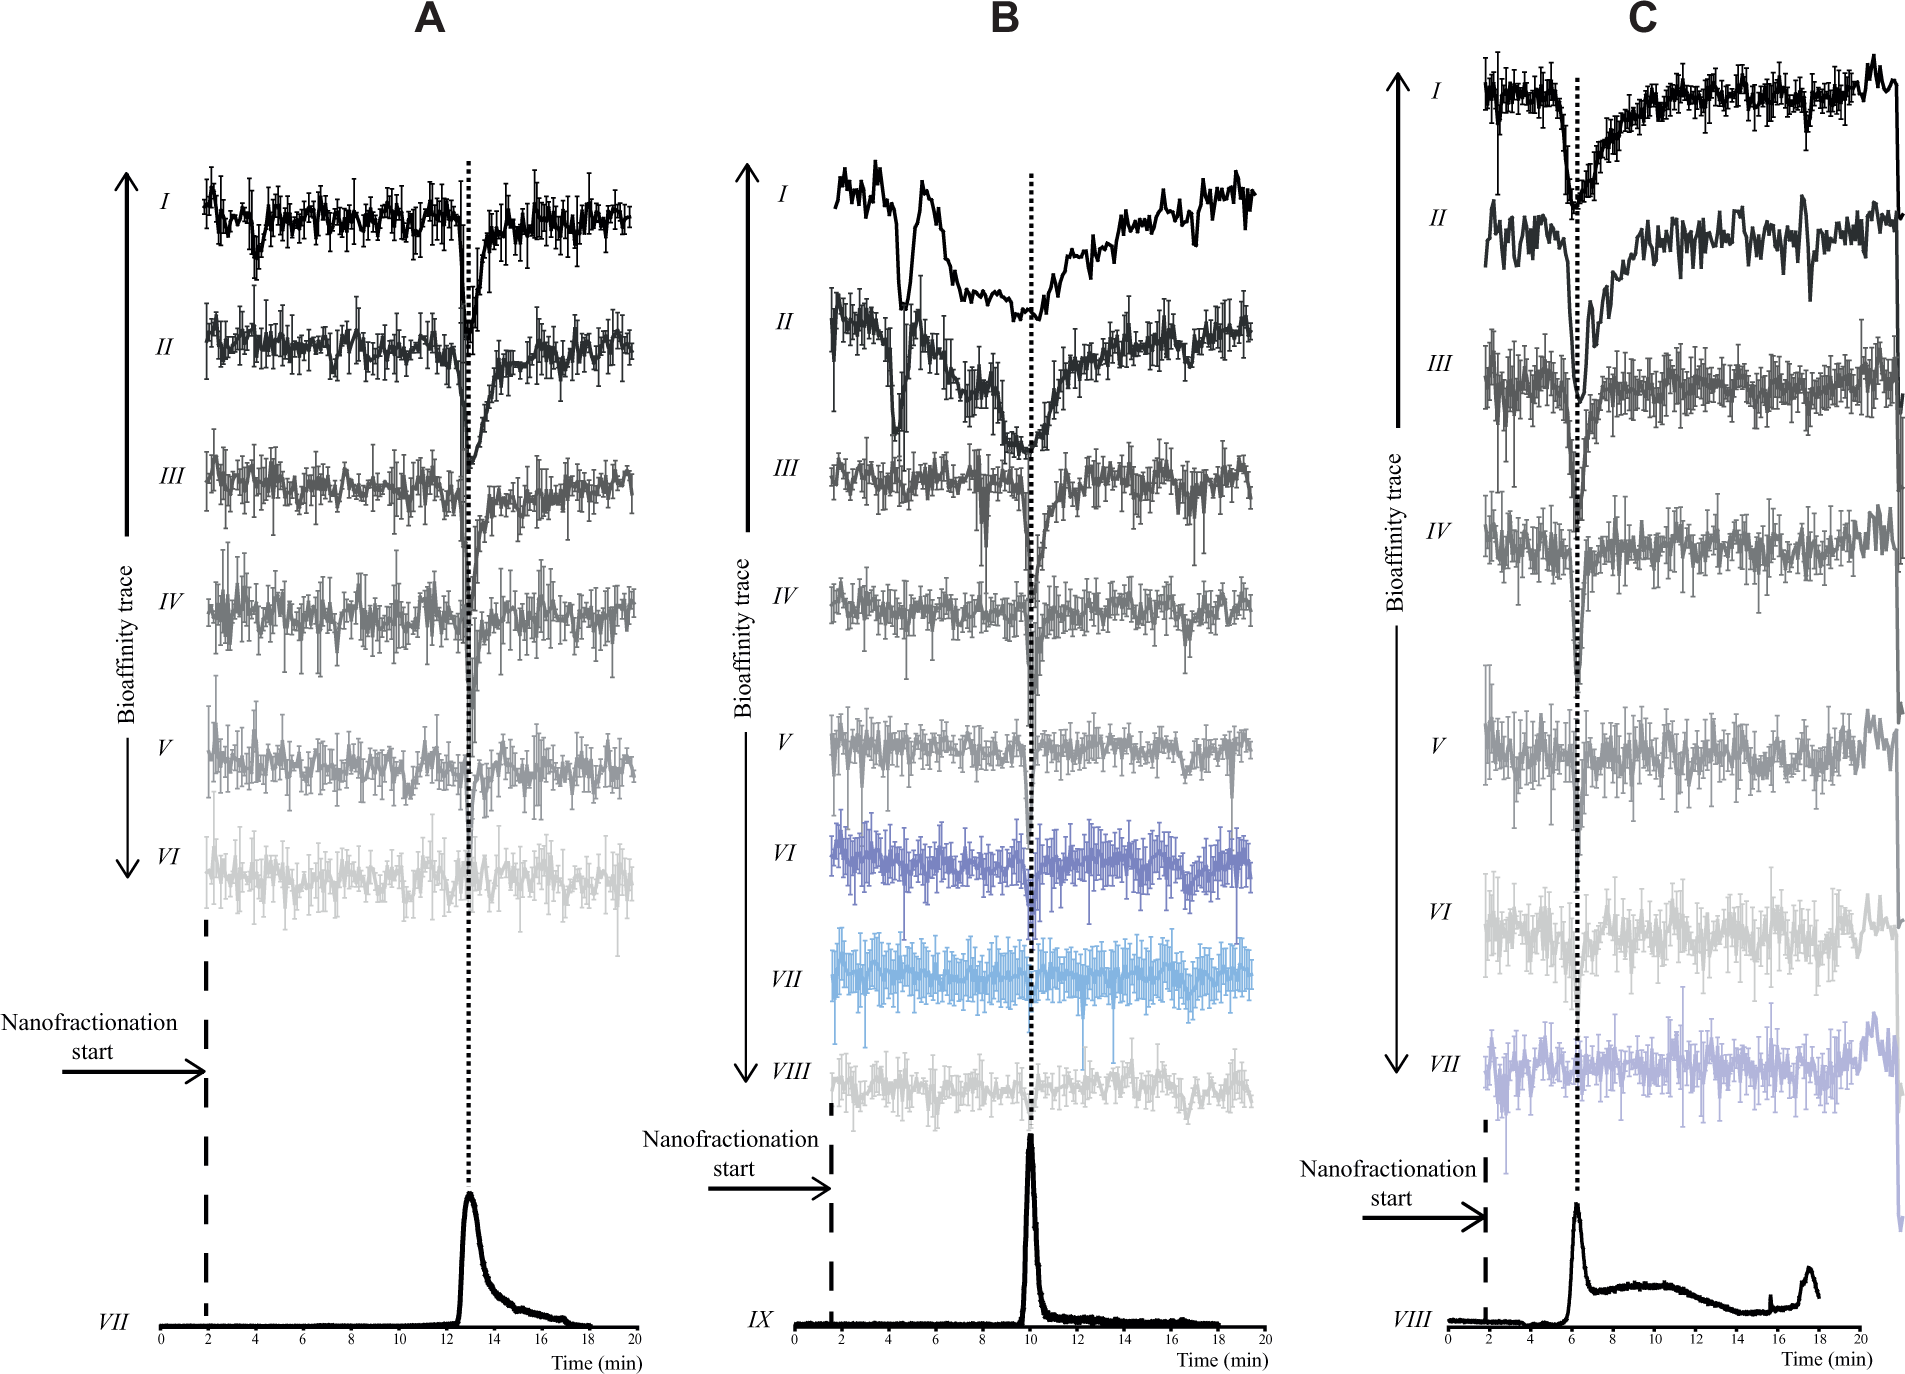
Assay optimization is described in the Supplemental Information Results section. Optimal assay conditions found are described in the Experimental section. Assay validation was accomplished by comparing IC50 values obtained for five CYP1A2 inhibitors (1) after nanofractionation and (2) from pipetting the compounds manually onto a well plate. In both cases, solvent was evaporated using a vacuum centrifuge for well plates. The results obtained after bioassaying the plates were compared with the results reported in the literature. The five CYP1A2 inhibitors chosen for validation of the nanofractionation platform were fluvoxamine, which is a selective serotonin reuptake inhibitor; the flavonoid αNF; and the three alkaloids ellipticine, 9-hydroxyellipticine, and rutaecarpine. From the bioassay measurements, bioassay chromatograms were generated. Examples of stacked bioassay chromatograms obtained for ellipticine, 9-hydroxyellipticine, and rutaecarpine measurements at different concentrations injected are shown in Figures 2A–C, respectively. Reconstructed bioassay chromatograms of αNF and fluvoxamine can be found in Supplemental Figure S2A and B , respectively. In the bioassay chromatograms, inhibition of CYP1A2 is detected as a negative peak. To transform these data into IC50 values, the following aspects have to be taken into account: chromatographic dilution, spreading of an eluting compound over several wells, dilution after injection in the chromatographic system, and the volume in which the dried eluates are reconstituted. These combined are referred to as the dilution factor. To calculate the IC50 values of nanofractionated compounds, the mean of the reconstructed bioassay chromatogram baseline and the height of the minimum of the negative peak were subtracted and then plotted against the inhibitor concentration injected. Injections were done in serial dilution fashion, and concentrations injected were plotted using a logarithmic scale (x axis) versus the negative peak height of the peak minimum (y axis). From these data, IC50 curves were plotted and IC50 values were calculated, after taking the dilution factor into account. As the peak minimum is used as a readout, only the concentration of the inhibitor present in the well (or a few adjacent wells), which represents this peak minimum, is taken into account. The concentration in this well, compared with the injected concentration, represents the dilution factor. The dilution factor can be determined by injecting a known concentration of a fluorescent compound in the nanofractionation system and measuring the highest concentration of this compound found back in the nanofractionated plate after adding the same volume and buffer composition to the plate as for the bioassay. Dividing the fluorescence signal measured on the plate of a well containing the fluorescent compound at the injected concentration by the highest fluorescent signal measured from the nanofractionated compound on the plate will give the dilution factor. The dilution factor was found to be 2.4 (data not shown). Possible discrepancies in the IC50 values between the nanofractionated and manually pipetted compounds, which are still present after correction with the dilution factor, are partly associated with the different physicochemical properties (i.e., polarities) between the compound used to calculate the dilution factor, which was fluorescein, and the inhibitors under study. Chromatographic separation of fluorescein resulted in a narrower peak than for the inhibitors; thus, the fractions were collected over fewer wells in a well plate, lowering the value of the dilution factor. For the relatively nonpolar inhibitors, more chromatographic and postchromatographic peak broadening occurs, resulting in predictable shifts in their IC50 values measured. These shifts, when calculating IC50 values of the different CYP1A2 inhibitors, must be taken into account.
(
IC50 values of the manually pipetted compounds were found to be consistent with those found in the literature, with the exception of the nonpolar compounds 9-hydroxyellipticine and αNF. The IC50 values found in our study were about six and seven times higher than those reported in the literature for 9-hydroxyellipticine and αNF, respectively ( Table 1 ). This discrepancy could be caused by partial loss of analytes due to their rather low solubility in the bioassay reaction mix and/or nonspecific binding to plastic or glass during the process of sample preparation and analysis.
Comparison of IC50 Values of Potent CYP1A2 Inhibitors after Nanofractionation and after Manual Pipetting.
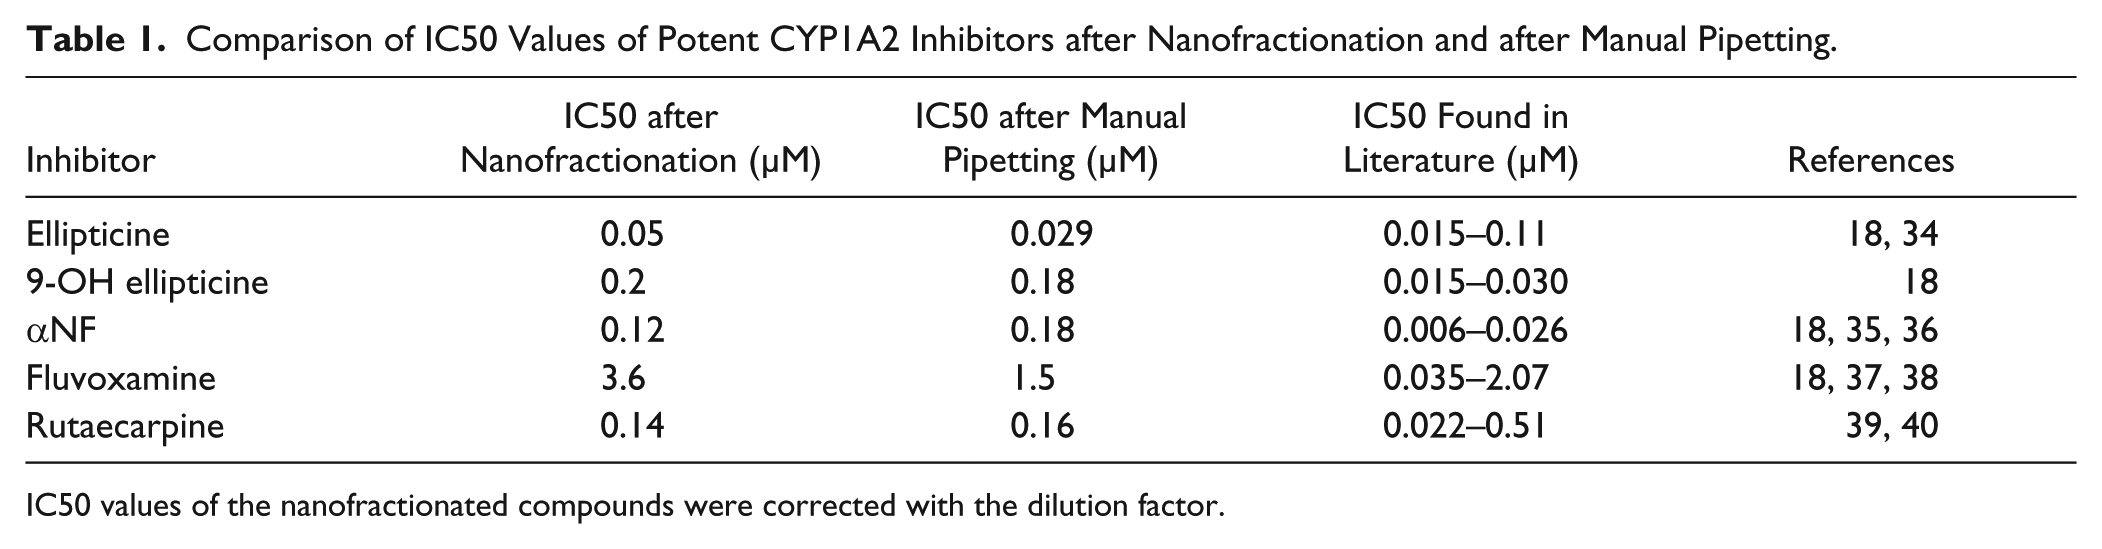
IC50 values of the nanofractionated compounds were corrected with the dilution factor.
In the case of MBI, the fluorescent product formation is observed to decrease in time, indicating inactivation of the CYP1A2 enzyme, as is roughly shown for the MBI compounds rutaecarpine and furafylline ( Suppl. Fig. S3B,C ). Since only a subtle difference could be observed from the data obtained for rutaecarpine and furafylline, a much clearer difference between MBI and reversible inhibition would be obtained with additional preincubation of the enzyme and the compounds. However, this would decrease the throughput of the method. Hence, this preincubation step was not included in the current method, but evidently can be inserted if needed. The fluorescent product formation in time for the different inhibitors tested did, however, give preliminary indications on the possibility to identify MBI, which should then be investigated further with methodologies appropriate for the type of inhibition and/or by repeating the current method with preincubation steps included.
Detection of CYP1A2 Inhibitors in Mixtures
Results of a typical analysis of a mixture of CYP1A2 inhibitors (αNF, ellipticine, 9-hydroxyellipticine, and rutaecarpine) performed with the nanofractionation system are presented in Figure 3 , in which the bioactivity chromatogram (measured in duplicate) was correlated to the parallel obtained MS chromatogram. The retention time and peak shape of the eluting compounds were consistent. The chromatographic resolution was well maintained during nanofractionation and bioassaying, as demonstrated by the good and reproducible correlation between the bioassay chromatogram and MS chromatogram. The four inhibitors were clearly detected, showing that the methodology presented is capable of detecting inhibitors of CYP1A2 present in mixtures.
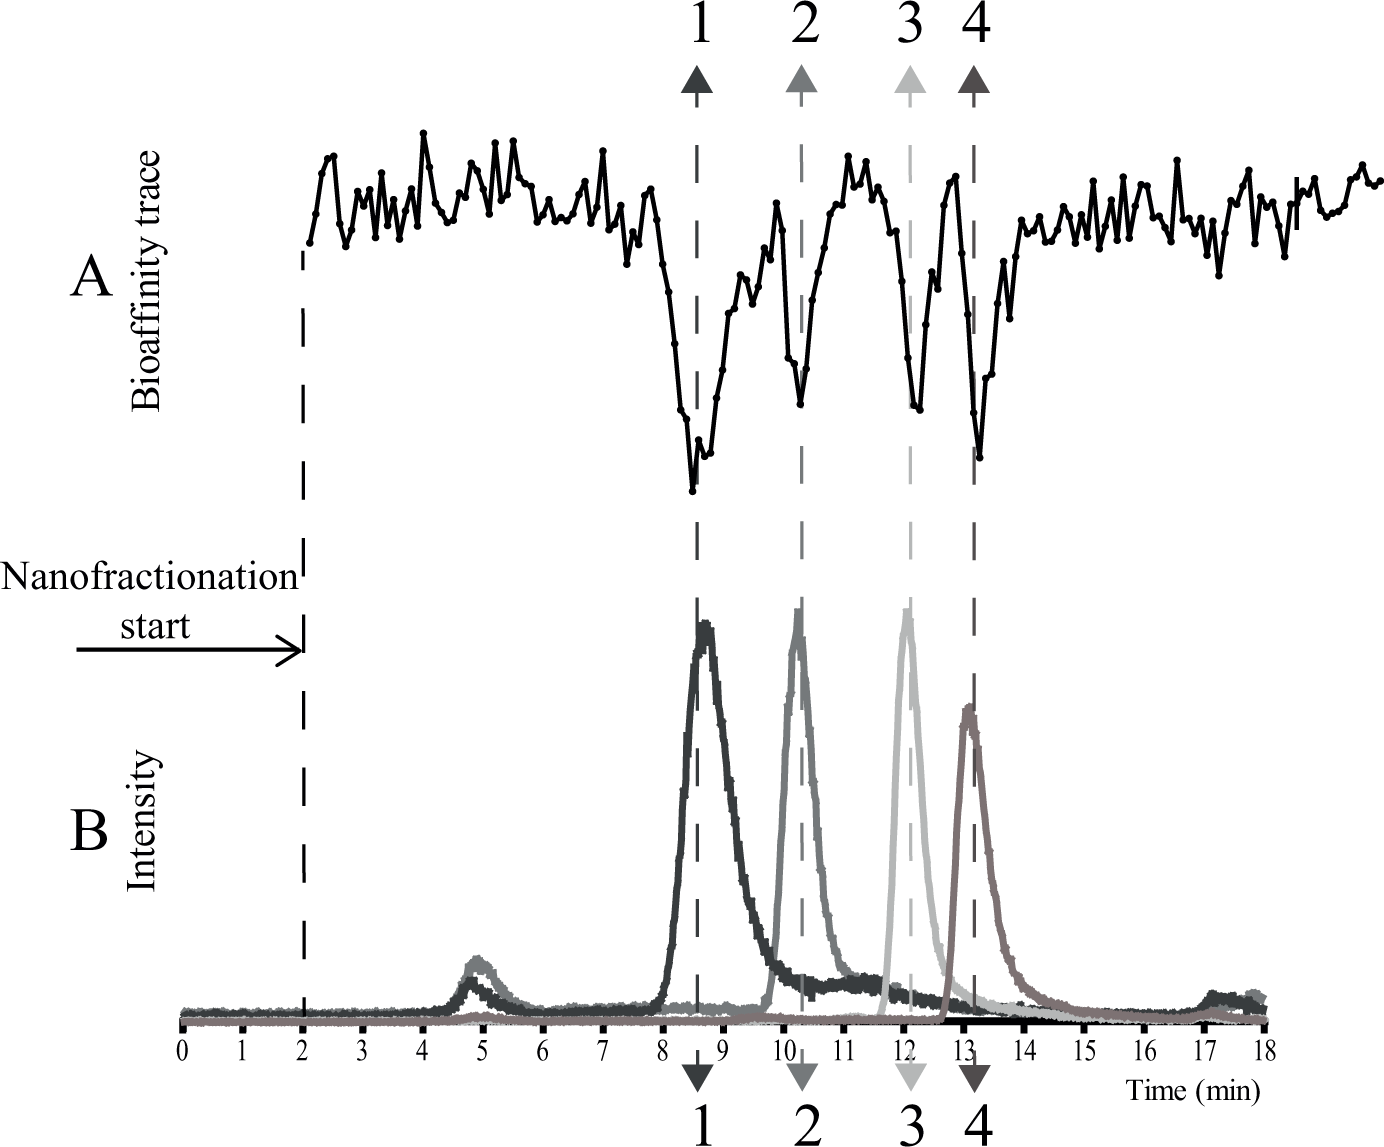
Detection of potent inhibitors of CYP1A2 present in a mixture: (1) 9-hydroxyellipticine (1 μM), (2) ellipticine (0.2 μM), (3) rutaecarpine (1 μM), and (4) αNF (4 μM). (
Phase I Metabolic Mixtures
As circulating metabolites of lead compounds can also contribute to the inhibition of metabolizing enzymes, it is pivotal to test potential inhibitory properties of all metabolites for relevant CYPs during drug discovery. For demonstration purposes, the nanofractionation methodology was next used to analyze Phase I metabolic mixtures of the test compound ellipticine. A typical bioassay chromatogram and parallel acquired MS chromatogram are depicted in Figure 4 . In this example, an optimized gradient was used to achieve a good separation of the metabolites, resulting in a chromatographic run of 50 min. However, to maintain the initial high-throughput screening aspect of the method for profiling unknown metabolic mixtures, a fast generic gradient is used for the first rapid screening assessment. Only after the first screening round and evaluation of the bioactivity chromatograms are chromatographic gradients for selected metabolic mixtures adjusted to achieve a better chromatographic resolution and/or separation. Since 6 s nanofractions were collected to maintain chromatographic resolution, the nanofractionation started 10 min after injection in order to fit the total fractions on one 384-well plate. With a separate analysis, it was checked that the eluate of the first 10 min of the chromatogram did not show any inhibitory activity (data not shown). In principle, if bioactive compounds have to be collected over more than 40 min, a second 384-well plate can be used. Thus, analyzing complex mixtures for which long chromatographic gradients are required is very well possible.
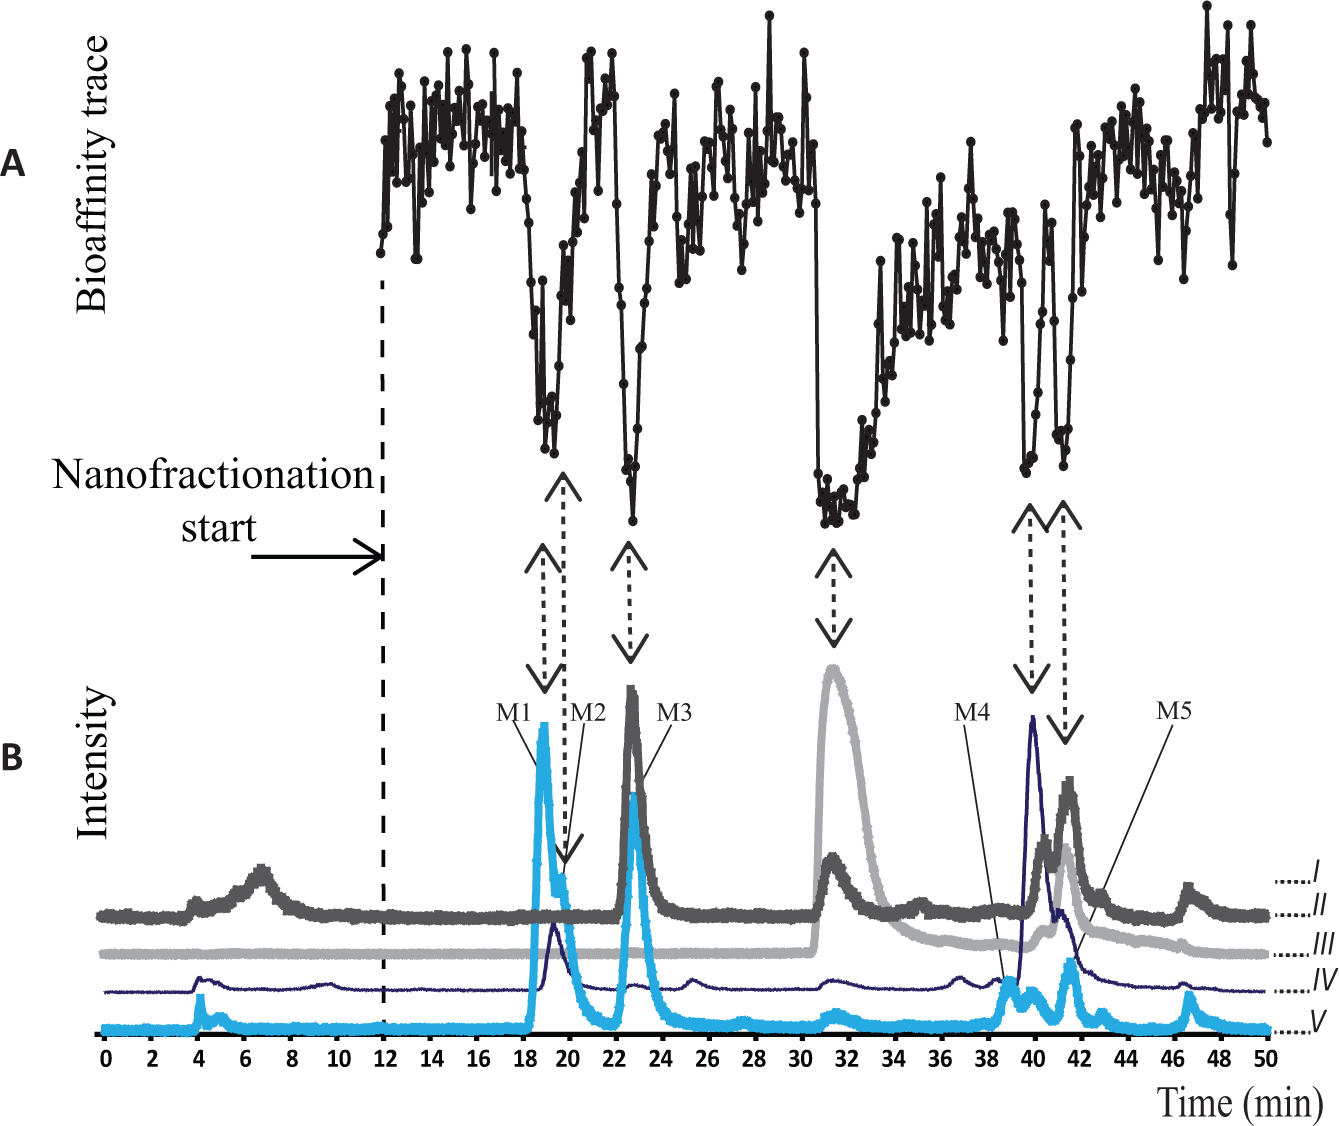
Detection of CYP1A2 inhibitors present in a Phase I metabolic mixture of ellipticine. (
Six negative peaks were observed in the bioactivity chromatogram of the Phase I metabolic mixture of ellipticine, at 18.9, 19.6, 22.7, 31.4, 39.8, and 41.5 min ( Fig. 4A ). Correlation of the bioactivity data with MS chromatograms revealed that apart from peaks at 31.4 and 39.8 min, the mono-oxidized metabolites of ellipticine were responsible for the bioactivity. In the total ion chromatogram (TIC) obtained from parallel MS detection, the major peak was observed at 19–21 min and could be assigned to the parent compound ellipticine (m/z 247 = [M+H]+). The large width of the corresponding peak in the bioactivity chromatogram was caused by the high injected concentration of ellipticine; 100 µM was used for the metabolic incubation. Intense peaks in bioactivity chromatograms may appear broadened due to the intrinsic nonlinear (sigmoidal) concentration–response relation.14,25 The EIC of m/z 263.1, which represents a mass of mono-oxidized ellipticine metabolites, showed 10 peaks, but due to a low intensity observed in the mass spectra of some of them (<500 counts), that is, peaks with retention time (RT): 27.4, 31.4, 39.8, 42.89, and 46.64 min, they were not considered to be relevant oxidation products. It should be mentioned that the lower signal intensities could be the result of the ionization conditions that were tuned for the parent compound, in this case ellipticine, and not for the metabolites. If the bioassay chromatogram shows a clear negative peak at the elution time of peaks with low signal intensity in MS, additional MS analyses with altered ionization conditions can be performed. Five chromatographic peaks (M1–M5, Fig. 4B ), which showed a good correlation with the bioactive peaks in the bioassay chromatogram, were further investigated. According to Stiborová et al., 2 the oxidized products of ellipticine most probably include monohydroxylated metabolites at positions 7, 9, 12, and 14, and an N-oxidated ellipticine metabolite. Of these, the M1 eluting at 18.9 min was unambiguously identified as 9-hydroxyellipticine with the use of a synthetic standard of 9-hydroxyellipiticine. This metabolite was observed to be one of the major oxidation products of ellipticine, which earlier in this study was already shown to be a potent inhibitor of CYP1A2. Other major metabolties were shown to be M2 (RT: 19.6 min) and M3 (RT: 22.7 min). The MS+ spectrum of M2 (all MS spectra are provided in Suppl. Fig. S4 ) showed a strong peak with m/z 263.1, and in M3 a substantial loss of water from the oxidized ellipticine was observed (m/z 245.1). Water loss (Δ m/z 18) is a known nonspecific neutral loss, and its presence can be used to distinguish aliphaitc from aromatic hydroxylation. 26 According to Stiborová et al. 27 nonaromatic hydroxylation in ellipticine is possible on two positions, that is, C12 and C13, which indicates that M3 could be either the 12- or 13-hydroxyellipticine. Less evident are the M4 (RT: 39.8 min) and M5 (RT: 41.55 min) metabolites. In M4, the ion with m/z 263.1 shows a relatively high intensity (1012 counts); however, in M5 the intensity of the m/z 263.1 ion measured was two times lower. Considering the late elution of M5 compared with the parent compound ellipticine, it is possible that the M5 metabolite is an N-oxide, as those metabolites often have retention times that are similar to or longer than those of their parent compoud. 28 However, in our study based on this assumption, the elution order would be not in agreement with data reported by Stiborová et al., 27 where the N-oxide generated in human, rat, and rabbit liver microsomes eluted later than other metabolites, but still before the parent compound. This discrepancy, however, could be the result of different chromatographic conditions used in this study (including the mobile phase composition) compared to those of Stiborová et al., 27 who used methanol/heptane sulfonic acid/acetic acid for isocratic elution. In contrast to other oxidized metabolites observed, M5 shows the formation of a dimer (m/z 525.3), which according to the study of Ibrahim et al. 29 could also be an indication of an N-oxide. In their study, while analyzing N-oxide derivatives in ESI+, they observed protonated and sodiated species to form dimers. The dimer formation was observed only in analyses with ESI+, and not with atmospheric pressure chemical ionization (APCI). Lack of dimers after APCI could be explained by the harsher ionization conditions than those in ESI. ESI is known to promote formation of adduct ions, including dimers. 30 In addition to the oxidized products, the metabolic mixture of ellipticine contained ions with m/z 245.11 [(M+H)–H2O]+, which most probably resulted from the loss of a water molecule in the hydroxylated ellipticine due to in-source fragmentation, and peaks at m/z 261.14, which is a loss of two hydrogens that could be an oxidized product of a degraded ellipticine. Despite a good peak correlation of the metabolites of ellipticine with the bioassay chromatogram trace, the inhibitory activity toward CYP1A2 for some metabolites, that is, M3 and M5, could not be confirmed due to the coelution of another peak observed with m/z 245 for M3 and two peaks with m/z 245.1 and m/z 247.1 for M5.
For accurate peak shape and retention time correlation of the bioactivity peaks with the MS peak, only single MS detection was performed. In the next section, identities of generated metabolites of ellipticine are fully or partly elucidated using high-resolution MS/MS.
Metabolite Identification with High-Resolution and High-Accuracy MS Using MS/MS Fragmentation
The metabolic profile of ellipticine resulting from analysis by UHPLC hyphenated to HR-q-ToF MS is shown in Supplementary Figure S5 . In the MS/MS spectrum of the ion m/z 263.118 from M1 (9-hydroxyellipticine) ( Suppl. Fig. S6 [M1]), a substantial loss of the methyl radical (m/z 248.095, Δ +0.3 mDa), the loss of formaldehyde (m/z 233.107, Δ +0.1 mDa), and a secondary fragmentation from the peak of m/z 233.107 was observed, which resulted in the loss of a methyl radical (m/z 218.084, Δ +0.1 mDa). Negligible loss of a hydroxyl radical and water was observed, which further confirms aromatic hydroxylation resulting in 9-hydroxyellipticine. The fragmentation spectrum of M2 (m/z 263.118), depicted in Supplementary Figure S6 (M2), shows a substantial loss of either water (Δ m/z 18) or a hydroxyl radical (Δ m/z 17), which is represented by ions with m/z 245.107 (Δ +0.1 mDa) (~21% relative intensity [RI]) and m/z 246.115 (Δ 0.0 mDa) (~37 % RI), respectively. The RI is based on the highest peak present in the MS/MS spectrum, in this case the peak with m/z 263.118. A fragment with m/z 248.094 (Δ –0.2 mDa) indicates loss of a methyl radical. The high water loss, as mentioned earlier, may indicate that the hydroxylation in this metabolite (M2) most probably is not on an aromatic ring. 26 This suggests that M2 could be either a 12- or 13-hydroxyellipticine, as those are the only positions in ellipticine for aliphatic hydroxylation to take place. The fragment with m/z 218.084 (Δ +0.1 mDa), based on accurate mass, could result from the loss of a methyl radical and of a formaldehyde [(M+H)–H2C=O]+. The MS/MS spectrum of M3 (m/z 263.117) ( Suppl. Fig. S6 [M3]) shows a considerable loss of a methyl radical with an RI of ~33% and a small peak of less than ~1% RI, indicative of a water loss [(M+H)–H2O]+, which suggests an aromatic hydroxylation. The ion with m/z 230.083 represents a loss of both water and a methyl radical. The fragment ion with m/z 233.106 is consistent with a loss of formaldehyde. M4 also shows a substantial loss of water with an RI of ~100%, and a loss of a methyl radical (m/z 230.083, Δ –0.6 mDa). The loss of water in M4 again suggests that the hydroxylation in this metabolite is not present on the aromatic ring. 31 In the M5 metabolite, a characteristic dimer formation with m/z 525.228, which could indicate an N-oxide, was observed ( Suppl. Fig. S6 [M5]). The formation of dimers in the case of N-oxides is in line with the previous observation made by Ibrahim et al. 29 and increases the probability that M5 indeed is an ellipticine N-oxide. Suggested structures of the fragments of M1, M2, and M3, which are based on the accurate mass measurements, are presented in Supplemental Figure S7 .
Phase II Metabolic Mixture of Phase I Metabolic Mixture of Ellipticine
Lastly, Phase II metabolites of ellipticine were generated with the use of Phase II glucuronidation enzymes present in RLMs using the cofactor UDPGA for conjugation. Based on previous reports, the metabolic pathway of ellipticine includes sulfate and glucuronide Phase II conjugation.32,33 For production of Phase II metabolic mixtures, the Phase I metabolic mixtures of ellipticine discussed in previous sections, were used. In the Phase II metabolic mixtures, four metabolites with m/z 439.14 were identified (RT: 4.7, 5.9, 6.5, and 7.9 min), indicating glucuronidation of the hydroxylated ellipticine metabolites ( Fig. 5 ). Due to the low intensity in the MS of the metabolites observed, MS/MS experiments were not performed. One of the metabolites (RT: 6.5 min) was identified to be the glucuronide of 9-hydroxyellipticine with the use of a Phase II metabolic transformation of the 9-hydroxyellipticine standard.
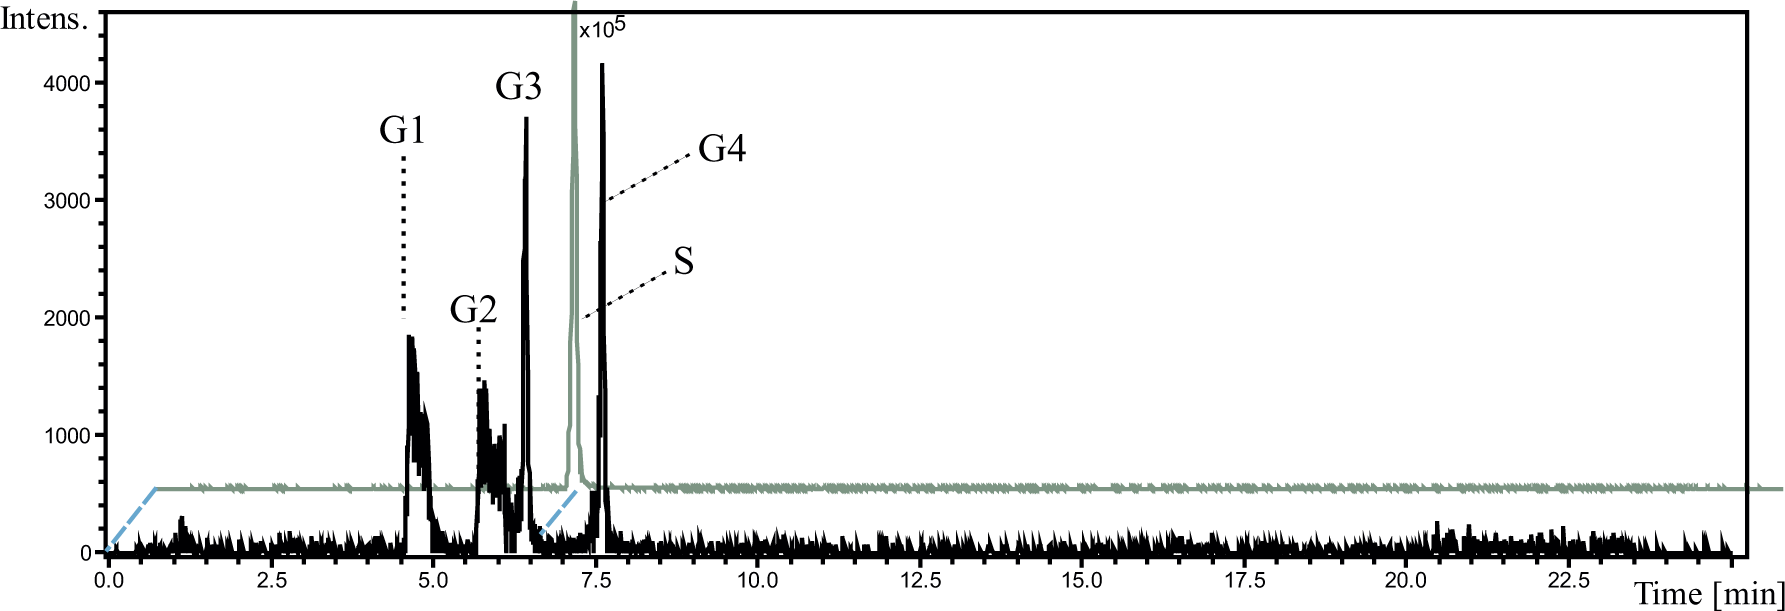
Analysis of ellipticine glucuronides obtained after in vitro metabolic incubation of Phase I metabolites of ellipticine. Four glucuronidated hydroxyellipticines, which are depicted as G1–G4, were detected. In the figure, S indicates the glucuronidated 9-hydroxyellipticine, which was confirmed in a separate experiment by in vitro glucuronidating 9-hydroxyellipticine.
Footnotes
Acknowledgements
The authors acknowledge ARIADME, a European FP7 ITN Community’s Seventh Framework Programme under grant agreement No. 607517.
Supplementary material is available online with this article.
Declaration of Conflicting Interests
The authors declared no potential conflicts of interest with respect to the research, authorship, and/or publication of this article.
Funding
The authors received no financial support for the research, authorship, and/or publication of this article.
References
Supplementary Material
Please find the following supplemental material available below.
For Open Access articles published under a Creative Commons License, all supplemental material carries the same license as the article it is associated with.
For non-Open Access articles published, all supplemental material carries a non-exclusive license, and permission requests for re-use of supplemental material or any part of supplemental material shall be sent directly to the copyright owner as specified in the copyright notice associated with the article.