
Abstract
The α7-nicotinic acetylcholine receptor (α7-nAChR) is a ligand-gated ion channel expressed in different regions of the central nervous system (CNS). The α7-nAChR has been associated with Alzheimer’s disease, epilepsy, and schizophrenia, and therefore is extensively studied as a drug target for the treatment of these diseases. Important sources for new compounds in drug discovery are natural extracts. Since natural extracts are complex mixtures, identification of the bioactives demands the use of analytical techniques to separate a bioactive from inactive compounds. This study describes screening methodology for identifying bioactive compounds in mixtures acting on the α7-nAChR. The methodology developed combines liquid chromatography (LC) coupled via a split with both an at-line calcium (Ca2+)-flux assay and high-resolution mass spectrometry (MS). This allows evaluation of α7-nAChR responses after LC separation, while parallel MS enables compound identification. The methodology was optimized for analysis of agonists and positive allosteric modulators, and was successfully applied to screening of the hallucinogen mushroom Psilocybe Mckennaii. The crude mushroom extract was analyzed using both reversed-phase and hydrophilic interaction liquid chromatography. Matching retention times and peak shapes of bioactives found with data from the parallel MS measurements allowed rapid pinpointing of accurate masses corresponding to the bioactives.
Introduction
In drug discovery, screening of natural extracts plays an important role in finding novel bioactive compounds. After screening, hit compounds are identified and then purified for further individual assessment. Traditional screening workflows have been successful for many years, but are often time-consuming.1,2 In recent years, modern analytical screening methodologies have been developed and used to analyze natural extracts in a faster and more straightforward manner.3,4 These advanced approaches combine separation techniques, mass spectrometry (MS), and bioassays to screen complex mixtures for compounds with desired bioactivity. 5 In this regard, three main postcolumn approaches can be discerned: on-line, at-line and off-line screening. The first two approaches are based on a liquid chromatographic (LC) separation of complex mixtures, followed by parallel MS detection and bioassays. In an on-line screening setup, the bioassay is performed in a continuous flow fashion in parallel and simultaneously with MS detection. 5 In at-line approaches, MS detection of part of the LC effluent is carried out, while the other part in parallel is fractionated onto a well plate on which a bioassay is later performed. 6 In off-line screening, after chromatographic separation and fraction collection, bioassays are performed on the fractions collected and subsequently (LC-)MS analysis is performed on the bioactive fractions only. This traditional approach often is called bioassay-guided fractionation or—in environmental settings—effect-directed analysis.7,8 On-line screening is the technique with the shortest overall analysis times, but many bioassays cannot be implemented in an on-line format, such as bioassays with long incubation times, cellular bioassays, and radioligand binding assays. At-line screening methodologies were developed, allowing application of bioassays separate from the time and place of the LC-MS experiment.9,10 Moreover, in at-line screening methodologies, LC eluents are evaporated from the collected fractions, and thus their potential interference with the bioassay is avoided. With respect to off-line approaches, at-line screening has the advantage that MS data are directly obtained in parallel to fractionation, and that fractionation is performed in a resolution of seconds (so-called nanofractionation) instead of minutes (microfractionation). The latter means that chromatographic resolution is virtually maintained, giving the possibility to reconstruct a so-called bioactivity chromatogram from the bioassay results, which allows accurate peak shape and retention time matching with the MS chromatogram.
Various types of bioassays have been applied in modern analytical screening methodologies, such as bioassays using enzymes that convert substrates into fluorescent products, radioligand binding assays, and bioassays with receptors for which fluorescent tracers are available, showing fluorescence enhancement when bound to the receptor.11–14 Most importantly, functional bioassays can also be implemented in these screening methodologies. 9 A functional bioassay gives the advantage of not only measuring binding affinity of a ligand, but also measuring functional activity and allowing distinction between, for example, agonism, antagonism, and allosteric modulation.
The present study describes the development of an at-line screening methodology for discovery of bioactive compounds in complex mixtures (e.g., natural extracts) targeting the α7-nicotinic acetylcholine receptor (α7-nAChR). The α7-nAChR belongs to the family of ligand-gated ion channels and is expressed in different regions of the CNS, mainly in regions that are involved in memory and learning.15,16 Abnormalities of α7-nAChR have been described in various CNS diseases, such as epilepsy, Alzheimer’s disease, pain, addiction, and schizophrenia.17–19 Potentiation of α7-nAChR activity is shown to be beneficial in the treatment of these diseases. Therefore, agonists and positive allosteric modulators (PAMs) of α7-nAChR are broadly investigated as potential drug leads against these CNS diseases.20,21
The methodology developed encompasses LC separation of mixtures with parallel MS detection and nanofractionation onto 96-well plates. The 96-well plates are subsequently freeze-dried and then subjected to a functional α7-nAChR activity bioassay. The bioassay used is a fluorescence-readout Ca2+-flux assay using human neuroblastoma SH-SY5Y cells stably overexpressing the α7-nAChR. 22 The methodology was developed, optimized, and calibrated using mixtures of known α7-nAChR ligands (i.e., agonists and PAMs). Then, the methodology was applied to the screening of an extract of a Psilocybe mushroom, which is known for its hallucinogenic effects. The effect of known hallucinogenic compounds, like psilocybin, is associated with their affinity for the 5-hydroxitryptamine receptor,23,24 but the activity of compounds in hallucinogenic mushrooms on the α7-nAChR has not been investigated. The developed screening technique allows the direct correlation of bioactivity to the m/z values of the corresponding compounds. This provides a straightforward manner to continue into drug discovery using known masses of the bioactives instead of the need to repeatedly perform time-consuming bioassays during traditional bioassay-guided fractionation. The isolation and full chemical and biological characterization of bioactive components from natural extracts is out of scope of this method development article.
Materials and Methods
Chemicals and Biological Reagents
Human neuroblastoma SH-SY5Y cells expressing the human α7-nAChR were obtained from Christian Fuhrer (Department of Neurochemistry, Brain Research Institute, University of Zurich, Zurich, Switzerland). Dulbecco’s modified Eagle’s medium/Nutrient Mixture F-12 (DMEM/F12), G418 (geneticin), Dulbecco’s phosphate-buffered saline (PBS), Fluo-4 NW assay kit including Fluo-4 NW dye mix (component A) and probenicid (component B), Hank’s balanced salt solution (HBSS), fetal bovine serum (FBS), penicillin-streptomycin, and 0.25% trypsin-EDTA were purchased from Life Technologies Europe (Bleiswijk, the Netherlands). Matrigel was obtained from Corning B.V. Life Sciences (Amsterdam, the Netherlands). Nicotine, epibatidine, PNU120596, PNU282987, α-bungarotoxin, acetylcholine, and TQS were obtained from Tocris Bioscience (R&D Systems Europe Ltd., Abingdon, UK). HEPES, scopolamine, poly-
Instrumentation
A schematic overview of the analytical system and setup is shown in Figure 1 . Mixtures were separated by reversed-phase LC (RPLC) or hydrophilic interaction LC (HILIC), followed by parallel MS detection and nanofractionation onto 96-well plates. The fractionated 96-well plates were freeze-dried and then measured in a Ca2+-flux assay.
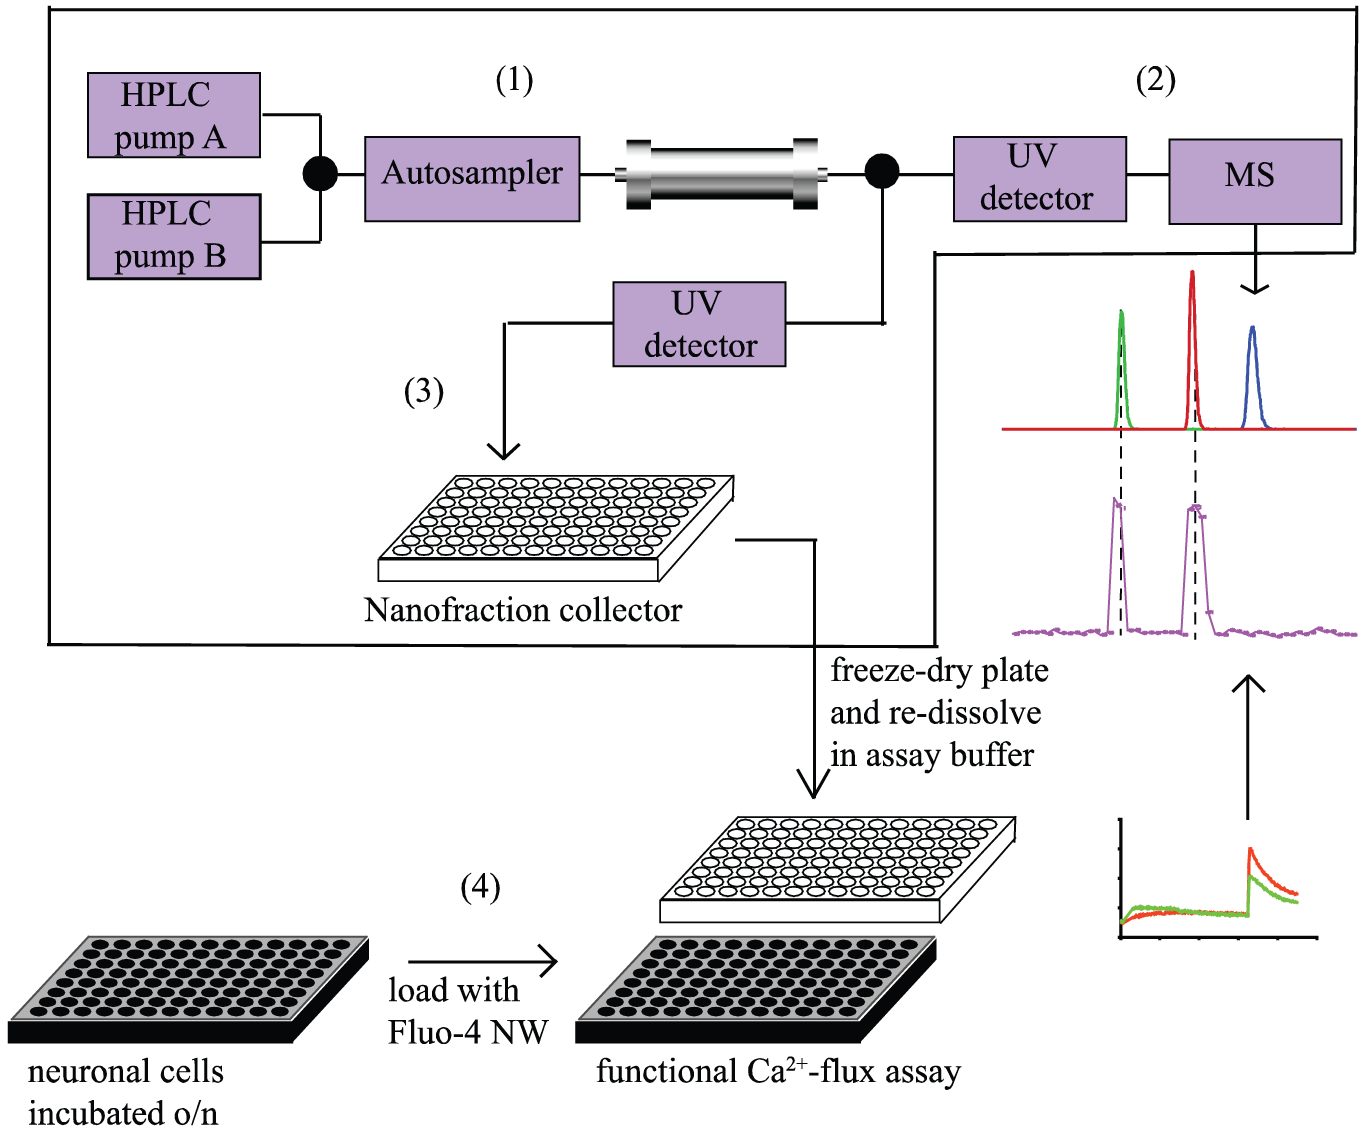
Schematic overview of the at-line cellular screening methodology. (1) Samples are injected and separated using an HPLC system. After separation, the effluent flow is split in a 90/10 ratio. (2) The 10% portion of the flow is directed to a UV detector followed by a mass spectrometer for identification of the eluting compounds. (3) The 90% portion of the effluent flow is directed to a UV detector followed by a nanofraction collector. (4) The well plate containing the collected fractions is then freeze-dried and processed for the Ca2+ assay. From there, a reconstructed bioactivity chromatogram is plotted and compared with the parallel LC-MS chromatogram, to correlate bioactivity with accurate mass.
Reversed-phase liquid chromatography–mass spectrometry
Solvent A contained 98% H2O, 2% ACN, and 0.1% FA; solvent B contained 98% ACN, 2% H2O, and 0.1% FA. The following gradient program was used for the analysis of known compounds: 10 min linear gradient from 0% to 90% solvent B, followed by 2.5 min isocratic elution at 90% solvent B and subsequent linear decrease from 90% to 0% solvent B in 0.5 min, followed by column equilibration at 0% solvent B for 5 min. The gradient separations were carried out using two Shimadzu LC-20AD HPLC pumps (’s Hertogenbosch, the Netherlands) at a 0.6 mL/min flow rate. Samples (50 µL) were injected with a Gilson 235 autoinjector. The samples were separated on an XBridge C18 column (100 × 4.6 mm, 3.5 µm particle size; Waters, Milford, MA, USA), which was preceded by an XBridge C18 guard column (10 × 2.1 mm, 3.5 µm particle size; Waters). The temperature of the column was kept at 37 °C by a Jones chromatography model 7971 column heater. The column effluent was split in a ratio of 90/10. The 90% part of the flow was directed first to an SPD-20A UV-VIS detector and then to a Gilson 235P autoinjector, which was modified to operate as a nanofraction collector. 25 The nanofractions were collected onto 96-well plates with a 6 or 12 s/well resolution. The 10% part of the eluent flow was directed to a Shimadzu SPD-20A UV-VIS detector, followed by a Micromass Q-TOF Ultima mass spectrometer (Waters) equipped with an electrospray ionization source (ESI). The MS measurements were performed in positive-ion mode in the m/z range of 150 to 1400. The capillary voltage was set at 3 kV, source temperature was set at 150 °C, and the desolvation gas temperature was 200 °C. The 96-well plates with the collected fractions were freeze-dried under vacuum with a Christ RVC 2-33CD plus vacuum centrifuge (Salm en Kipp BV, Breukelen, Netherlands) and stored at −20 °C until usage.
Hydrophilic interaction liquid chromatography–mass spectrometry
The HILIC separation was performed on an ultra-performance liquid chromatography (UPLC) system from Shimadzu controlled via Shimadzu Lab Solutions software. The sample injection volume was 50 μL provided by a Shimadzu SIL-30AC autoinjector. The eluent gradient was delivered by two Shimadzu LC-30 AD pumps at a total flow rate of 0.6 mL/min using solvents A and B (see Reversed-phase liquid chromatography-mass spectrometry section). Separations were carried out on an Atlantis Silica HILIC column (150 × 2.1 mm, 3 µm particle size; Waters). The column was kept at 37 °C in a Shimadzu CTD-30A column oven. The gradient was as follows: a linear decrease of solvent B from 50% to 0% in 10 min, followed by 2.5 min at 90% solvent B and then a subsequent decrease of solvent B to 0% in 1 min. Column equilibration at 50% solvent B was done for 5 min. After UV detection (Shimadzu SPD-M20A Prominence diode array detector), the column effluent was split in a 10/90 ratio. The 10% portion of the effluent was directed to MS and the remaining 90% was directed to the nanofractionation system. MS measurements were performed with a Shimadzu ion-trap time-of-flight (IT-TOF) mass spectrometer equipped with an ESI source operated in positive-ion mode. The instrument settings were 4.5 kV spray voltage, 125 °C source heating block and curved desolvation line temperature, 66 kPa drying gas pressure, and 1.5 L/min nebulizing gas flow. The scan range was set between m/z 200 and 1200.
Biological Assay
Cell culture
The SH-SY5Y neuroblastoma cells were maintained in DMEM/F12 media supplemented with 10% FBS, 1% penicillin-streptomycin, and 100 µg/mL geneticin as the stable expression selection marker. The cells were cultured in 75 cm2 flasks at 37 °C/5% CO2 incubator and passaged every 3–4 days. One day before the Ca2+-flux assay was performed, SH-SY5Y cells were seeded in Matrigel-coated, black-walled, and clear-bottom 96-well imaging plates (Greiner Bio One, Alphen aan den Rijn, the Netherlands). These 96-well plates were precoated with 100 μL of PLL and incubated for 30 min at 37 °C. After the PLL was removed, two washing steps were performed with PBS and DMEM/F12. Subsequently, the ice-cold Matrigel (10 mg/mL) was diluted 10 times with DMEM/F12 and 50 μL of the diluted Matrigel was added to each plate well. After 1 h incubation at room temperature, the Matrigel was removed and the 96-well plates were washed two times with DMEM/F12. The cells were then seeded into the Matrigel-coated plates with the density of 80.000 cells/well. These plates were incubated overnight at 37 °C and used for the Ca2+-flux assay the next day.
Ca2+-flux assay
On the day of the experiment, the culture medium was removed from the cells incubated overnight in the 96-well plates and the cells were loaded with 100 µL/well assay mix consisting of Fluo-4 NW dye mix (two times diluted compared to manufacturer’s protocol) and probenecid (2.5 mM final concentration) dissolved in the assay buffer (1× HBSS, 20 mM HEPES, pH 7.4). The cells were then incubated at 37 °C for 30 min in the dark. In the meantime, nanofractions were redissolved by adding 150 µL/well of assay buffer. The black-walled clear-bottom 96-well plate containing the cells and assay mix was marked as the measurement plate, while the 96-well plate containing redissolved nanofractions was marked as the reagent plate. All the pipetting steps and measurement of the Ca2+-flux in the cells were performed by a NOVOstar microplate reader (BMG Labtechnologies, Ortenberg, Germany). The response of the cells was measured by following the fluorescence (excitation and emission wavelengths, 485 and 520 nm, respectively) as a function of time.
Screening for agonists and PAMs was performed in two distinct assay formats. For the agonist assay, 30 µL of a known PAM (PNU12059; 10 µM) was first added to the measurement plate. After 90 s incubation time, 30 µL of the sample was added from the reagent plate to the measurement plate and the agonist signal was recorded for 60 s. As a final step, 22 µL of 5% Triton X-100 was added to the cells to record the maximum fluorescence signal (Fmax). For the PAM assay, the transfer of 30 µL of samples from the reagent plate to the measurement plate was followed by 90 s incubation time and the addition of 30 µL of known agonist (nicotine; 100 µM), and after 60 s the addition of 22 µL of 5% Triton X-100.
The data gathered from the microplate reader were analyzed in Microsoft Excel and GraphPad Prism 5 software (GraphPad Software, Inc., San Diego, CA, USA). The signal of each well was presented as the relative signal compared to the Fmax (%Fmax), which was calculated using the formula %Fmax = 100 × (F – Fmin)/(Fmax – Fmin), where F is the maximum fluorescence signal obtained by an agonist, Fmin is the baseline fluorescence, and Fmax is the maximum fluorescence obtained after the addition of 5% Triton X-100.
Mushroom Extract Preparation
Lyophilized Psilocybe McKennaii fungi were extracted as described by Thomson, 26 with modifications. The freeze-dried material was ground to a fine powder using mortar and chisel. Ten grams of this dry material was divided over five 50 mL Costar tubes. To each tube, 50 mL of MeOH was added and roller-mixed for 24 h. After centrifugation at 4000 rpm, the supernatants of the tubes were combined and filtered through a 0.45 μm Whatman cellulose filter (GE Healthcare, Zeist, Netherlands). Approximately 230 mL of MeOH from the initial 250 mL extract was then removed using a vacuum rotary evaporator. The remaining 20 mL of extract was freeze-dried to dryness during 72 h. For analysis, samples were made by dissolving the extract in water/ACN (99:1, v/v) with 0.1% TFA, followed by centrifugation at 13,400 rpm for 10 min. The supernatant was transferred to a sample vial for screening analysis.
Results and Discussion
This work describes the development and optimization of an at-line cellular screening methodology for analysis of natural extracts in order to find new compounds acting on the α7-nAChR. For this purpose, LC was hyphenated to parallel MS detection and nanofractionation onto 96-well plates. The nanofractionated 96-well plates were freeze-dried and then used in the Ca2+-flux assay to determine the functional activity of separated ligands binding to the α7-nAChR. The methodology developed was first optimized and validated for use in agonist and PAM assay format, since potentiating of α7-nAChR activity has a therapeutic relevance in CNS diseases. Then, the applicability of the developed methodology was demonstrated with the analysis of a Psilocybe McKennaii extract.
Optimization and Evaluation of the Cell-Based At-Line Cellular Screening Setup with Known Ligands towards α7-nAChR
Before optimization of the bioassay conditions, it is important to consider the nature of the ion channel activation. Since the α7-nAChR is a ligand-gated ion channel, binding of an agonist will evoke a large Ca2+ current. However, after rapid activation, the ion channel is desensitized in the timescale of seconds. The limitation of channel desensitization can be overcome by using type II PAMs, which increase the magnitude of the response and dramatically increase the opening time of the ion channel. 27
Optimization of Assay Conditions
The assay was first tested by seeding cells using uncoated plates or plates with either a PLL coating or a Matrigel coating. It was found that a Matrigel coating improved the attachment of the SH-SY5Y cells to the well plates and prevented detachment of SH-SY5Y cells during washing steps before running the assay, as also observed in literature.
28
Therefore, the 96-well plates were coated with Matrigel before seeding the cells. The cell seeding density was then optimized in order to reach a 90%–95% confluent monolayer of cells in 96-well plates after overnight incubation. This was reached by a cell seeding density of 80.000 cells/well. The concentration of the Fluo-4 NW fluorescent dye was optimized using the fluorescent dye mixture prepared according to manufacturer’s protocol. The dye was tested at the protocol concentration, a two times diluted concentration, and a four times diluted concentration (
At-Line Cellular Screening Setup in PAM Assay Format
In order to test the at-line cellular screening system in PAM assay format, a mixture of two PAMs of the α7-nAChR, PNU120596 and TQS, were separated and measured at-line with the Ca2+-flux assay. Implementing UV detectors after the effluent split just before the nanofractionation and the MS inlet, respectively, allowed determination of the time difference between nanofractionation and MS detection. For the present setup using RPLC, this difference appeared to be 1.0 min. The suitability of the system for screening of PAMs was demonstrated using a mixture of PNU and TQS at two different concentrations (500 μM each and 100 μM each). The separated compounds showed allosteric modulation in the reconstructed bioassay chromatogram observed as positive peaks ( Fig. 2 ). These bioassay peaks could be correlated to their extracted ion chromatograms (XICs) plotted from the MS results obtained in parallel ( Fig. 2 ). Due to band broadening, assay dilution, and spreading of eluting peaks over multiple wells, the actual PAM concentrations in the assay are lower than the injected concentrations. This dilution is consistent and can be measured or calculated. 11 The dilution factor from the chromatographic separation to the nanofractionation was determined to be 2.0. Further dilution—which is exactly known—occurs as freeze-dried well plates are redissolved and transferred to the measurement plate during assaying using known volumes. This extra dilution was 5.3-fold.
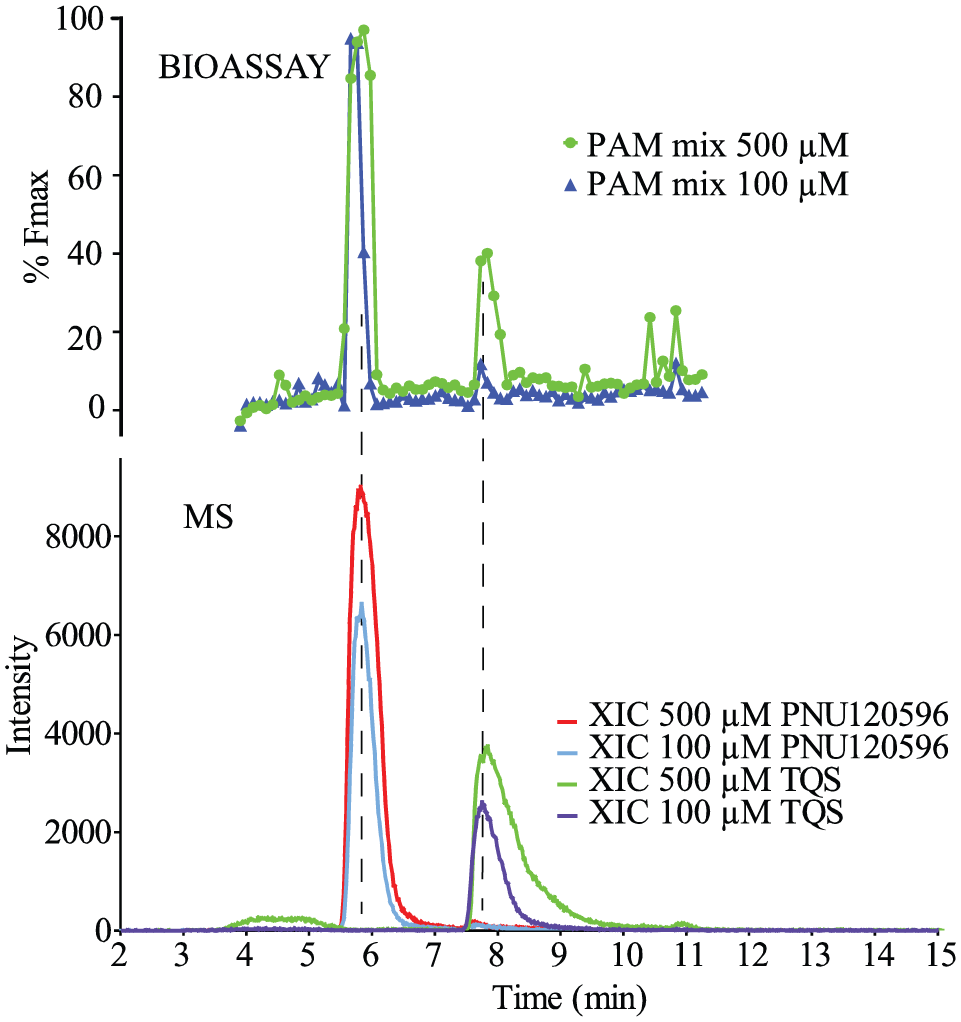
At-line cellular screening of a PAM mixture in the PAM assay format. The PAM mixture was injected for nanofractionation in two concentrations (500 µM PNU120596 and 500 µM TQS, and 100 µM PNU120596 and 100 µM TQS) in duplicate. The MS chromatograms (XICs) (bottom) were correlated with the reconstructed bioassay chromatograms (top). The XICs of PNU120596 (m/z 313) and TQS (m/z 377) were plotted.
At-Line Cellular Screening Setup in Agonist Assay Format
The suitability of the agonist setup of the cellular screening system was first demonstrated with acetylcholine (ACh), a natural agonist of the a7-nAChR. Again, the bioactivity peak observed in the reconstructed bioassay chromatogram could be correlated to the XIC of the ACh-ion from the MS data ( Fig. 3 ). When relatively high concentrations of ACh are injected (e.g., resulting in 90% of the effective concentration (EC90) or higher), the chromatographic bioassay peak becomes wide due to band broadening in the chromatographic system. In reconstructed bioassay chromatograms, this is exaggerated compared to linear responses, as observed in, for example, UV detection or MS analysis, due to the intrinsically sigmoidal dose response of the bioassay. This phenomenon of excessive band broadening observed for high concentrations of ligand injected is common when working with on-line and at-line reconstructed bioassay chromatograms. 13
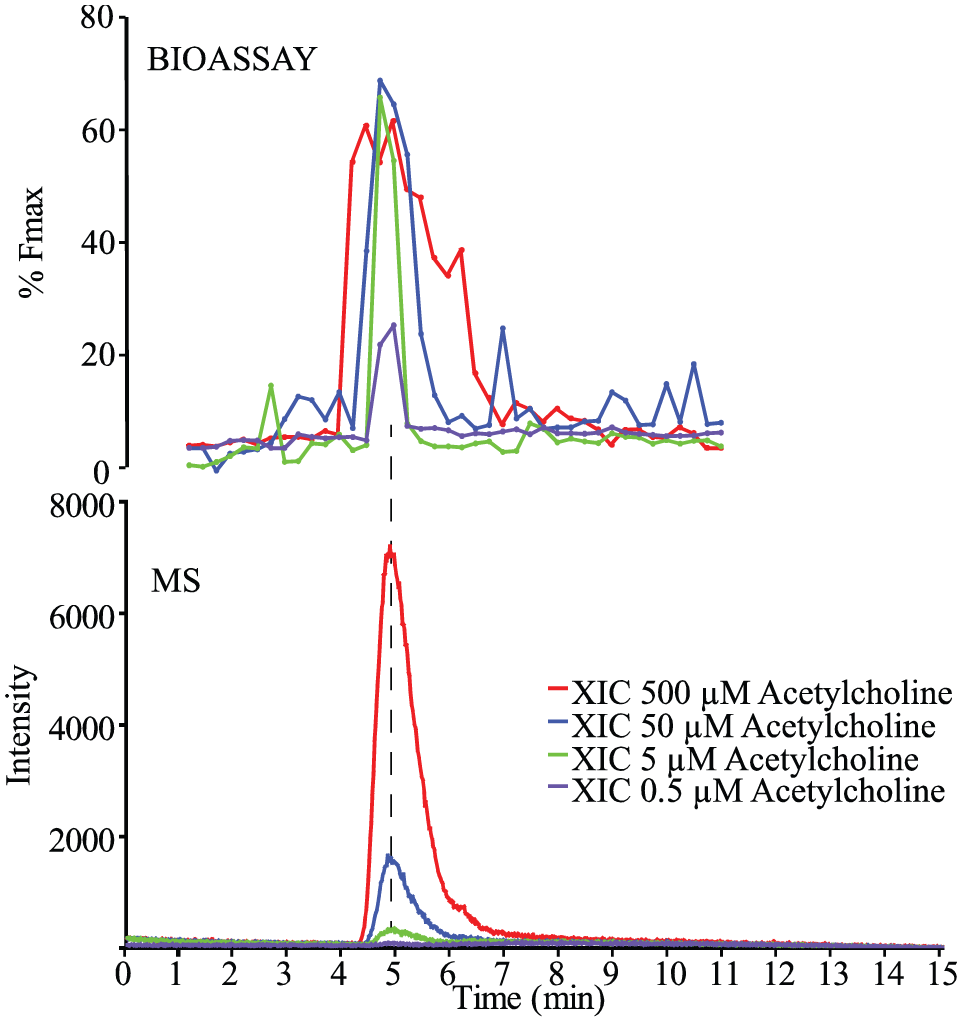
At-line cellular screening of an ACh serial dilution in the agonist assay format. ACh was injected for nanofractionation in four concentrations (500, 50, 5, and 0.5 μM). The wells with bioactive compounds from the bioassay were plotted as a reconstructed bioassay chromatogram (top) and were correlated with the XICs of ACh (m/z 147) (bottom).
ACh showed a strong and repeatable signal in the Ca2+-flux assay when relatively high concentrations were injected. ACh also elicited a Ca2+-signal in the nanomolar range (500 nM injected concentration, about 45 nM in the assay), which indicated that the signals might be caused not only by signaling via the α7-nAChR (pKi of ACh is 5.1 ± 0.1 for the α7-nAChR
30
). To evaluate this, cells were preincubated with bungarotoxin, a specific α7-nAChR antagonist, prior to analysis. Indeed, ACh also showed a Ca2+-flux signal after preincubation with bungarotoxin, and in both the presence and absence of the type II PAM (PNU120596). In order to confirm the nature of the receptor, the cells were preincubated with scopolamine, a nonselective muscarinic AChR antagonist, which significantly blocked the Ca2+-signal evoked by ACh (
In order to evaluate the cellular screening system for α7-nAChR selective agonists, a mixture of PNU282987 (500 or 50 µM) and epibatidine (50 or 5 µM) was tested at two different concentrations ( Fig. 4 ). The fractions in which the two agonists were eluting from the HPLC showed activation in the Ca2+-flux assay, and the reconstructed bioassay chromatogram showed good correlation to the MS results.
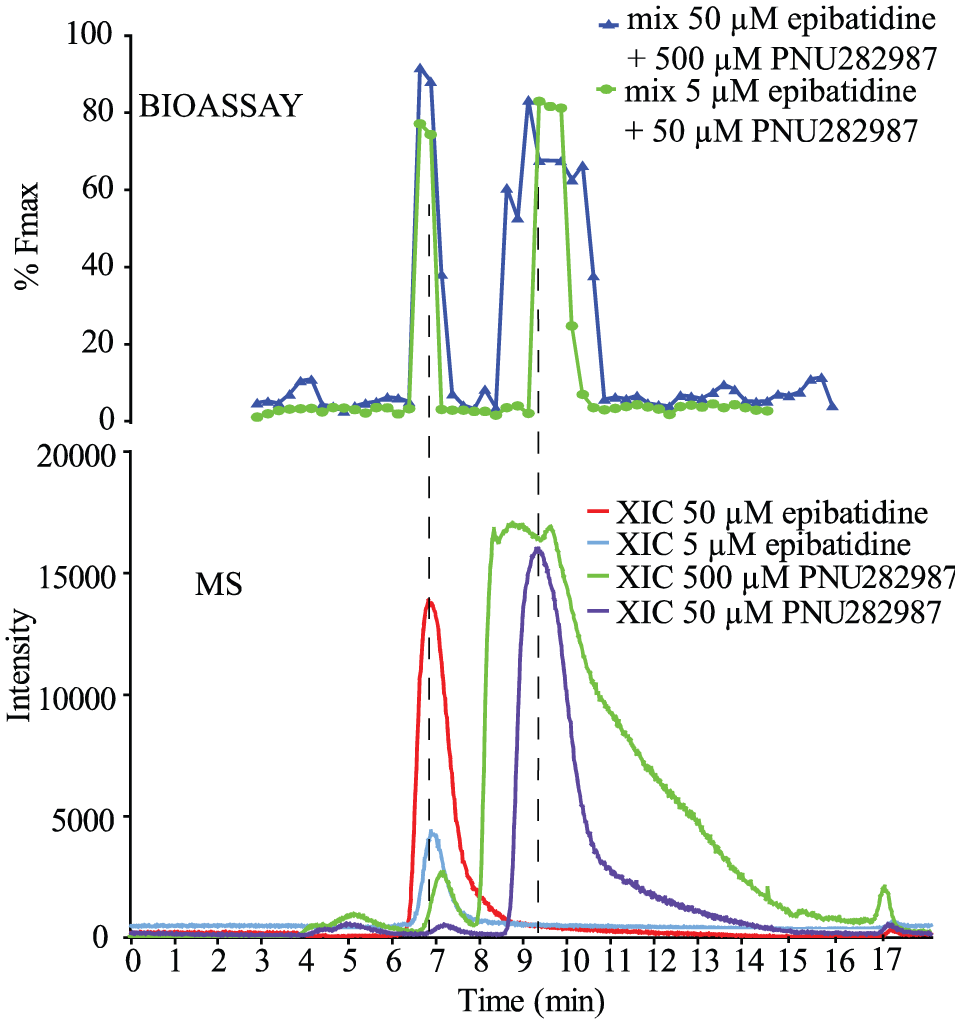
At-line cellular screening of an agonist mixture in the agonist assay format. The agonist mixtures (500 µM PNU282987 and 50 µM epibatidine, and 50 µM PNU282987 and 5 µM epibatidine) were analyzed in duplicate. The reconstructed bioassay chromatogram (top) is correlated with the XICs of epibatidine (m/z 209) and PNU282987 (m/z 265) (bottom).
Notably, the effect of the PAM PNU120596 decreased in time. This effect was most pronounced when the temperature in the laboratory was higher than normal, 20–25 °C room temperature (due to warm summer days). The strong temperature dependency of the allosteric modulation of PNU120596, which decreases with rising temperatures, is described in the literature.
32
This temperature dependency makes measurements and correct interpretation of the %Fmax signal more time-consuming with noncooled plate readers such as the one applied in this study. Freshly prepared PNU120596 had to be added to the reservoir every 1.5–2 h to maintain similar responses. When refraining from this, the amplitude of the Ca2+-signal caused by the allosteric modulator PNU120596 dissolved in the wells in the reagent plate is decreasing in time (
At-Line Cellular Screening of a Psilocybe McKennaii Extract
In order to demonstrate the applicability of the at-line cellular screening setup for screening natural extracts, an extract from the Psilocybe McKennaii mushroom was analyzed in the agonist assay format. The followed workflow of screening and identification of the bioactives found is depicted in Figure 5 . As one (fast) LC separation will never provide sufficient peak capacity to separate all components of a natural extract, a new approach was used to pinpoint accurate masses to the bioactives found. The extract was screened twice, that is, by both RPLC and HILIC, employing two fundamentally different (orthogonal) separation principles. Using RPLC, two bioactive peaks were found in the Psilocybe McKennaii extract. For both peaks, in the parallel MS traces multiple coeluting compounds were observed for which the XICs of the matching m/z values were plotted ( Fig. 5A ). Due to the accurate peak shape and retention time matching between bioactivity and MS chromatogram, many candidates that do not exactly coelute with the bioactive peak could be excluded. Still, there were several compounds with XICs that exactly overlapped with bioactive peaks so that the m/z value of the bioactive could not be determined unambiguously. The same extract was also analyzed by HILIC ( Fig. 5B ), and the peaks observed in the bioassay chromatogram were correlated to potentially matching peaks in XICs constructed from the MS data. Slightly earlier or later eluting compounds were excluded, and the resulting candidate m/z values from this analysis were now compared with the candidate m/z values obtained from the RPLC analysis. The m/z values that were correlated to a bioactivity peak in both the RPLC and the HILIC analysis were considered to originate from an actual bioactive. The major bioactive compound observed at 3.6 min in the RPLC-MS trace was eluting at 7.1 min in the HILIC-MS analysis. The m/z of 258 was the only common value observed for these two large bioactivity peaks. The small bioactivity peak at 6.2 min in the RPLC separation was observed at 6.5 min in the HILIC separation. From the lists of m/z values observed at these retention times, the m/z of 221 was the only value observed with both the RPLC and HILIC analysis. The accurate masses for these compounds as derived from the IT-TOF data were m/z 258.110 and 221.185 (1 times charged ions), respectively. In addition, the accurate m/z values of psilocin and psilocybin, the most known alkaloids found in Psilocybe mushrooms, were observed in the sample, but both were found not to be correlating to the bioactive peaks for the α7-nAChR. Furthermore, this study also showed orthogonal HILIC separation of the crude extract instead of using traditional bioassay-guided fractionation. It is the first time this straightforward and fast approach is demonstrated. It significantly reduces the chances of loss of bioactives (e.g., by denaturation, degradation, and/or sticking/adsorption to tubes/tubing), as for every analysis fresh crude extract is used. After this fast screening procedure, the obtained m/z values can be used in follow-up studies for subsequent straightforward MS-guided purification of the bioactives. After purification, the chemical structure of the bioactives can be characterized using nuclear magnetic resonance, and they can be used for further biological studies, for example, determining their affinity to the real membrane-bound receptor and their pharmacological profile.
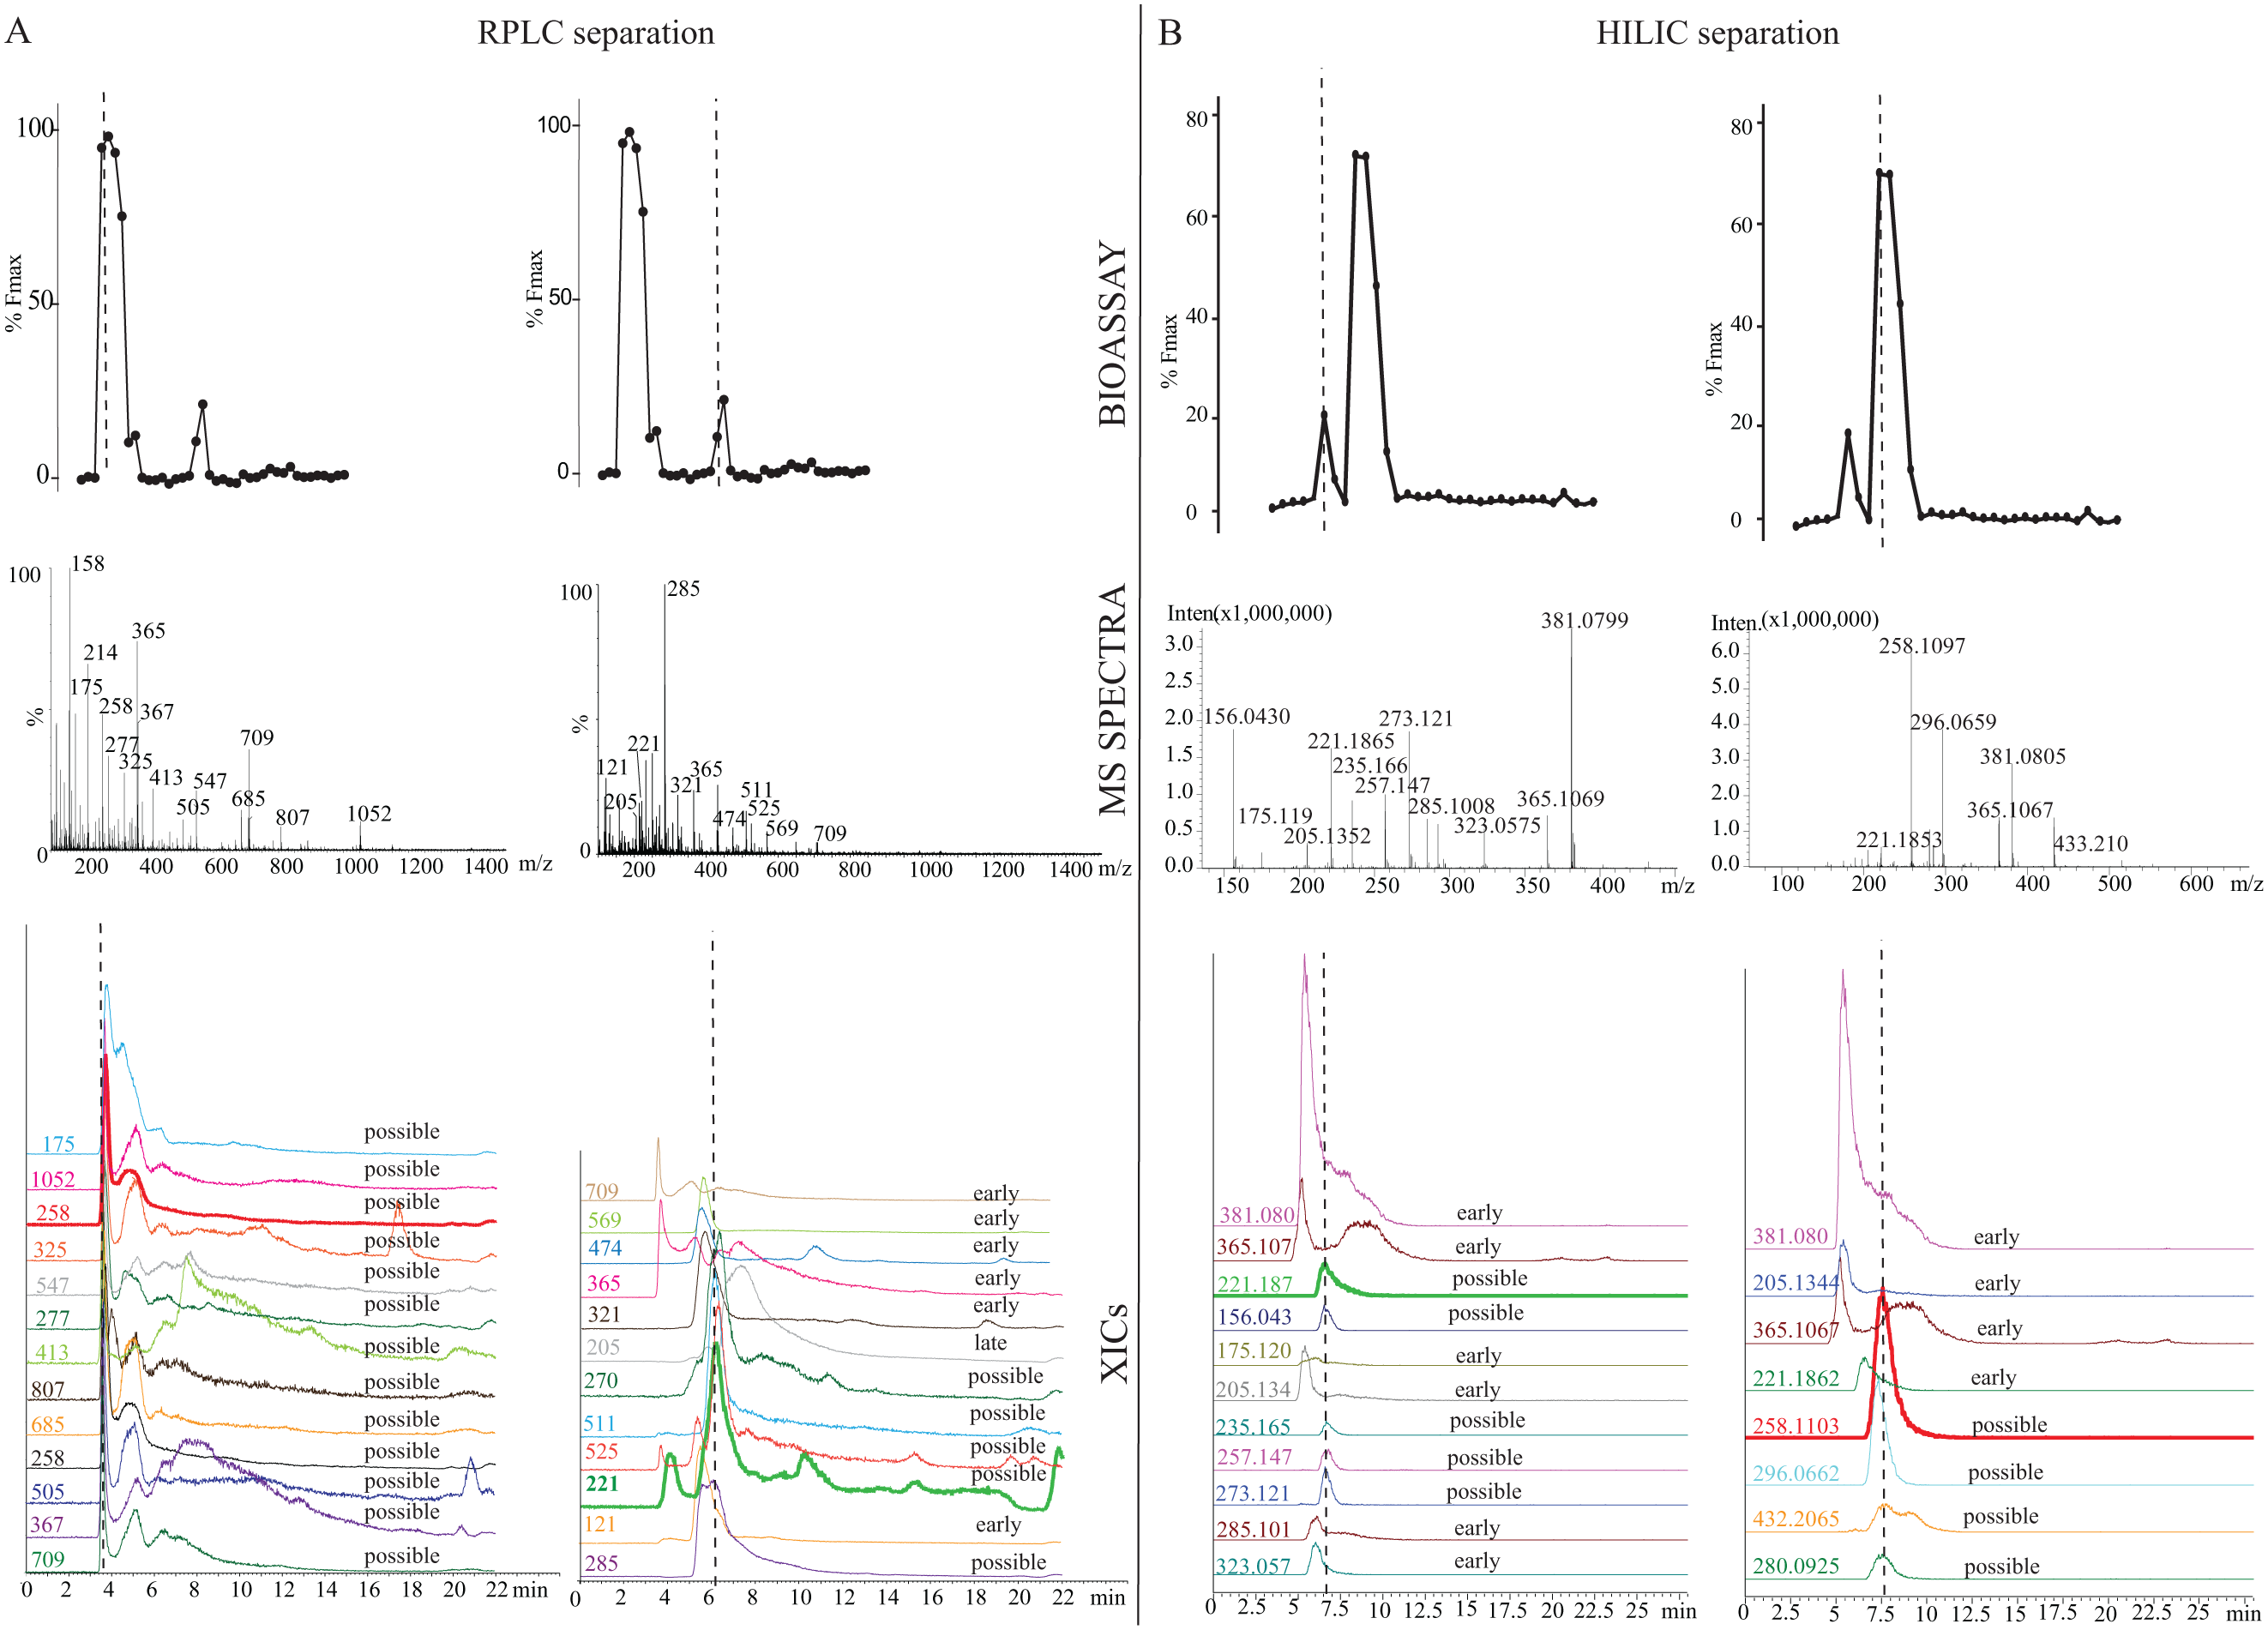
At-line cellular screening of a Psilocybe McKennaii extract in the agonist assay format. The bioassay was performed after both an RPLC and a HILIC separation. The bioactive eluting in the RPLC separation at 3.6 min was eluting at 7.1 min in the HILIC separation. When the possible m/z values for the two peaks were compared by plotting XICs and matching peak shapes and retention times, an m/z value of 258 was found to be in common. The minor bioactive eluting at 6.2 min in RPLC was eluting at 6.5 min in the HILIC separation. After correlation of the m/z values observed in this case from the two different separations, an m/z value of 221 was assigned to the minor bioactive compound.
Footnotes
Acknowledgements
We would like to thank Henry Vischer and Saskia Nijmeijer (Division of Medicinal Chemistry, Vrije Universiteit Amsterdam) for their advice regarding the Ca2+-flux assays.
Declaration of Conflicting Interests
The authors declared no potential conflicts of interest with respect to the research, authorship, and/or publication of this article.
Funding
The authors disclosed receipt of the following financial support for the research, authorship, and/or publication of this article: The work of Marija Mladic was supported by the Dutch Technology Foundation STW, which is part of the Netherlands Organization for Scientific Research (NWO) and partly funded by the Ministry of Economic Affairs (project number 11056). The work of Reka Otvos was supported by the AIMMS Bridging PhD project “Identification of Novel Bioactive Substances on Brain Receptors” (project number 10-001-203).
References
Supplementary Material
Please find the following supplemental material available below.
For Open Access articles published under a Creative Commons License, all supplemental material carries the same license as the article it is associated with.
For non-Open Access articles published, all supplemental material carries a non-exclusive license, and permission requests for re-use of supplemental material or any part of supplemental material shall be sent directly to the copyright owner as specified in the copyright notice associated with the article.