
Abstract
A new fragment library for lead discovery has been designed and experimentally validated for use in surface plasmon resonance (SPR) biosensor-based screening. The 930 compounds in the library were selected from 4.6 million commercially available compounds using a series of physicochemical and medicinal chemistry filters. They were screened against 3 prototypical drug targets: HIV-1 protease, thrombin and carbonic anhydrase, and a nontarget: human serum albumin. Compound solubility was not a problem under the conditions used for screening. The high sensitivity of the sensor surfaces allowed the detection of interactions for 35% to 97% of the fragments, depending on the target protein. None of the fragments was promiscuous (i.e., interacted with a stoichiometry ≥5:1 with all 4 proteins), and only 2 compounds dissociated slowly from all 4 proteins. The use of several targets proved valuable since several compounds would have been disqualified from the library on the grounds of promiscuity if fewer target proteins had been used. The experimental procedure allowed an efficient evaluation and exploration of the new fragment library and confirmed that the new library is suitable for SPR biosensor-based screening.
Introduction
F
Irrespective of the technique used for screening, the fragment library should contain structurally diverse compounds that can efficiently explore the chemical space relevant for drug development. 1,5,6 A variety of other characteristics are also important when selecting compounds for a library useful for lead discovery, and a few examples of library design have been published. 7–9 Compliance to Lipinski’s “rule of five” 10 has long governed the selection of leads, and a corresponding “rule of three” 11 is now commonly used for selection of compounds for fragment libraries. These filters can be complemented by additional physicochemical filters, e.g., ensuring that the fragments are soluble at the high screening concentrations required for the detection of the typically low affinities of fragment interactions. Other empirical filters can exclude reactive or metabolically active groups, as well as compounds with low tractability from a medicinal chemistry point of view. However, to date, not even the most sophisticated techniques and theories behind library design can guarantee that a collection of fragments fulfills all features required for a successful lead discovery program. Moreover, some of the compound selection criteria may need to be adjusted with respect to the screening technique and the targets of interest. There are as yet no established methods for experimental validation of fragment libraries, and there is little previous experience in the area. 7,8
A strategy for experimental validation and optimization of a fragment library, designed for screening against protein targets using SPR biosensor technology, has therefore been developed in this study. The strategy was based on a prescreening of the library against a panel of proteins of relevance for drug discovery: (1) HIV-1 protease (HIV-P; EC 3.4.23.16), a homodimeric aspartic protease; (2) human α-thrombin (THR; EC 3.4.21.5), a chymotrypsin-type serine protease consisting of a heavy and a light chain; (3) carbonic anhydrase II (CA; EC 4.2.1.1), a metalloenzyme with a catalytic zinc ion; and (4) human serum albumin (HSA), a plasma transport protein with multiple ligand binding sites. These proteins represent a broad spectrum of biochemical properties for soluble enzyme targets, as illustrated by their theoretical physicochemical and structural characteristics ( Fig. 1 ). An important factor when selecting this panel of proteins was that they could all be analyzed under the same experimental conditions. The evaluation was based on a variety of analytical parameters (e.g., solubility, target selectivity, stoichiometry, and dissociation kinetics). The procedure established that the fragments of the library had suitable properties for screening using SPR biosensor technology and has also provided interesting data for discussions on specificity and promiscuity, as well as how such characteristics can be defined and identified.
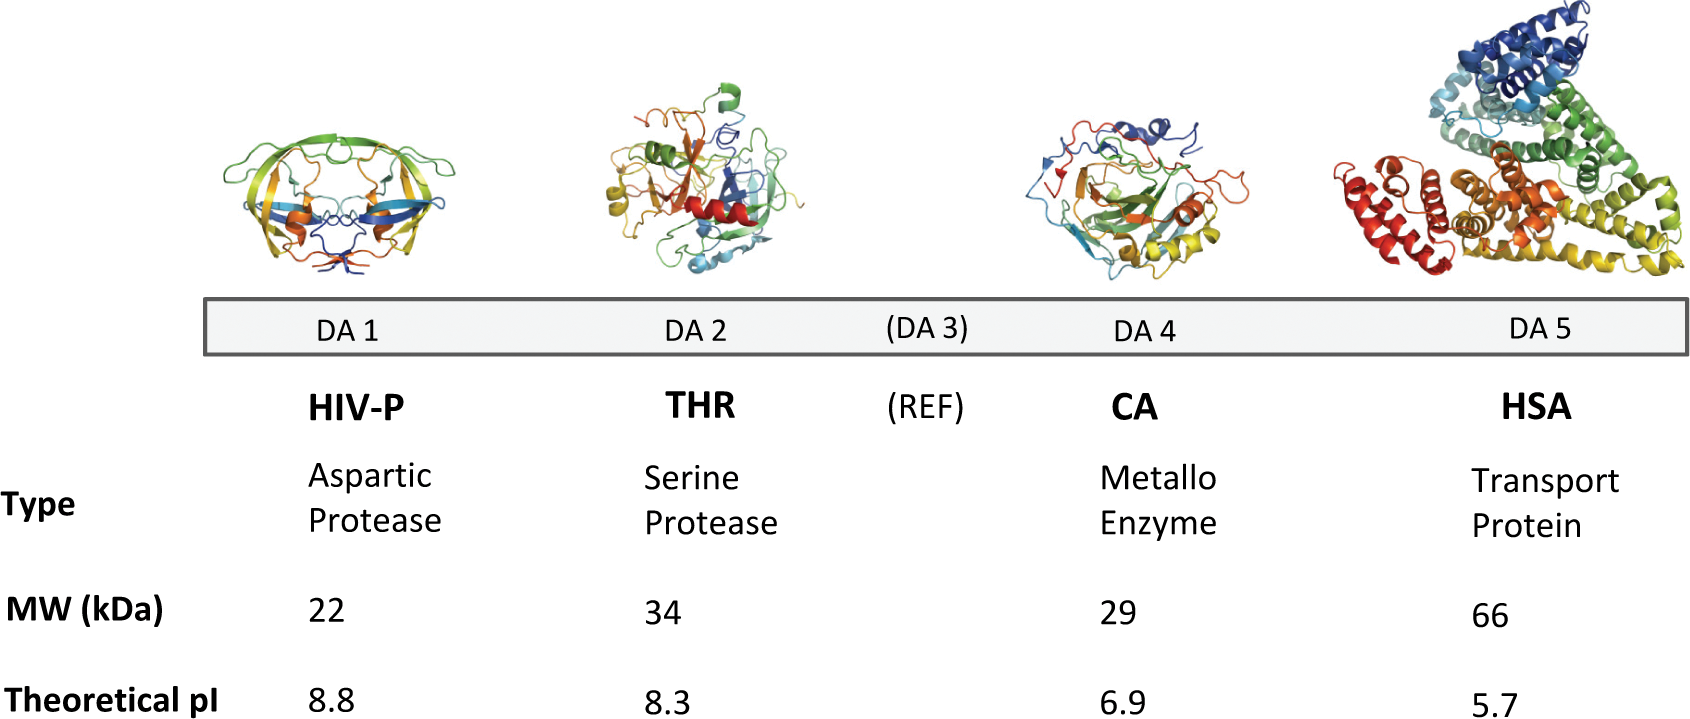
Protein panel used for screening of fragment library. The structures of HIV-1 protease (HIV-P), thrombin (THR), carbonic anhydrase II (CA), and human serum albumin (HSA) are shown in relative size above the detection area of the sensor chip to which they were immobilized. The molecular weights (MW) and characteristics for each protein are given for the functional units (i.e., the homodimer for HIV-1 protease and the heterodimer for thrombin, as well as monomers for CA and HSA). REF represents the activated and deactivated dextran surface used as reference.
Materials and Methods
Fragment library
All computational chemistry and chemoinformatics routines for the library design were performed with SYBYL 7.1 (Tripos International, St. Louis, MO). The fragment library was selected from the ZINC 7 database of commercially available compounds. 12 The desired physicochemical characteristics and the unwanted chemical groups used for filtering are specified in Table 1 . Compounds with a permanent charge were also eliminated, as well as compounds without a hydrogen bond acceptor or donor. From the filtered subset, a diverse selection was performed using clustering based on 2D UNITY molecular fingerprints in the Selector module of SYBYL. The 930 fragments in the final fragment library were purchased from 16 different commercial suppliers (see supplementary data).
Inclusion Criteria and Exclusion Filters Applied for Selection of Compounds to the Library
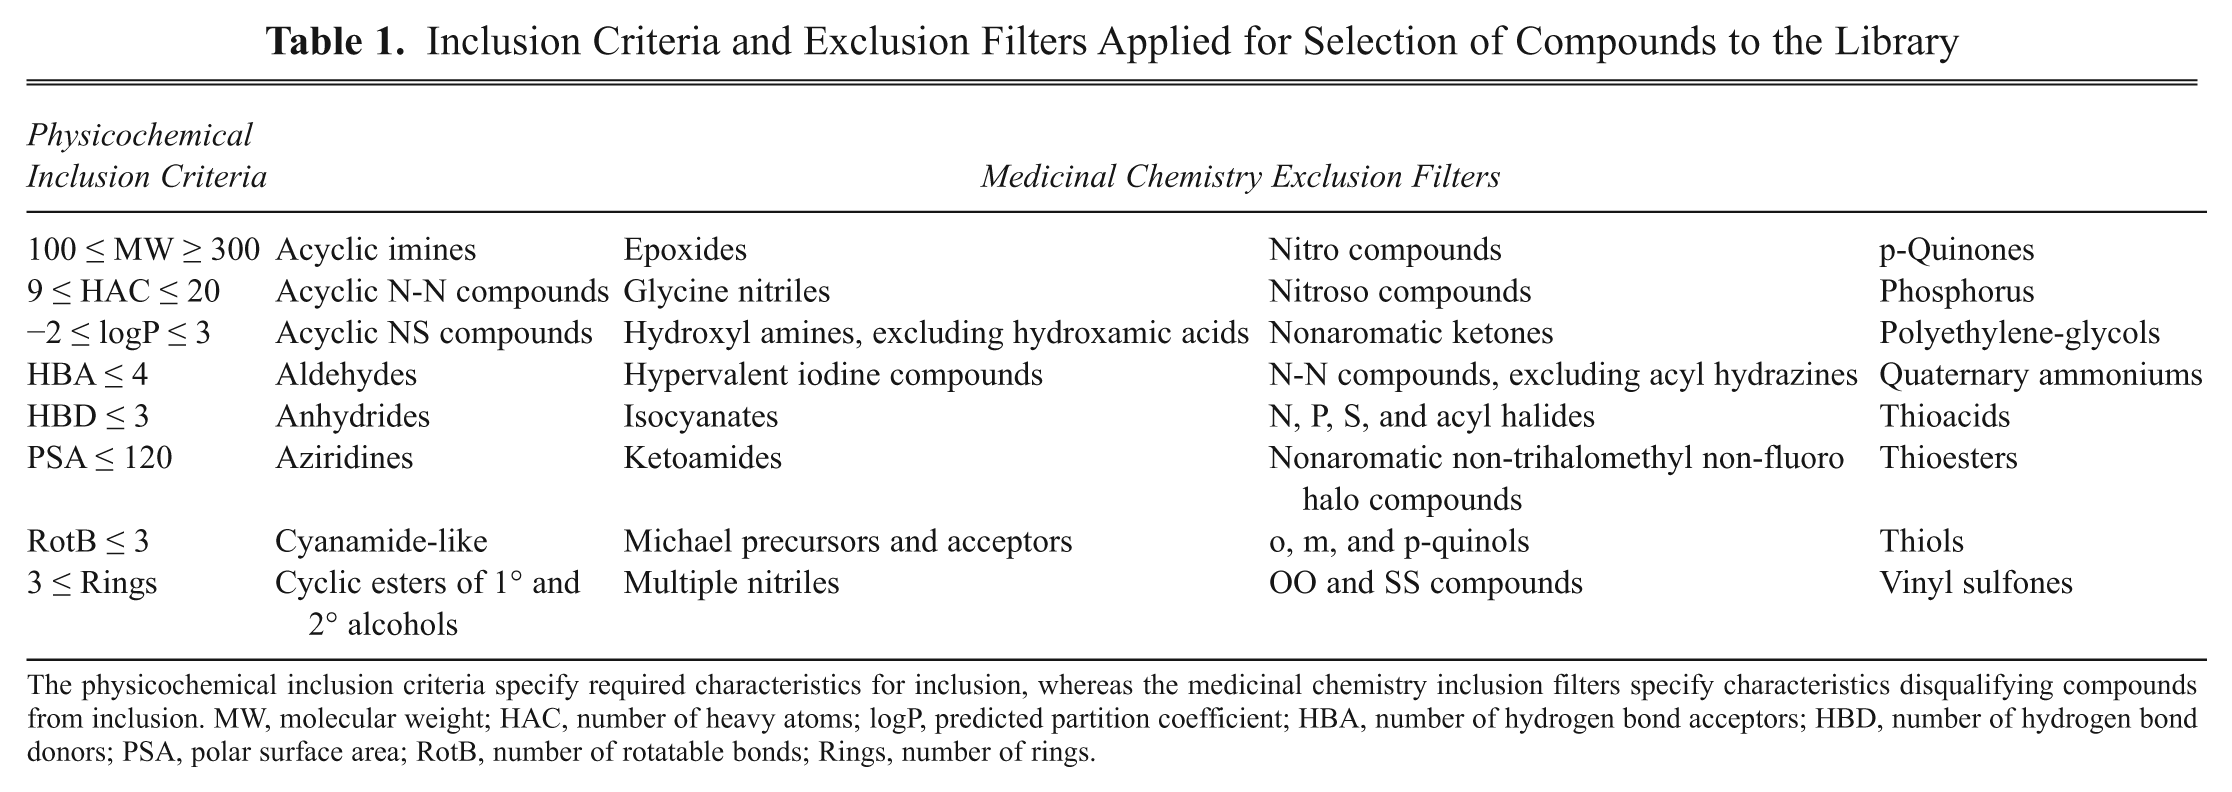
The physicochemical inclusion criteria specify required characteristics for inclusion, whereas the medicinal chemistry inclusion filters specify characteristics disqualifying compounds from inclusion. MW, molecular weight; HAC, number of heavy atoms; logP, predicted partition coefficient; HBA, number of hydrogen bond acceptors; HBD, number of hydrogen bond donors; PSA, polar surface area; RotB, number of rotatable bonds; Rings, number of rings.
Sample preparation
The compounds of the fragment library were stored as 50 mM solutions in 100% DMSO in 96-well plates (Greiner Bio-One GmbH, Frickenhausen, Germany). Plate-to-plate dilutions and 96-to-384 compressions were preformed with a Biomek® FX liquid handling system (Beckman Coulter, Fullerton, CA).
Samples for screening were serially diluted to 20 and 8 mM in 100% DMSO and then to 400 and 200 µM in PBS-P (10 mM phosphate buffer, pH 7.4, 2.7 mM KCl, 0.14 M NaCl, 0.05% Tween) with a final concentration of 5% DMSO. The last step involved the transfer of the samples into 384-well plates. Evaporation was minimized by restricting the time the plates were exposed without lids to a maximum of 30 min once the samples had been transferred to 5% DMSO.
Target proteins
Wild-type HIV-1 protease was obtained as previously described, 13 human α-thrombin was obtained from Haematologic Technologies (Essex Junction, VT), and HSA (product no. A8763) and CA II from bovine erythrocytes were both from Sigma-Aldrich Sweden AB (Stockholm, Sweden).
The MW and pI of the target proteins were estimated using the ProtParam tool in the ExPASy proteomics server of the Swiss Institute of Bioinformatics (SIB, Lausanne, Switzerland), using the following accession numbers: HIV-1 protease: P04585, thrombin: P00734, CA: P00918, and HSA: P02768.
Biosensor experiments
Experiments were performed with a BIACORE™ A100 instrument at 25 °C using reagents and research grade BIACORE™ Series S CM5 sensor chip from GE Healthcare Bio-Sciences AB (Uppsala, Sweden).
Immobilization
The 4 proteins were covalently immobilized to the sensor chip surface by amine coupling (for specific details, see supplementary data). Theoretical maximal signals for the positive controls (Rmax pc) were estimated by the following formula: Rmax pc = (Itp · MWpc/MWtp) · n, where Itp refers to the immobilization level of the target protein in response units (RU), MW is the molecular weight in Daltons, and n is the stoichiometry for the interaction between the positive control (pc) and the target protein (tp).
Screening methodology
The 930 fragments were screened in duplicates at a concentration of 200 µM in a running buffer containing PBS-P with 5% DMSO. This concentration of DMSO was used to ensure that the fragments would be soluble. The replicate experiment differed from the first experiment in that the samples were injected in reverse order. The flow rate was 30 µl/min, the injection time for the samples was 30 s, and the dissociation time was 60 s. The surface was not regenerated between sample injections.
A positive control specific for each target protein was used; 900 µM benzamidine hydrochloride (Fluka, Buchs, Switzerland) was used for thrombin, 30 µM furosemide (Sigma-Aldrich, St. Louis, MO) for CA, and 10 µM benzothiadiazine (a kind gift from Johan Neyts and the Virgil Drugpharm team, Rega Institute, Faculty of Medicine, University of Leuven, Leuven, Belgium) for HSA. Thirty µM acetyl pepstatin (Sigma-Aldrich, St. Louis, MO) was used as a positive control for HIV-1 protease in the first experiment but was replaced by 90 nM indinavir (a kind gift from Medivir AB, Huddinge, Sweden) in the second experiment due to too low response signals with acetyl pepstatin. The running buffer with 5% DMSO was used as a negative control. Both positive and negative controls were injected after every 30th sample.
Data analysis
Report points
The raw signal versus time data (sensorgrams) from the 2 replicate screening experiments were initially processed with the BIACORE™ A100 Evaluation 1.0 software (GE Healthcare Bio-Sciences AB). Data were extracted at 3 defined time points (report points) in each fragment-target interaction: the first data were extracted at a report point located 4 s before the end of the injection (binding late, BL), the second 5 s after the end of the injection (stability early, SE), and the third 5 s before the end of the dissociation phase (stability late, SL; Fig. 2 ). To validate the suitability of the selected report points, data extracted at other time points in the association and dissociation phases were also analyzed.
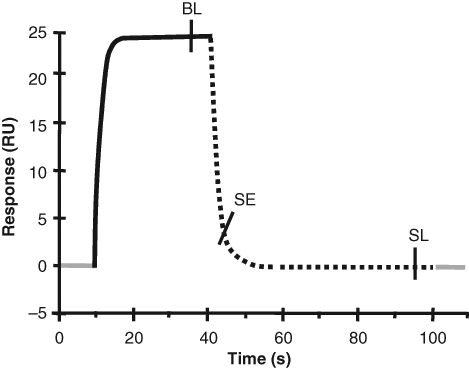
Schematic sensorgram and the positioning of the report points used for extraction of interaction data. The baseline (0–10 s and >100 s, gray), the association phase (10–40 s, solid line), and the dissociation phase (40–100 s, broken line) represent the different phases of the experiment. The binding late (BL) report point was positioned 4 s before the end of the injection (i.e., after 26 s association time), the stability early (SE) report point was positioned 5 s after the end of the injection, and the stability late (SL) report point was positioned 5 s before the end of the dissociation phase (i.e., after 55 s dissociation). RU, response units.
Correction of data
Nonspecific signals were removed by subtraction of signals from the reference area. Corrections to compensate for differences in DMSO concentrations between running buffer and samples (bulk refractive index calibration) were also performed. In addition, to convert the association data into a correct quantitative measure of complex formation, corrections to account for changes in binding capacity of the protein surfaces over the course of the experiment were made. These corrections were obtained by normalizing the response signal of the sample with respect to the response signals attained from repeated positive and negative control samples, tested at regular intervals during the experiments. A standardized signal adjustment was performed in the A100 evaluation software (surface activity adjustment), normalizing the positive controls to values close to 100 and the negative controls to values close to 0, after which the samples were adjusted relative to these limits. Normalization with respect to MW was not done at this stage.
The report points for each fragment-target interaction were exported to Excel (Microsoft, Redmond, WA) after having been processed. Data that had been corrected for nonspecific signals and differences in DMSO concentration but not for changes in surface binding capacity were processed and exported separately. A complete data set with all samples and all data from the 2 experiments were generated using Matlab software (MathWorks, Natick, MA). Corrections for molecular weight were made by dividing each corrected BL value with the MW of the corresponding sample.
Stoichiometry determination
The stoichiometry for each of the interactions was calculated for BL report points using Excel. Initially, mean and median values for the positive control signals were calculated for each target protein and respective flow cell. The median value was used to evaluate if “outliers” among the controls had a significant effect on the mean value. Given that the positive controls had a known MW and an interaction stoichiometry with the target proteins of 1:1, a theoretical response value representing a 1:1 binding interaction for each fragment could be estimated (apparent Rfragment). This was done by dividing the MW of the fragment with the MW of the appropriate positive control, followed by multiplication with the mean (or median) response value of the positive control. A stoichiometric value was subsequently obtained by dividing the corrected response value for the report point BL with the apparent Rfragment. A stoichiometric value of 7 thus represents a 7:1 interaction (i.e., most likely a result of multiple nonspecific interactions with the protein surface). This procedure takes differences in MW and surface binding capacity into account.
Dissociation ratio (DR)
To evaluate the dissociation rate for each interaction, a dissociation ratio (DR) was calculated by dividing the report point SL with the report point SE. The SL and SE values were reference subtracted but not corrected in any other way. With this parameter, an irreversible interaction is represented by a DR of 1.0. 14 To identify fragments with very slow dissociation, a kinetic threshold for DR was set to 0.8. Interactions with a DR significantly higher than 1 were visually inspected and excluded from the selection of slowly dissociating fragments if they turned out to be erroneous.
Z′ factor
The Z′ factor 15 was calculated for BL values for each target protein, both for values that were corrected for nonspecific signals and differences in DMSO concentration and for values that in addition had been corrected for changes in surface binding capacity during an experimental series. Calculations were performed according to equation (1):

where BL is the binding late report point for the negative (nc) or positive control (pc). Separate factors were calculated for the different experiments along with a mean value for both experiments.
Estimation of detection threshold
The lowest detectable affinity for each of the sensor surfaces was estimated as a theoretical KD value for the smallest fragment in the library (117 Da), using equation (2), derived from the Langmuir isotherm:

where C stands for the analyte concentration (200 µM), Rmax pc is the maximal theoretical signal for the positive control, MWf is the molecular weight of the fragment, MWpc is the molecular weight of the positive control, and Σ is the standard deviation of the negative controls. The detection threshold was defined as 3 · Σ.
Results
Characteristics of the fragment library
The fragment library was selected from a total of 4.6 million commercially available compounds using a series of selection criteria and exclusion filters ( Table 1 ). A number of physicochemical property cut-offs were initially applied to adhere to current best practices in fragment-based screening and lead discovery. 1,7,11 These reflected aspects of molecular complexity, 5,6 drug and lead-likeness, 16,17 oral bioavailability, 18 drug absorption, pharmacokinetics, 19 and medicinal chemistry tractability. 20 The fragment selection process also involved steps to ensure appropriate representation of molecular scaffolds and frameworks 21,22 as well as structural fragments of clinical compounds and marketed oral drugs. 23,24 Furthermore, filters were applied to eliminate groups known to generate reactive compounds and thereby cause false positives. 25,26 Finally, a diverse selection was made to generate a shortlist of compounds for the fragment library. The procedure efficiently generated a collection of 930 compounds with a physicochemical property profile described in Table 2. An aggregate purchase of the compounds from 16 different vendors (see supplementary data) was performed to physically compile the fragment library.
Physicochemical Property Profile of the Fragment Library
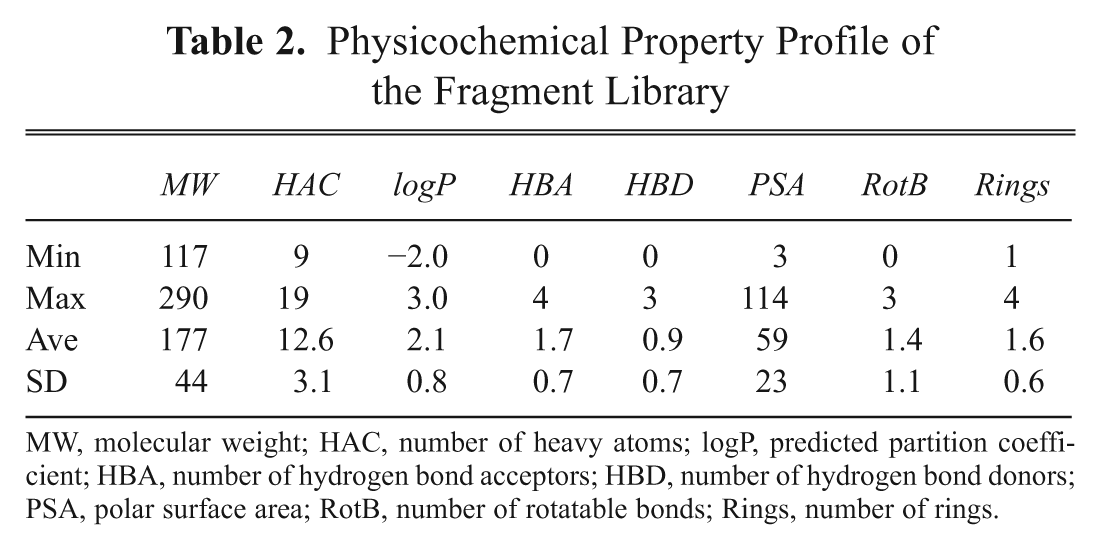
MW, molecular weight; HAC, number of heavy atoms; logP, predicted partition coefficient; HBA, number of hydrogen bond acceptors; HBD, number of hydrogen bond donors; PSA, polar surface area; RotB, number of rotatable bonds; Rings, number of rings.
Target proteins and sensor surfaces
The screening was performed with HIV-1 protease, thrombin, and carbonic anhydrase immobilized to 4100 to 6900 RU and HSA to 11,900 to 14,400 RU. The consumption of enzyme for the experiments was 0.04 mg for HIV-1 protease, 0.025 mg for thrombin, 0.12 mg for carbonic anhydrase, and 0.8 mg for HSA. The apparent binding capacity of the immobilized enzyme surfaces was estimated by comparing a theoretical maximal signal for the positive controls (Rmax pc) with the average experimental signal obtained for the positive controls. The calculation indicated that the thrombin and HSA surfaces had full binding capacity, whereas the carbonic anhydrase surface only had 40% of the theoretical binding capacity and the HIV-1 protease surface an apparent binding capacity of about 10%. The differences in the apparent binding capacities for the different proteins are most likely not a consequence of suboptimal conditions for the immobilization or the experiments but simply a characteristic of the protein preparations used for this study.
Screening and data analysis
The screening of 930 fragments against 4 targets took 15 h and 30 min to complete; this was repeated with a different sample order, thus doubling the time for the experiment. All fragments appeared to be soluble at the screening concentration of 200 µM, as estimated by visual inspection of the samples and the absence of interaction signals typical for compounds with solubility problems. 27 Interaction data were therefore obtained for all fragments. A complete set of 9040 raw signal versus time data (sensorgrams) was generated.
Interaction data for 6 compounds were excluded from the data set in the correction procedure because of too high differences in DMSO concentration between sample and running buffer. However, none of these compounds gave unacceptable data in both of the 2 screening experiments, so the final data set therefore consisted of all compounds, represented by at least 1 interaction per target protein. The Z′ factor was calculated for the fully corrected BL report point values for each surface: HSA 0.84, carbonic anhydrase 0.73, thrombin 0.87, and HIV protease 0.71.
The 2 experiments, performed in opposite sample order, gave the same qualitative results, although the quantitative data were not identical. Importantly, most of the samples with atypical interaction profiles, such as high stoichiometry or very slow dissociation, were identified as such in both experiments.
Interaction profile of fragment library
To get an overview of the interactions between the fragments and all 4 proteins, the averages for fully corrected BL report point data from both experiments were plotted for each fragment ( Fig. 3A ). In this graph, the lowest significant signal (i.e., detection threshold) was defined with respect to the negative control and set as the average signal plus 3 times the standard deviation (SD) for the negative controls. This value differed depending on target protein and experiment, but the mean values for the respective targets were 11.6 RU for CA, 7.4 RU for HSA, 5.3 RU for THR, and 12.0 RU for HIV-P. The detection thresholds can be translated to sensitivities, expressed as the lowest affinities (KD values) that could be theoretically detected for the smallest fragments of the library (117 Da), here estimated to 0.28 mM for CA, 0.42 mM for HSA, 0.48 mM for THR, and 0.45 mM for HIV-P (i.e., quite similar).
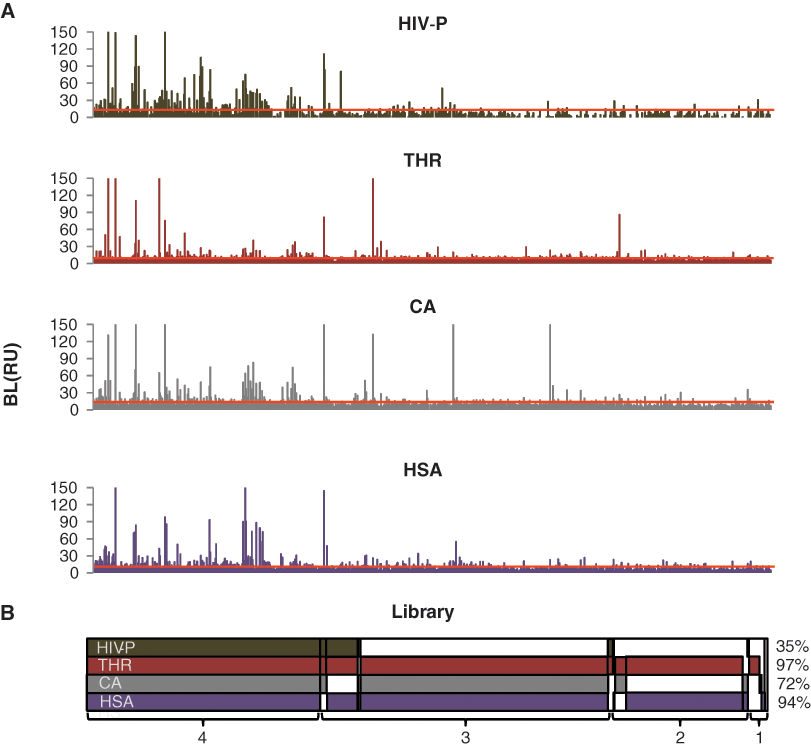
Overall profile of the fragment library. The fragments were sorted according to their specificity for the target proteins (i.e., if they interacted with 4, 3, 2, 1, or 0 proteins) and according to their sample number within each group (from low to high). (
Using this threshold, 267 fragments (29%) were detected to give rise to significant signals with all target proteins, whereas 6 fragments did not give signals with any of the proteins. Moreover, 50 fragments (5%) were detected to interact with a single target protein, which was typically thrombin or HSA. No fragment interacted solely with HIV-1 protease. Note that these numbers represent the sensitivity of the different sensor surfaces with respect to the defined detection threshold and must not be confused with hit rates (see Discussion).
To determine the distribution of the fragments identified to interact with the different proteins, all fragment samples above the detection threshold in either of the 2 experiments were identified and visualized according to their selectivity for the different proteins (
Fig. 3B
). Using this slightly relaxed criterion for the identification, more than 90% of the fragments were detected to give signals significantly higher than the blanks with thrombin and HSA, 72% of the fragments with CA, and 35% with HIV-1 protease. The small differences in the fragments that show up in the 2 graphs (
In addition to the characterization of the interaction profile of the library as a whole, the profile of each individual fragment that gave a signal above the detection threshold was analyzed. Since the aim of this analysis was to identify fragments that exhibited unsuitable characteristics for screening using SPR biosensor technology, the focus was on identifying super-stoichiometric fragments and fragments with very slow dissociation rates.
Identification of super-stoichiometric fragments
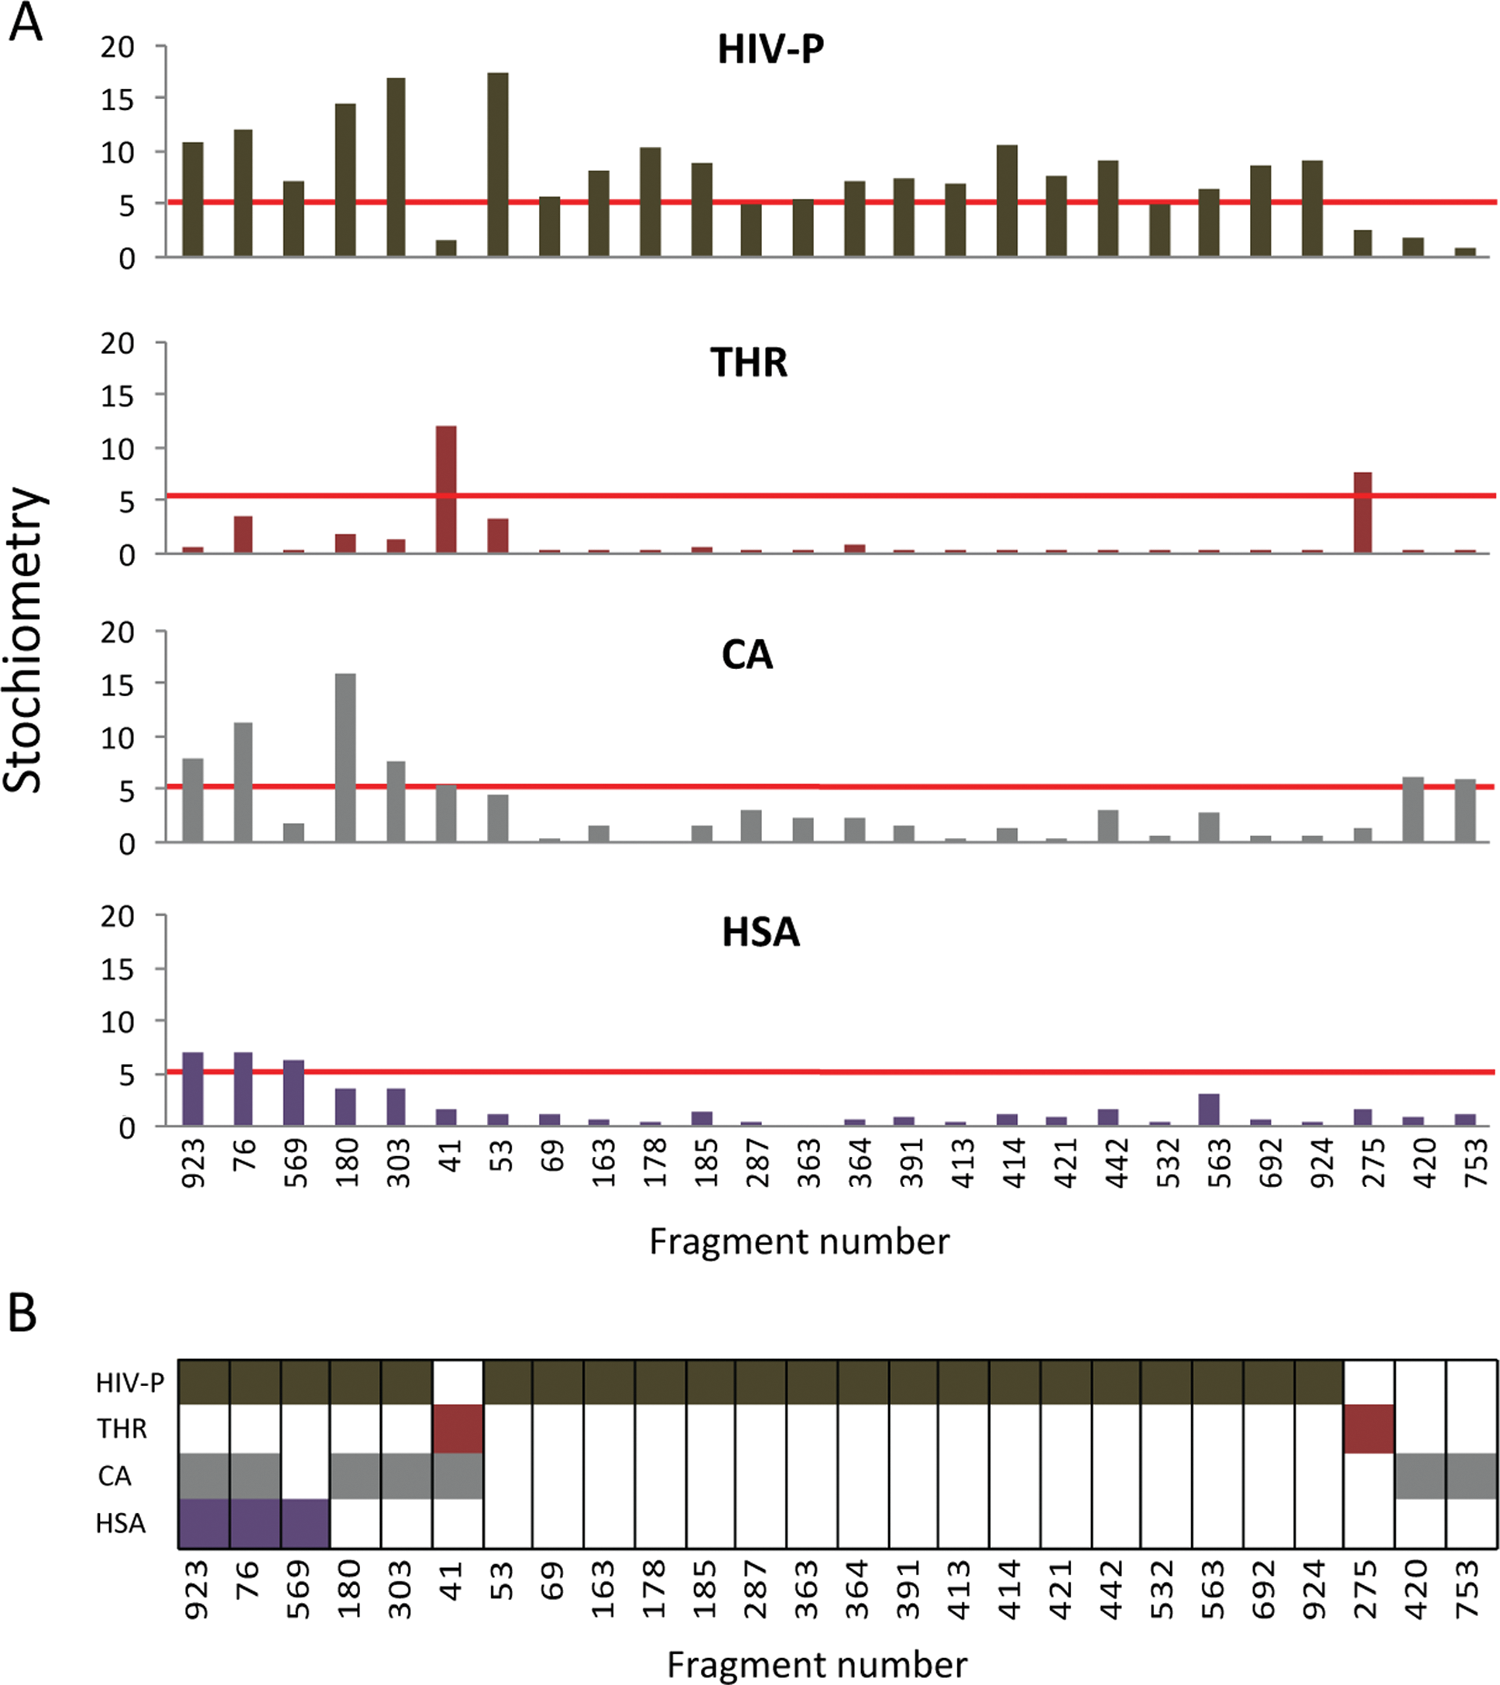
The stoichiometry in the late association phase (BL) was calculated for each sensorgram to identify fragments that were defined as super-stoichiometric (i.e., interacted with a stoichiometry ≥5:1 and therefore represent fragments that appear to interact with more than 1 or a few defined binding sites). The analysis showed that 26 fragments (3%) were above this threshold for at least 1 of the target proteins ( Fig. 4A ). Six of these fragments were unselective (i.e., fulfilled this criterion for 2 or more proteins; Fig. 4B ), but none showed this behavior for all 4 proteins. An analysis of the distribution of these apparent higher order interactions between the target proteins revealed that a large majority (22/26) of the identified fragments interacted with HIV-1 protease.
(
Identification of fragments with slow dissociation rates
A visual inspection of the sensorgrams indicated that a general and clear kinetic pattern could be observed for the majority of the interactions, with most interactions having both fast association and dissociation rates for all 4 proteins, resulting in typical “square-pulse sensorgrams” ( Fig. 5 , upper row). This general pattern was true for all target proteins; only the magnitude of the signals varied. But to detect slowly dissociating fragments, which can block the sensor surfaces and give rise to false negatives in succeeding injections, a kinetic analysis of sensorgrams with report point values above the detection threshold was performed. Due to the large number of sensorgrams, it was not practical to use a method based on visual inspection, and fragments with slow dissociation rates were therefore identified as those with dissociation ratios (DR = SL/SE) above 0.8. 14 Still, a visual inspection of the sensorgrams for these fragments was found to be important to exclude compounds that exhibited a very fast dissociation immediately after the end of the injection but had leveled out already after 5 s (i.e., at SE).
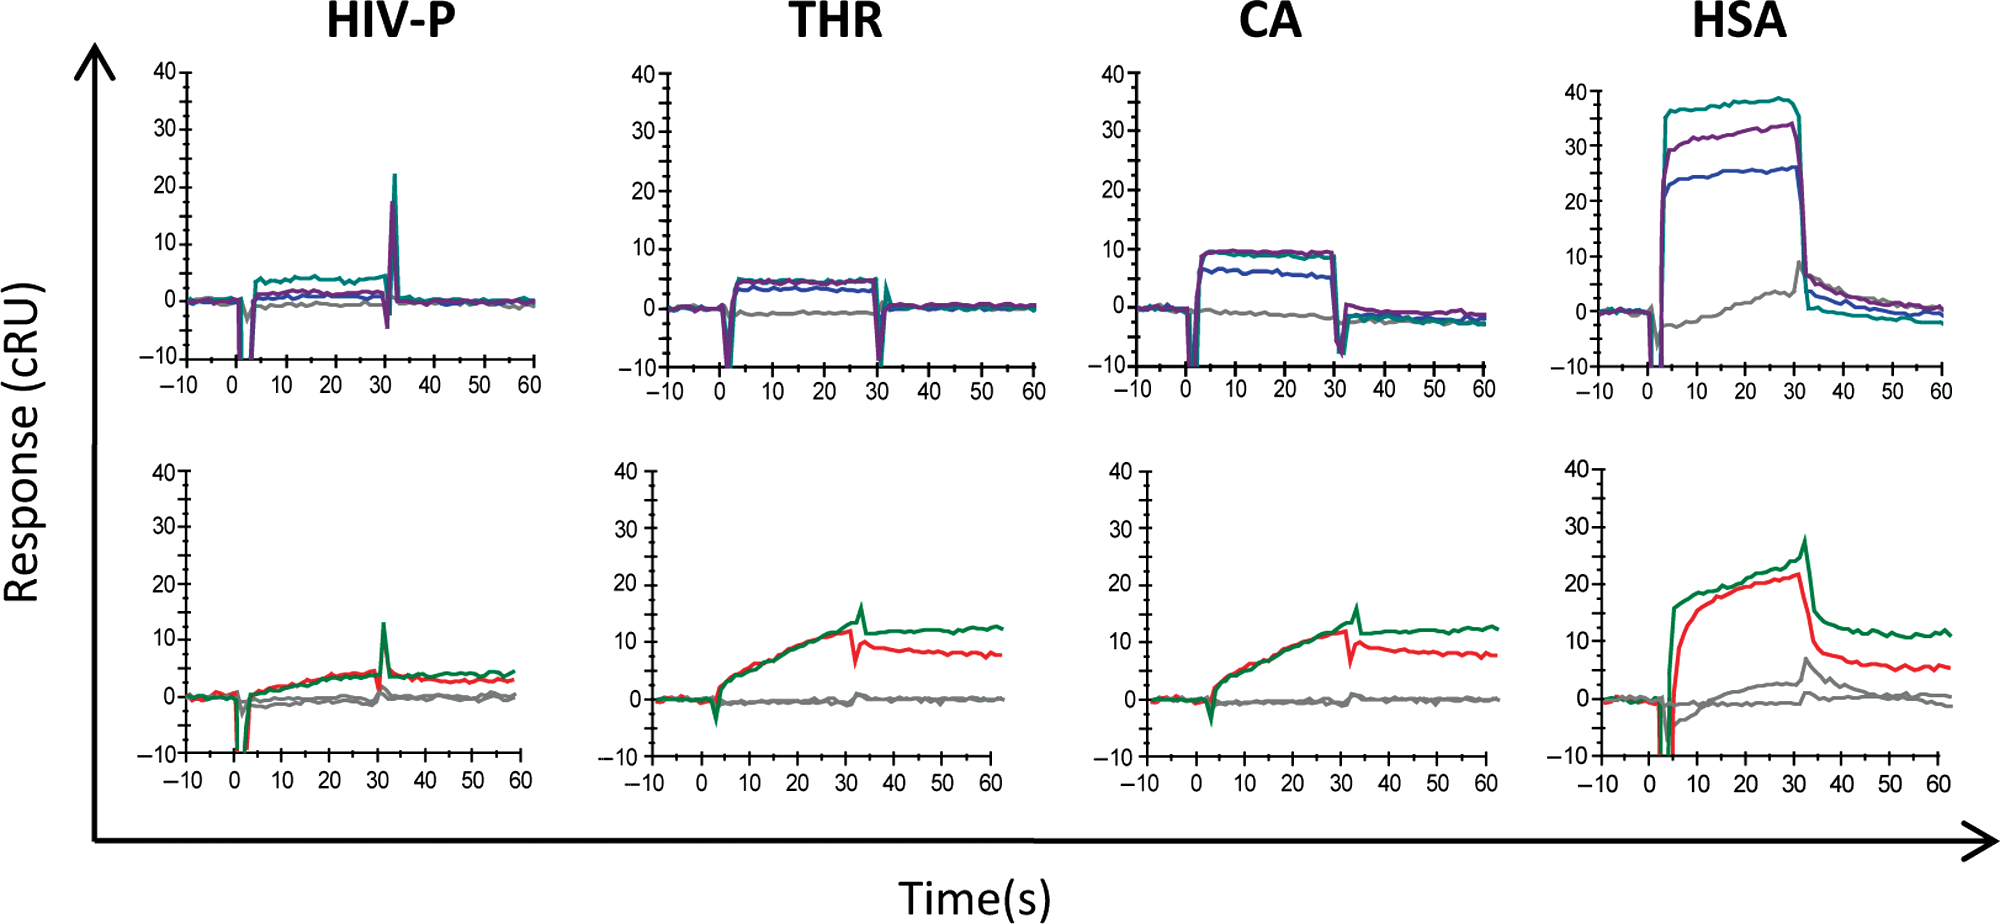
Sensorgrams for the 4 target proteins and 3 different fragments (blue, violet, and cyan) exhibiting the typical kinetic profile for fragments (i.e., fast association and fast dissociation; upper row) and for 2 fragments (#785 = green and #594 = red) identified to dissociate very slowly from all 4 proteins (lower row). The sensorgrams were reference subtracted, and negative controls are shown in gray. HIV-P, HIV-1 protease (HIV-P); THR, thrombin; CA, carbonic anhydrase II; HSA, human serum albumin.
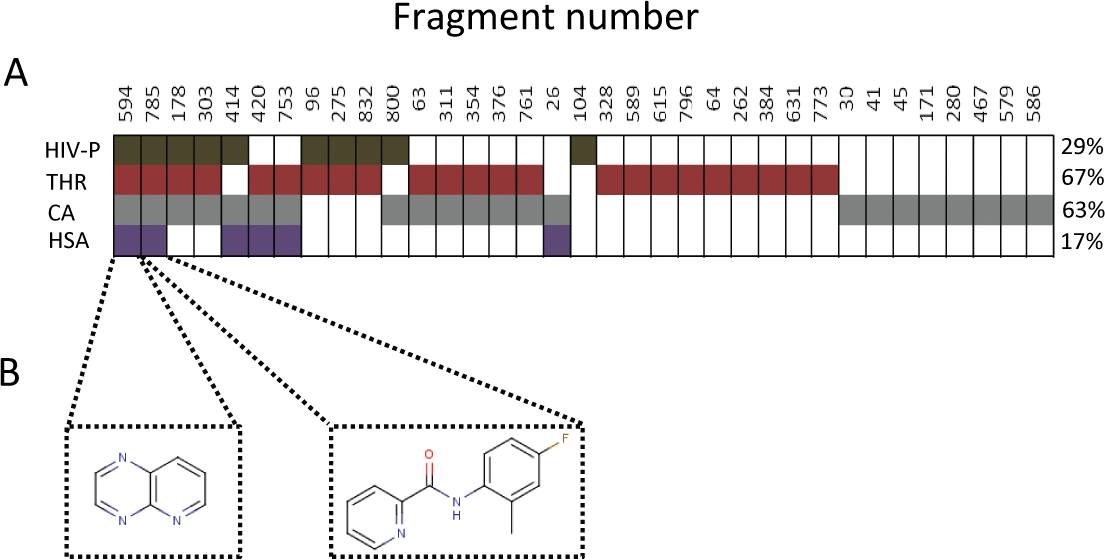
This analysis identified 35 fragments with very slow to no dissociation from at least 1 of the proteins ( Fig. 6A ). Two fragments ( Fig. 6B ) showed essentially no dissociation from all 4 proteins (with respect to the timeframe for the dissociation phase used here; i.e., 60 s). The sensorgrams for these samples are shown in Figure 5 (bottom row). An analysis of the distribution of these apparently irreversible interactions between the target proteins revealed that a large majority of the identified fragments involved carbonic anhydrase (22) and thrombin (23). A few fragments showed both slow dissociation and a stoichiometry ≥5:1 with the same protein.
(
Discussion
Screening of fragment libraries is dependent on (1) a well-designed library, (2) a suitable screening technique with an efficient experimental design, (3) reliable methods for data analysis, and (4) appropriate hit selection criteria. The first 3 aspects have been addressed in this study, whereas the fourth aspect has been the focus of subsequent studies (manuscripts in preparation). We show that established criteria used for the design of a fragment library appear to be appropriate also for a library intended to be screened using SPR biosensor technology. This study gives a perspective on some critical features important for validation and screening of a new fragment library.
A primary concern was the solubility of the fragments as it defines the maximal concentration that can be used for screening. Due to the weak affinities expected from fragments, it is an advantage to use high concentrations of fragments (e.g., up to 1 mM). But poor solubility can give rise to both false-negative and false-positive signals as a result of lower than nominal concentrations and aggregation of the compound on the surface, respectively. More often, the signals are simply distorted and give unreliable data. However, when dissolved in DMSO and screened at 200 µM, none of the fragments in the library was found to give the aberrant type of sensorgrams typically associated with poor solubility or promiscuous binding. Still, for 6 of the compounds, reliable data could be retrieved from only 1 of the experiments because of experimental problems arising from insufficient corrections for DMSO signals in the samples. This emphasizes that the preparation of samples for screening using SPR biosensor methodology indeed is a critical step and requires robust procedures for dilution of the fragments and minimization of solvent evaporation. The correction procedures adequate for higher affinity interactions and larger compounds may evidently not be sufficient for fragments.
However, even if the fragments were soluble at the screening concentration, a major concern was that this relatively high concentration would result in higher order secondary interactions with the sensor surface. This could occur via defined interactions with multiple defined sites or via completely nonspecific interactions with the protein surface or sensor matrix. Since SPR signals are correlated with the amount of analyte that interacts with the sensor surface, an analyte interacting with a significant affinity to 1 site can result in similar signals as an analyte interacting with weak affinities to multiple sites. Although higher order secondary binding is a potential problem for screening using SPR biosensor technology, the method presented here is well suited to detecting the problem by estimating the stoichiometry of binding.
Promiscuity is another property for which stoichiometry has been used as a determining parameter when using SPR. However, calculations of stoichiometry when screening fragments using SPR are full of pitfalls and have to be interpreted with caution. Small molecules can namely differ at least 2- to 3-fold in the SPR signal (refractive index increment 28 ), and secondary effects on interactions (e.g., conformational changes) can influence the signals and make them deviate from a simple 1:1 relationship, even when the interactions are 1:1. The latter has, for example, been shown for the interaction between Ca2+ and C-reactive protein where the signal was 10-fold higher than expected from the interaction alone. 29 Another factor that can influence the interpretation of stoichiometry for fragments is that the calculation is based on the apparent binding capacity of the protein surface, which is determined on the basis of the surface interaction with a reference compound. If the apparent binding capacity of a protein surface is very low, it means that a large fraction of the immobilized protein population does not bind the positive control to the expected extent. This may, however, not necessarily affect the binding of the much smaller fragments to the same extent since they are not dependent on a properly folded binding site. A stoichiometric calculation may therefore be somewhat misleading, with a bias toward higher stoichiometry when the surface binding capacity is low. This may explain why interactions with a high stoichiometry were most common with HIV-1 protease and CA, the 2 surfaces with the lowest binding capacities in the present study.
Due to the difficulties in estimating a robust stoichiometric value for a fragment, a super-stochiometric threshold value of 5:1 was used as an indicator of higher order secondary interactions and plausibly promiscuous behavior. Notably, none of the fragments exceeded the super-stochiometric criterion for all 4 proteins. This emphasizes that stoichiometry as a criterion for promiscuity should be used with caution since it is clearly target dependent.
Another concern was that the library would contain fragments that dissociated slowly from the sensor surfaces. Such compounds are problematic in SPR biosensor screening since they may block the surface or, through carryover, mask the binding of fragments in subsequent cycles. They may also cause baseline shifts that influence the interpretation of signals in later injections. Slow dissociation may be associated with fragments containing reactive or chelating groups that bind essentially irreversibly to the target. It may also be associated with super-stochiometric compounds, which can exhibit slow association and/or slow dissociation due to binding to proteins in the form of micelles or other aggregates. The kinetics can be explained by the equation that describes the observed rate of complex formation or decomposition:

It illustrates that the association rate constant (kon) must be questionably low for a slow association to occur at concentrations as high as 200 µM. It also shows that if the (free) fragment concentration is decreased by fragment aggregation, the rate of association will appear to be slow only if the dissociation rate constant (koff) is relatively slow, which is unlikely for fragments. Consequently, there are several reasons for avoiding slowly dissociating compounds in the early stages of a drug discovery program, making it an important characteristic to evaluate in a new fragment library. To facilitate the identification and to avoid misinterpretations of data from such fragments, 2 screening series with different sample order were used in the present experimental setup.
Several of the fragments that exhibited slow dissociation also exhibited slow association, but only 2 compounds exhibited essentially irreversible interactions with all 4 proteins. The irreversibility was judged on the basis of DR, a simple parameter defining the rate of dissociation on the basis of report points in the dissociation phase. Interestingly, these 2 compounds have later been found to dissociate relatively rapidly from cytomegalovirus protease, illustrating that they may still be of value (manuscript in preparation). Yet, it is probably a good idea to run them at the end of the screening and with longer dissociation times. Although there are several practical disadvantages of fragments interacting with higher order stoichiometry or slow kinetics, these characteristics are not bad per se. However, such hits need to be validated with an experimental design that can establish the mechanism of interaction.
Finally, 4 different proteins with different physicochemical properties and active site features were used to assess the characteristics of the fragment library. Selectivity as such is probably not a critical factor for fragments, but it is expected that a library should have a unique interaction profile for each target and that the fragments do not simply stick to any proteinaceous surface or the sensor surface itself. The aim was therefore to verify that there was a certain degree of discrimination for different targets. There are no previous studies (to the best of our knowledge) that compare the interactions of a fragment library with several targets, and there are no established criteria for the suitability of a certain library for a certain target. The obtained library profile showed that there was a certain degree of discrimination between the proteins and that different sets of fragments would be suitable, depending on the target of interest, as the pool of compounds from which hits could be fished out in a screening experiment. Since the sensitivity of each sensor surface influenced the detection threshold and the sensitivities for the 4 protein surfaces differed markedly, the fraction and absolute number of compounds identified for each protein should be interpreted with caution. The situation is illustrated by the data from the HIV-1 protease surface; fewer compounds interacted with HIV-1 protease than with the other proteins, most likely as a result of both the lower binding capacity and the low sensitivity of the protease surface. For proper establishment of selectivity relative different proteins, it is essential to use assays normalized with respect to sensitivity. However, this was not the purpose of the current experiments.
The number of compounds detected to interact with the protein surfaces was much higher than “hit rates” commonly achieved in screening campaigns. This is a consequence of the highly sensitive technology used and its ability to detect very weak and transient interactions as well as of the experimental design, which aimed at evaluating the characteristics of a library, not to identify hits. The detection threshold was based on a statistical value that represented the highest signal expected for a negative control used simply to identify compounds that gave significant signals for the surface. A proper ranking and hit identification would have demanded a modified experimental setup and hit selection criteria optimized for the characteristics of hits of interest. This is the topic of subsequent studies using the fragment library against other targets (manuscripts in preparation).
Footnotes
Acknowledgements
We thank Evert Homan from Beactica AB for assistance in the analysis of the characteristics of the proteins, Medivir AB for the gift of indinavir, and Johan Neyts and the Virgil Drugpharm team for the gift of benzothiadiazine. The project was supported by the Swedish International Cooperation Agency (SIDA) and VINNOVA (Swedish Governmental Agency for Innovation Systems).
References
Supplementary Material
Please find the following supplemental material available below.
For Open Access articles published under a Creative Commons License, all supplemental material carries the same license as the article it is associated with.
For non-Open Access articles published, all supplemental material carries a non-exclusive license, and permission requests for re-use of supplemental material or any part of supplemental material shall be sent directly to the copyright owner as specified in the copyright notice associated with the article.