
Abstract
Recently, new technologies based on biosensors and called label free have been developed. These technologies eliminate the need for using markers and dyes. The authors applied one of these technologies, based on measurement of cell impedance variation, to study the pharmacological profiles of ligands for the cannabinoid receptor 2 (CB2), a Gi-coupled receptor, and for the metabopotropic glutamate receptor 1 (mGluR1), a Gq-coupled receptor. Reference agonists and antagonists/inverse agonists for the 2 receptors were applied to recombinant cell lines and impedance monitored over time. Agonists (JWH133 and CP55940 for CB2; quisqualate, glutamate, 1S-3R-ACPD, and S-3,5-DHPG for mGluR1) triggered a variation of impedance consistent in both potency and efficacy with data obtained using classical assays measuring cAMP or Ca2+ levels. This effect was not present in the parental nontransfected cell line, confirming specific receptor-mediated response. Application of antagonists (AM630 for CB2; YM298198, SCH1014222, J&J16259685, and CPCCOEt for mGluR1) reduced agonist-induced impedance changes. The only exception was the mGluR1 antagonist BAY367620 that, while active in the Ca2+ assay, was inactive in the impedance assay. Overall, these results confirm the possibility of using cell impedance–based technology to study the pharmacological profile of ligands acting at G-protein-coupled receptors coupled to different downstream signaling pathways.
C
Label-free devices are based on biosensors that, thanks to a transducer, are capable of transforming molecular interactions into electrical signals. The most widespread label-free technologies presently available are based on optical biosensing. However, more recently, instruments equipped with biosensors capable of exploiting acoustic resonance, differential calorimetry, and microcantilever or electrical impedance have been developed. 1
The impedance-based biosensors are of particular interest for their potential widespread application. At present, 4 different platforms based on cell impedance are on the market: ECIS (from Applied Biophysics, Troy, NY), Bionas 2500 (from Bionas, Rostack, Germany), Cell Key (from MDS Sciex, Concord, Ontario, Canada), and RT-CES from ACEA (now commercialized by Roche as xCELLigence, Roche Applied Science, Penzburg, Germany). These platforms were successfully applied to study cytotoxicity, cell adhesion, cell proliferation, cell migration, and receptor-mediated signaling. 2,3 Considering the importance, from a drug discovery perspective, of G-protein-coupled receptors (GPCRs), the use of cell impedance–based technologies to monitor GPCR activity is of particular interest. The study of various GPCRs (H1, D1, D2, D5, 5-HT1A, 5-HT2B, M1, CB1, and MC4) demonstrated the possibility of evaluating different second-messenger coupling as well as identifying agonists and inverse agonists. 3,4 We decided to extend the evaluation of this technology by studying other GPCRs with the RT-CES platform. For this purpose, 2 receptors were chosen: cannabinoid receptor 2 (CB2) and metabotropic glutamate receptor 1 (mGluR1). The pharmacology of these 2 receptors is well known, 5,6 as well as their intracellular downstream signaling pathways. The CB2 is Gi-coupled, and its activation triggers a decrease in intracellular cAMP level, whereas mGluR1 is Gq-coupled, and its stimulation is linked to phosphoinositide (PI) hydrolysis and intracellular Ca2+ mobilization. Using recombinant systems expressing either CB2 or mGluR1, we were able to demonstrate that cell impedance measurement is suitable to identify agonists, antagonists, and inverse agonists at these receptors. The results obtained with this technology are comparable with that obtained using classical assays detecting cAMP or calcium transient.
Materials and Methods
Compounds
Agonists
1S-3R-ACPD ((±)-1-Aminocyclopentane-trans-1,3-dicarboxylic acid); S-3,5-DHPG (3,5-dihydrophenylglycine); L-glutamate ((S)-1-Aminopropane-1,3-dicarboxylic acid); quisqualate ((L)-(+)-a-amino-3,5-dioxo-1,2,4-oxadiazolidine-2-propanoic acid); CP55940 ((-)-cis-3-[2-Hydroxy-4-(1,1-dimethylheptyl)phenyl]-trans-4-(3-hydroxypropyl)cyclohexanol); JWH133 ((6aR,10aR)-3-(1,1-Dimethylbutyl)-6a,7,10,10a- tetrahydro-6,6,9-trimethyl-6H-dibenzo[b,d]pyran); and AM630 (6-Iodo-2-methyl-1-[2-(4-morpholinyl)ethyl]-[1H-indol-3-yl](4-methoxyphenyl)methanone).
Antagonists
JNJ16259685 (3,4-dihydro-2H-pyrano[2,3-b]-quinolin-7-yl)-(cis-4-methoxycyclohexyl)-methanone; YM298198 (6-Amino-N-cyclohexyl-N,3-dimethylthiazolo[3,2-a]benzimidazole-2-carboxamide hydrochloride); CPCCOEt (7- (Hydroxyimino)cyclopropa[b]chromen-1a-carboxylate ethyl ester); and BAY36-7620 [(3aS,6aS)-Hexahydro-5-methylene-6a-(2-naphthalenylmethy1)-1H-cyclopenta[c]furan-1-one]. All agonists and antagonists were purchased from Tocris Cookson (Bristol, UK), except for SCH1041222, which was synthesized by Schering Plough (Kenilworth, NJ).
Cell cultures
Parental Chinese hamster ovary (CHO) cell line (ATCC, Manassas, VA) was grown in F12 medium (Ham nutrient mixture) + 10% fetal bovine serum (FBS) + 100 µg mL−1 penicillin/streptomycin (P/S). The cell line expressing CB2 was maintained in the above medium containing G418 (600 µg mL−1) for clone selection, whereas the cell line expressing mGluR1 was maintained in Dulbecco’s modified Eagle’s medium (DMEM), supplemented by 10% FBS, 100 µg mL−1 P/S, 100 µg mL−1 Glutamax, and 600 µg mL−1 G418. Cell lines were grown at 37°C with 5% CO2. For mGluR1 recombinant cell line, the complete medium was substituted 6 h after plating with a serum-free DMEM high glucose, 3 U mL−1 glutamic-pyruvic transaminase (GPT; Sigma, St. Louis, MO), and 5 mM sodium pyruvate (Invitrogen, Paisley, UK). Culture splitting was performed by detaching the cells with 0.5% trypsin/EDTA, and cells were plated at different concentration (see below) and maintained in the incubator at 37°C with 5% CO2. The method employed for the generation of hCB2 and hmGluR1 transfected cell lines and their characterization was reported previously (Mancini et al. 7 and submitted US patent, respectively).
RT-CES measurement of cell-electrode impedance
Experiments were performed using the E-Plates™ from ACEA (San Diego, CA). One day before the experiment, 50 µL of medium was added to each well and background recorded. Following background measurement, 50 µL of media containing the cell suspension was seeded on the E-Plate™, incubated at room temperature for 1 h and then placed on the device station, and hosted in an incubator at 37°C with 5% CO2. The cells were allowed to equilibrate for 24 h and impedance constantly monitored every 2 min for the first 2 h and every 30 min for the remaining time. To evaluate the effect of cell density on impedance responses and to identify the better signal-to-noise ratio, we tested cell densities ranging from 10,000 to 50,000 cells/well. In addition, experiments were performed to establish if DMSO, the solvent in which compounds were solubilized, could influence cell impedance. For this purpose, cell media were discharged and replaced with Hank’s balanced salt solution (HBSS) containing DMSO concentration ranging from 0.003% to 3%, and impedance was monitored every 70 s.
To evaluate compounds activity, culture media was discarded, replaced with 180 or 160 µL of HBSS (for agonism and antagonism studies, respectively), and baseline was recorded for 20 min. Then, 20 µL of compounds, at the desired concentration, was gently added using a PlateMate™ 2 × 2 (Matrix, Thermo Fisher Scientific, Hudson, NH) and impedance recorded every 70 s until the end of the experiment. In experiments aimed at evaluating antagonism, antagonists (dissolved in 20 µL HBSS) were added first and cells incubated for 10 min, and then agonists (dissolved in 20 µL HBSS) were added. The final concentration of DMSO in the assay was kept at ≤0.1%.
In the experiments performed with pertussis toxin, hCB2-CHO cells were treated with 200 ng mL−1 pertussis toxin (Sigma, Milan, Italy) for 24 h and then processed as described above.
The results were expressed by the normalized cell index (NCI), which is the ratio of the cell index (CI) before and after the addition of the compounds.
cAMP assay
cAMP levels were measured using the Hit Hunter cAMP II Assay EFC Chemiluminescent Detection kit (Discoverx, Birmingham, UK). hCB2-transfected CHO cells were seeded in white 384-well plates, at a density of 15,000 cells/well (50 µL culture medium), 24 h before the experiment. On the day of the experiment, the medium was discarded, and 10 µL/well of 0.5 mM 3-isobutyl-1-methylxanthine (IBMX) in phosphate-buffered saline (PBS) and 2.5 µL of vehicle were added to each well for basal-level measurement. To record functional activity induced by receptor stimulation, 10 µL/well of 0.5 mM IBMX in PBS was added, followed by 2.5 µL of either agonist or antagonist/inverse agonist (6×) and 2.5 µL of forskolin (6×, 10 µM final concentration). Cells were incubated for 30 min at 37°C and 5% CO2, and then 80 µL/well of the Hit Hunter cAMP II Assay EFC Chemiluscent Detection solution (40 µL ED/Substrate Mix and 40 µL EA-Ab/Lysis Mix) was added. Cells were incubated overnight at room temperature in the dark. The luminescent signal was read with a Victor 3 plate reader (PerkinElmer, Monza, Italy) at 1 s/well. To perform ligand concentration-activity curves, serial dilutions of the test compounds were prepared from a 10-mM stock in DMSO.
Measurement of intracellular calcium transients
CHO-hmGluR1 were seeded into black clear-bottom 384-well plates at a density of 15,000 cells/well, in DMEM high glucose supplemented with 10% FBS, 100 µg mL−1 P/S, and 100 µg ml−1 Glutamax (Invitrogen). The complete medium was substituted 6 h after plating with a new one containing DMEM high glucose, 3 U mL−1 GPT (Sigma, St. Louis, MO), and 5 mM sodium pyruvate (Invitrogen). Following 24 h incubation, the cells were loaded with a fluorescent calcium dye (Molecular Devices, Sunnyvale, CA). The dye was dissolved in the assay buffer, which consisted of HBSS (Invitrogen) buffered with 20 mM HEPES solution (Sigma, Milan, Italy). To avoid dye bleaching, 2.5 mM probenecid (Sigma, Milan, Italy) was added to the calcium indicator solution. Cells were loaded with the dye (calcium 3) for 2 h at 37°C in a CO2 incubator. Intracellular calcium increases were measured using a fluorometric imaging plate reader (FLIPR 384; Molecular Devices, Sunnyvale, CA) upon agonist stimulation following 30-s baseline measurement or 10-min antagonist administration.
Data analysis
EC50 and IC50 values were calculated from nonlinear regression fit of concentration-activity curves using the program GraphPad Prism version 4 (GraphPad Software, San Diego, CA).
Results
Monitoring of cell adhesion and proliferation
Twenty-four-hour monitoring of cell impedance of CHO cells stably expressing either the hCB2 or hmGluR1 revealed a profile characteristic for each clone. In both cases, CI increased with time, but in CHO-hCB2 cells, it reached a plateau (CI = 3) at around 20 h after seeding, whereas in CHO-hmGluR1 cells, the plateau (CI = 2) was reached soon after media change, at about 8 h after seeding. It is noteworthy that 5 h after seeding CHO-hmGluR1 cells, complete growing medium was replaced with FBS free medium containing GTP and sodium pyruvate to prevent hmGluR1 desensitization. Media replacement causes a quick and transient peak in CI values followed by a decrease and stabilization of CI (data not shown).
CB2 cell impedance assay setup
It is known that DMSO affects cell membranes permeability, 8 and its administration to cell in culture had an important effect on impedance recording. Significant changes in the CI values were observed after DMSO administration. The highest DMSO concentration produced a dramatic effect on CI, but this effect was decreased at a lower concentration and disappeared at the lowest ones (data not shown). Considering the small effect of DMSO at 0.1% and the need to properly solubilize compounds, all further experiments have been performed keeping the DMSO concentration at ≤0.1%.
To assess if stimulation of CHO-hCB2 could be detected in the RT-CES system, cells were challenged with the selective CB2 agonist JWH133. Compound addition induced a fast concentration-dependent decrease of NCI that reached a peak and then started to recover with different profiles depending on agonist concentration (
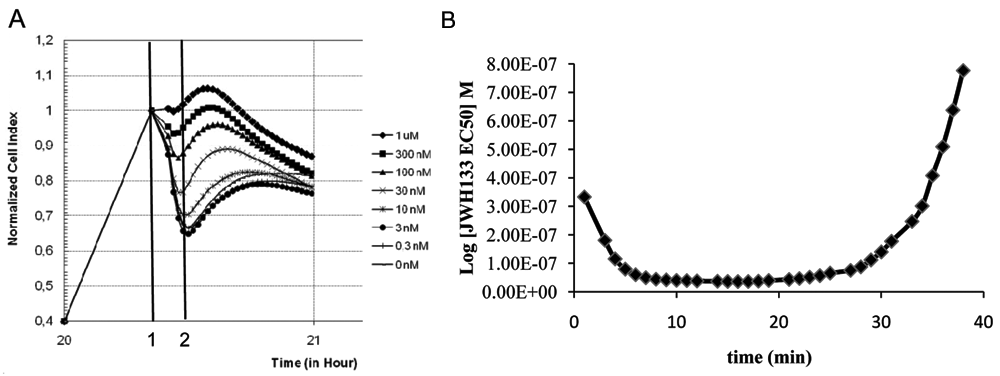
Modification of impedance in CHO-hCB2 cells following application of CB2 agonist. Application (vertical line 1) of increasing concentration of the CB2 agonist JWH133 (
To evaluate if the observed changes on NCI profiles reflected CB2 activation and were not due to an unspecific effect, the same experimental protocol was applied to nontransfected parental CHO cells. JWH133 addition to CHO cells resulted in no cellular impedance variation (
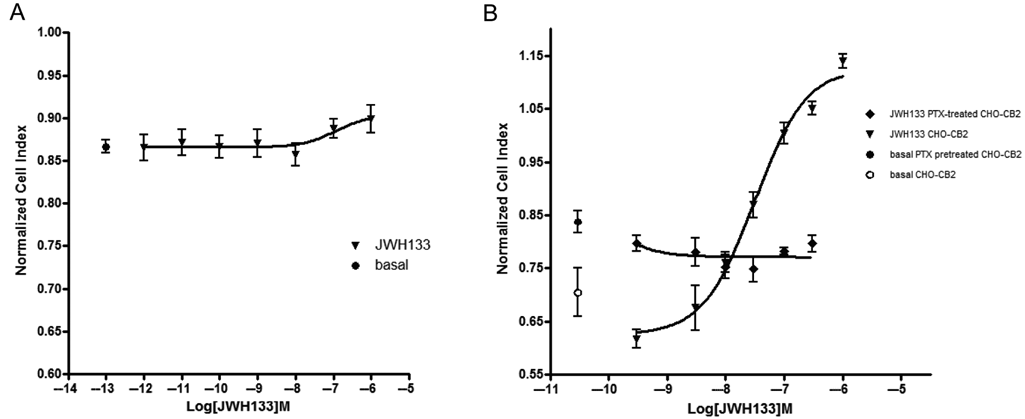
Variations of impedance are CB2-mediated and linked to Gi activation. Stimulation of non recombinant Chinese hamster ovary (CHO) cells with increasing concentration of JWH133 had no effect on impedance, reported as normalized cell index (NCI) that remains similar to basal (
To establish the involvement of Gi/o-protein in the modification of cell impedance triggered by JWH133, cells were treated with the selective Gi-protein inhibitor pertussis toxin (PTX). PTX pretreatment completely abolished the JWH133 effect on cell impedance, confirming that the observed effect is Gi/o mediated (
Comparison of CB2 ligand activity in cell impedance and cAMP assays
Three synthetic cannabinergic ligands have been studied and results obtained recording cell impedance and cAMP assay compared. The 3 ligands were a nonselective agonist (CP55940), a CB2-selective agonist (JWH133), and a CB2-selective antagonist/inverse agonist (AM630).
Results of concentration activity curves obtained with cAMP assay are expressed as percentage of forskolin-induced response (100%: maximal forskolin-induced response; 0%: basal cAMP level). The Emax is calculated as a percentage related to maximal CP55940 effect. In cell impedance experiments, Emax is referred to the cellular impedance measured after CP55940 addition at the maximal concentration in comparison with basal. As for cAMP assay, 100% corresponds to CP55940 maximal stimulation and 0% to basal.
CP55940 was more potent in inducing cellular impedance increases than in reducing intracellular cAMP level (EC50: 0.005 ± 0.3 nM and 2.1 ± 2.5 nM in RT-CES system and cAMP assay, respectively;
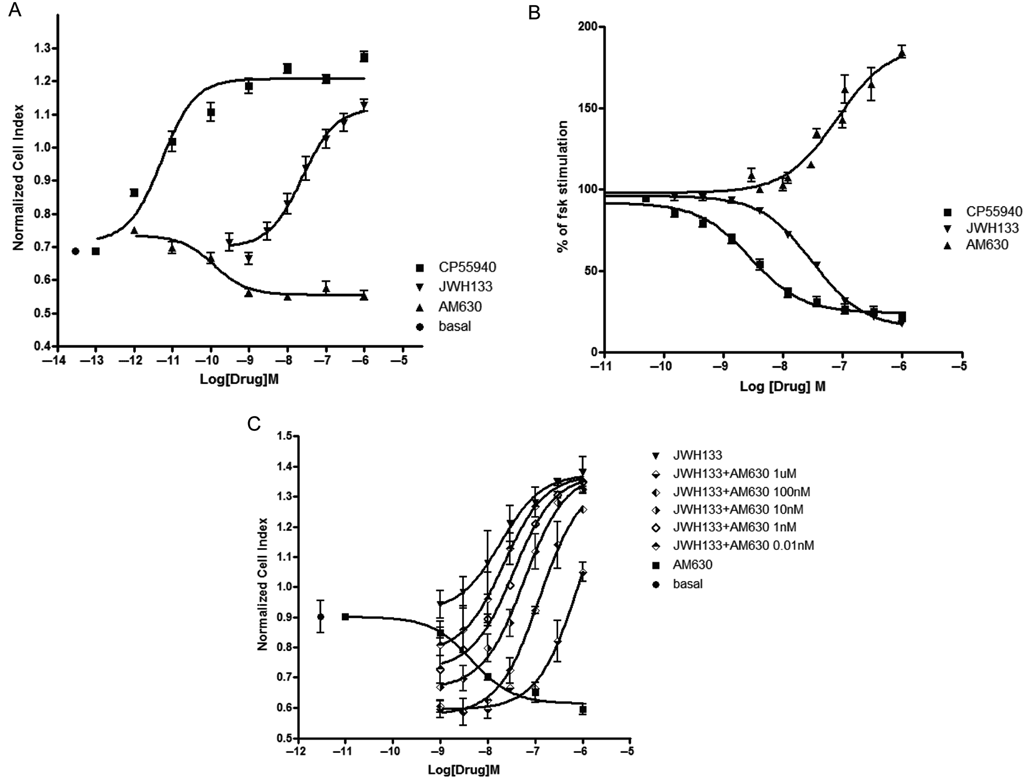
Pharmacological profiling of CB2 ligands on CHO-hCB2. The concentration activity curves obtained measuring cell impedance (reported as normalized cell index) after stimulation with a selective (JWH133) or a mixed CB1-CB2 (CP55940) agonist show that CP55940 is significantly more potent than JWH133 (
In the cAMP assay, JWH133 and CP55940 behaved as full agonists with similar Emax. On the other hand, in the cell impedance assay, JWH133 was less efficacious, showing an Emax of about 75% of that of CP55940.
AM630 behaved as an inverse agonist in both assays, decreasing cell impedance and increasing cAMP levels. In the cell impedance assay, AM630 produced a maximal effect of −22%, whereas the cAMP assay reached a maximal effect of −178%.
To further confirm that cellular impedance variations triggered by JWH133 were actually CB2-mediated, we used AM630 to antagonize the JWH133 effect. Application of AM630 (0.01 nM to 1 µM) induced a shift to the right of the concentration activity curve of JWH133 with a consistent modification of the EC50 (EC50 from 21-843 nM), confirming a CB2-mediated agonist effect (
Comparison of mGluR1 ligand activity in cell impedance and Ca2+ assays
Application of the mGluR1 agonist quisqualate to CHO-hmGluR1 resulted in an immediate, transient, and concentration-dependent increase in cellular impedance (

Modification of impedance in CHO-hmGluR1 and Chinese hamster ovary (CHO) cells following application of mGluR1 ligands. Application (vertical line 1) of increasing concentration of the mGluR1 agonist quisqualate induced a rapid, long-lasting concentration- and time-dependent increase of impedance, reported as the normalized cell index (NCI) (
Experiments conducted in the parental cell line using several mGluR agonists (quisqualate, trans-1S-3R-ACPD, S-3,5-DHPG, and glutamate) resulted in no effect. The only exception was a small increase of cell impedance under stimulation with the highest (100 µM) glutamate concentration (
Ligands activating mGluR1 trigger a PLC/InsP3/Ca2+ intracellular signal transduction cascade.
6
Therefore, activation of mGluR1 is commonly detected measuring intracellular calcium transient increases. To evaluate if a functional assay performed using cell impedance would have produced data consistent with a more classical assay, we evaluated mGluR1 ligands in parallel in the 2 assays (
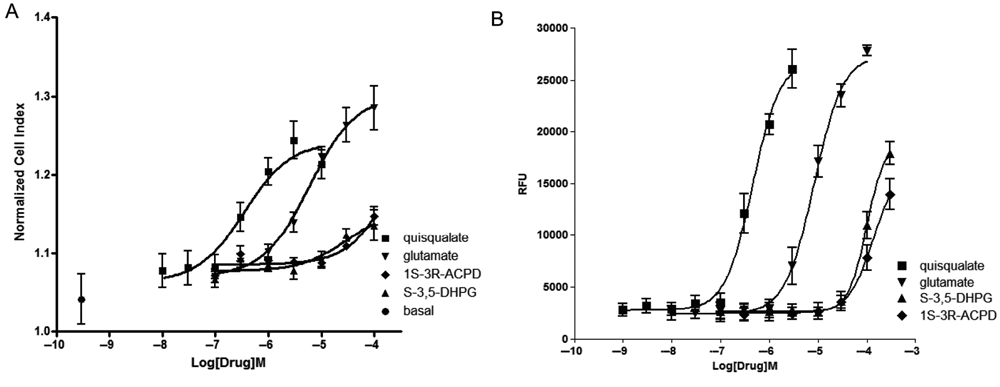
Comparison of mGluR1 agonists’ activity on impedance and calcium assays. Concentration activity curves were generated for 4 mGluR1 agonists (quisqualate, glutamate, 1S-3R-ACPD, and S-3,5-DHPG) using either impedance, reported as the normalized cell index (NCI) (
Potency of Glutamate Agonists on Impedance (RT-CES) and Ca2+ (FLIPR) Assays
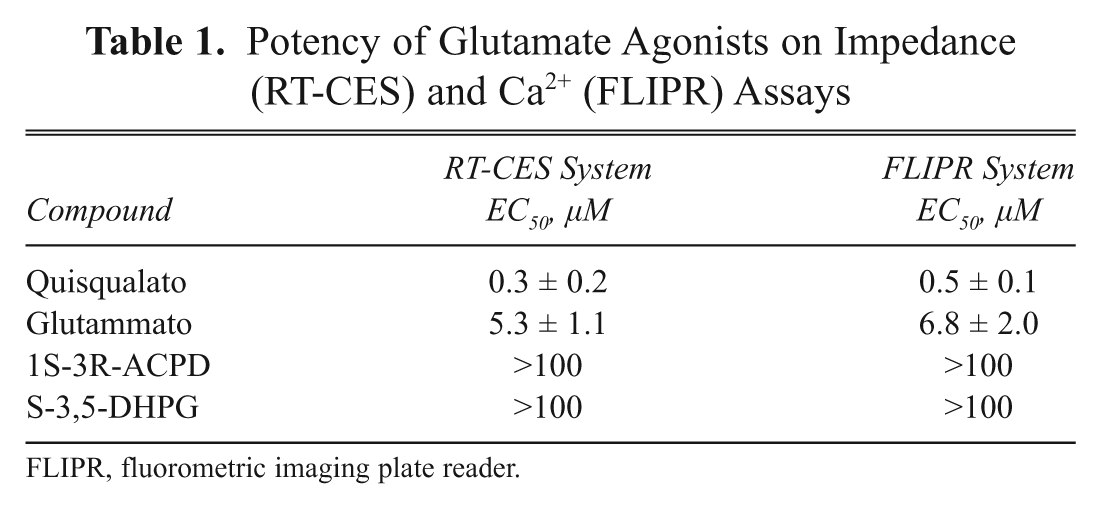
FLIPR, fluorometric imaging plate reader.
To evaluate antagonism, we pretreated cells for 10 min with the noncompetitive antagonists CPCCOEt, BAY36-7620, J&J16259685, YM-298198, and SCH1041222 and then challenged them with quisqualate at a concentration corresponding to its EC80. All antagonists, except for BAY36-7620, caused a concentration-dependent inhibition of quisqualate response both in the cell impedance and Ca2+ assay (
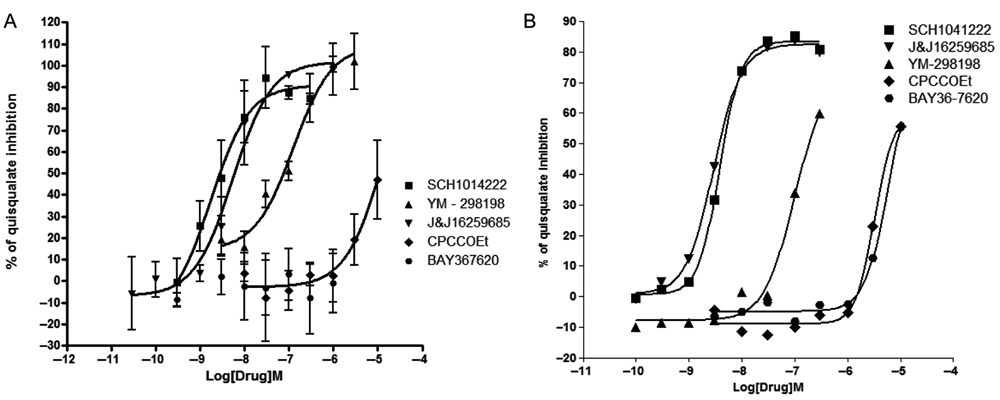
Comparison of antagonists’ activity on impedance and calcium assays. Concentration activity curves of several mGluR1 antagonists (SCH1041222, YM-298198, J&J16259685, CPCCOEt, and BAY36-7620) were generated, using variation of either impedance (
Potency of Glutamate Antagonists on Impedance (RT-CES) and Ca2+ (FLIPR) Assays
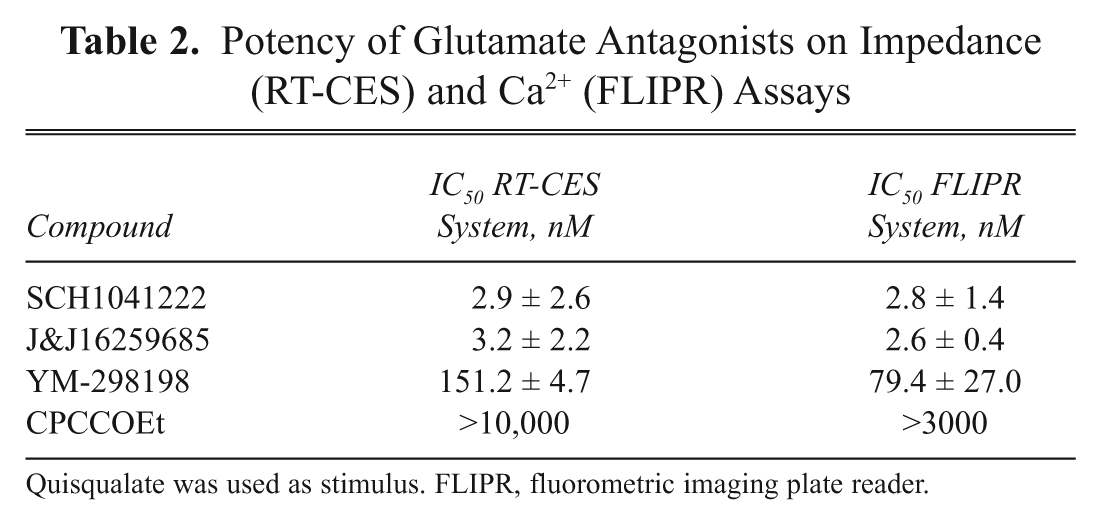
Quisqualate was used as stimulus. FLIPR, fluorometric imaging plate reader.
Discussion
Several kinds of in vitro assays have been developed to study compounds’ pharmacology. Activation of downstream signaling cascades, such as modulation of cAMP, Ca2+, and MAPK, or activation of reporter genes 11 has been widely employed for this purpose. All these techniques require the use of dyes, a pharmacological pretreatment, or a genetic manipulation of the cells expressing the receptor of interest. As a consequence of these interventions, readouts could be influenced, leading to generation of false-positive and false-negative results during screening, but even more important, also the pharmacology of the target could be modified. With the aim of circumventing or minimizing these problems, label-free technologies have been developed. These technologies are based on the use of biosensors 2 and do not require invasive external intervention.
In the present work, we tested one of these technologies, the RT-CES system, that is based on the measurement of changes in cell impedance. 12 This technology was previously successfully applied to the study of 3 receptors (H1, D1, and 5-HT1A) linked to different intracellular signaling pathways (Gq, Gs, and Gi). 4 Our aim was to broaden the available information on this technology by performing an analysis of the pharmacological profile of other 2 well-known GPCRs: CB2 and mGluR1.
As a first step, we studied the variation of cell impedance after cell seeding and up to pharmacological treatment initiation. This was possible because this technology monitors cell impedance variation over time. In both cell lines analyzed, we observed an initial increase of cell impedance related to cell adhesion, growth, and duplication. FBS removal from CHO-hmGluR1 cell medium induced an almost immediate CI stabilization, probably due to a reduced or blocked cellular growth. CB2-expressing cells, which remained in the same media for 24 h, showed a more prolonged increase of impedance, and CI stabilization was achieved only about 21 h postseeding. The possibility to precisely establish at which time cells reach a stable condition is an advantage offered by this technique. This feature could be exploited to optimize the timing of the experiment, therefore allowing a better assay standardization.
Considering that DMSO is the solvent most commonly used to solubilize compounds for in vitro assays, we measured variation of cell impedance at various DMSO concentrations. Concentrations normally tolerated in classical assays (1%-0.3%) induced a clear change in cell impedance. Hence, this technology is particularly sensitive to small perturbations of the cell environment. Complete DMSO elimination is not an option because it will create serious solubility problems. In our assay setting, a reasonable compromise to avoid problems with compound solubility without compromising assay reliability is to use DMSO concentration ≤0.1%. This concentration induces a small perturbation of impedance but allows an adequate compound solubilization. Nevertheless, this high sensitivity to DMSO may limit the testing of highly hydrophobic compounds that may require higher concentration of organic solvent to get into the solution.
Stimulation of recombinant cells with CB2 or mGluR1 ligands resulted in concentration-dependent impedance changes. The specificity of these impedance changes was confirmed by the absence of any detectable signals when the same compounds were tested in parental cell lines that do not express CB2 or mGluR1. Response to agonists showed profiles that were different for the 2 receptors. That agonistic response at different receptors could result in opposite changes in cell impedance has previously been reported. 4 Interestingly, it has been suggested that stimulation of cAMP production (e.g., with dopamine at the D1 receptor) leads to an increase in CI. 4 Following this hypothesis, it could be speculated that a reduction in cAMP would result in a CI decrease. On the other hand, it was reported that stimulation of receptors classically considered Gi/o-coupled (e.g. 5HT1A and D2) produces an increase of CI. 3,4 In agreement with this observation, in our study, stimulation of CB2 that led to an intracellular cAMP decrease resulted in an increase of cell impedance. PTX, a selective Gi/o inhibitor, completely blocked the effect of the CB2 agonist, confirming that CI increase was Gi/o mediated and thus linked to a cAMP second-messenger pathway. Dissimilarity in CI modulation by Gi/o-coupled receptors is probably linked to distinct cytoskeleton architecture and signal activation (e.g., activation of different intracellular signal transduction pathways, multiple coupling with different G-protein subtypes, etc.). Experiments using different recombinant cell lines (CHO and HEK) expressing MC4 elegantly showed that receptor coupling to G-protein could be influenced by cell intracellular environment. MC4 in HEK cells was Gs coupled, whereas in CHO, it was Gq coupled. 3 In addition, cell impedance assays could detect simultaneous coupling to multiple G-proteins. Using a pretreatment with PTX was possible to unveil a Gs component in the response of cannabinoid receptor 1 to agonist. 3 Thus, caution should be used when comparing profiles obtained for the same receptor expressed in different cell lines, and detailed studies on second-messenger pathways are necessary before reaching any conclusions.
An interesting aspect of using a cell impedance assay for evaluating a compound’s pharmacological profile is the possibility of measuring how a compound’s EC50 changes over time. From the analysis of concentration activity response, it was possible to show that EC50 is stable only during a certain time window. In a classical end point assay, this parameter cannot be checked, and usually assay is performed at a fixed time point after stimulation. If the chosen time point is out of the optimal time window, compound potency could be underestimated. Hence, the possibility of monitoring compound potency in real time is an interesting possibility offered by impedance-based technologies.
To further assess the reliability of the technology results obtained using agonists, antagonists and inverse agonists at CB2 or mGluR1 were compared to that obtained with classical functional assays: cAMP and Ca2+ assays. The overall pharmacological profile obtained with the different assays was in good agreement, and the rank order of potency of agonists and antagonists was respected. It was also possible to clearly identify inverse agonist activity of AM630 at CB2. These results confirm the suitability of the system to detect the activity of the different types of ligands (agonists, antagonists, and inverse agonists).
The only exception was the mGluR1 antagonist BAY36-7620. In the FLIPR assay, this compound showed an activity consistent with published Ca2+ assay data, whereas in the impedance assay, it was inactive. It could be tempting to speculate on a molecular pharmacology explanation of this result, for example, about the possibility that this compound is a protean agonist. Nevertheless, in the absence of experimental evidence in support of this hypothesis, a more parsimonious explanation is that the low DMSO concentration used in the cell impedance assay will affect compound solubility and consequently its activity.
More subtle differences in compounds’ pharmacology were observed also for the CB2 ligand. CP55940 was more potent in the cell impedance assay compared with the Ca2+ assay, and the maximal efficacy of JWH133 was slightly reduced in the RT-CES assay compared with the cAMP assay. The reason(s) for these discrepancies are not clear, but a possible explanation could come from the agonist-directed trafficking of response (ADTR) theory. 13 ADTR theory postulates that a ligand acting on a receptor can trigger a certain signaling pathway (e.g. cAMP) and not, or with less efficacy and potency, another one (e.g. ERK) triggered by other ligands at the same receptor. Thus, ligands could have on the same receptor different intrinsic activity at different second-messenger pathways. Evidence supporting this theory has been published for CB2. 14 It has been shown that CP55940 could activate not only the second-messenger pathway linked to cAMP reduction (i.e., the readout of the cAMP assay) but also additional second-messenger pathways linked to ERK phosphorylation and Ca2+ liberation from the intracellular store. 14 Combined activation of these different pathways may produce a synergistic effect on impedance changes, resulting in higher efficiency and potency. To further support this hypothesis, experiments aimed at evaluating the activity of JHW133 on the ERK phosphorylation and Ca2+ transient pathways, and comparison with the activity of CP55940 on these pathways, will be necessary.
To summarize, the present study confirms that it is possible to use cell impedance variations, as measured by the RT-CES, to study receptors pharmacologically linked to different signal transduction pathways. This represents a clear advantage compared with traditional systems because it does not require the development of an assay relying on different technologies to measure activity of receptors linked to different signal transduction pathways. Evaluation of second-messenger pathways represents another interesting aspect that could be studied by impedance measuring. Nevertheless, this may represent a challenging task, and further work is necessary to elucidate the real potential of impedance-based assays in this respect.
The use of impedance-based technology brings about the advantage of performing real-time monitoring of receptor response. This represents an opportunity to expand the knowledge about the evolution of pharmacological responses at the cellular level and allows a more broad pharmacological characterization of compounds.
In
Comparison of Cell Impedance, cAMP, and Ca2+ Assay Features
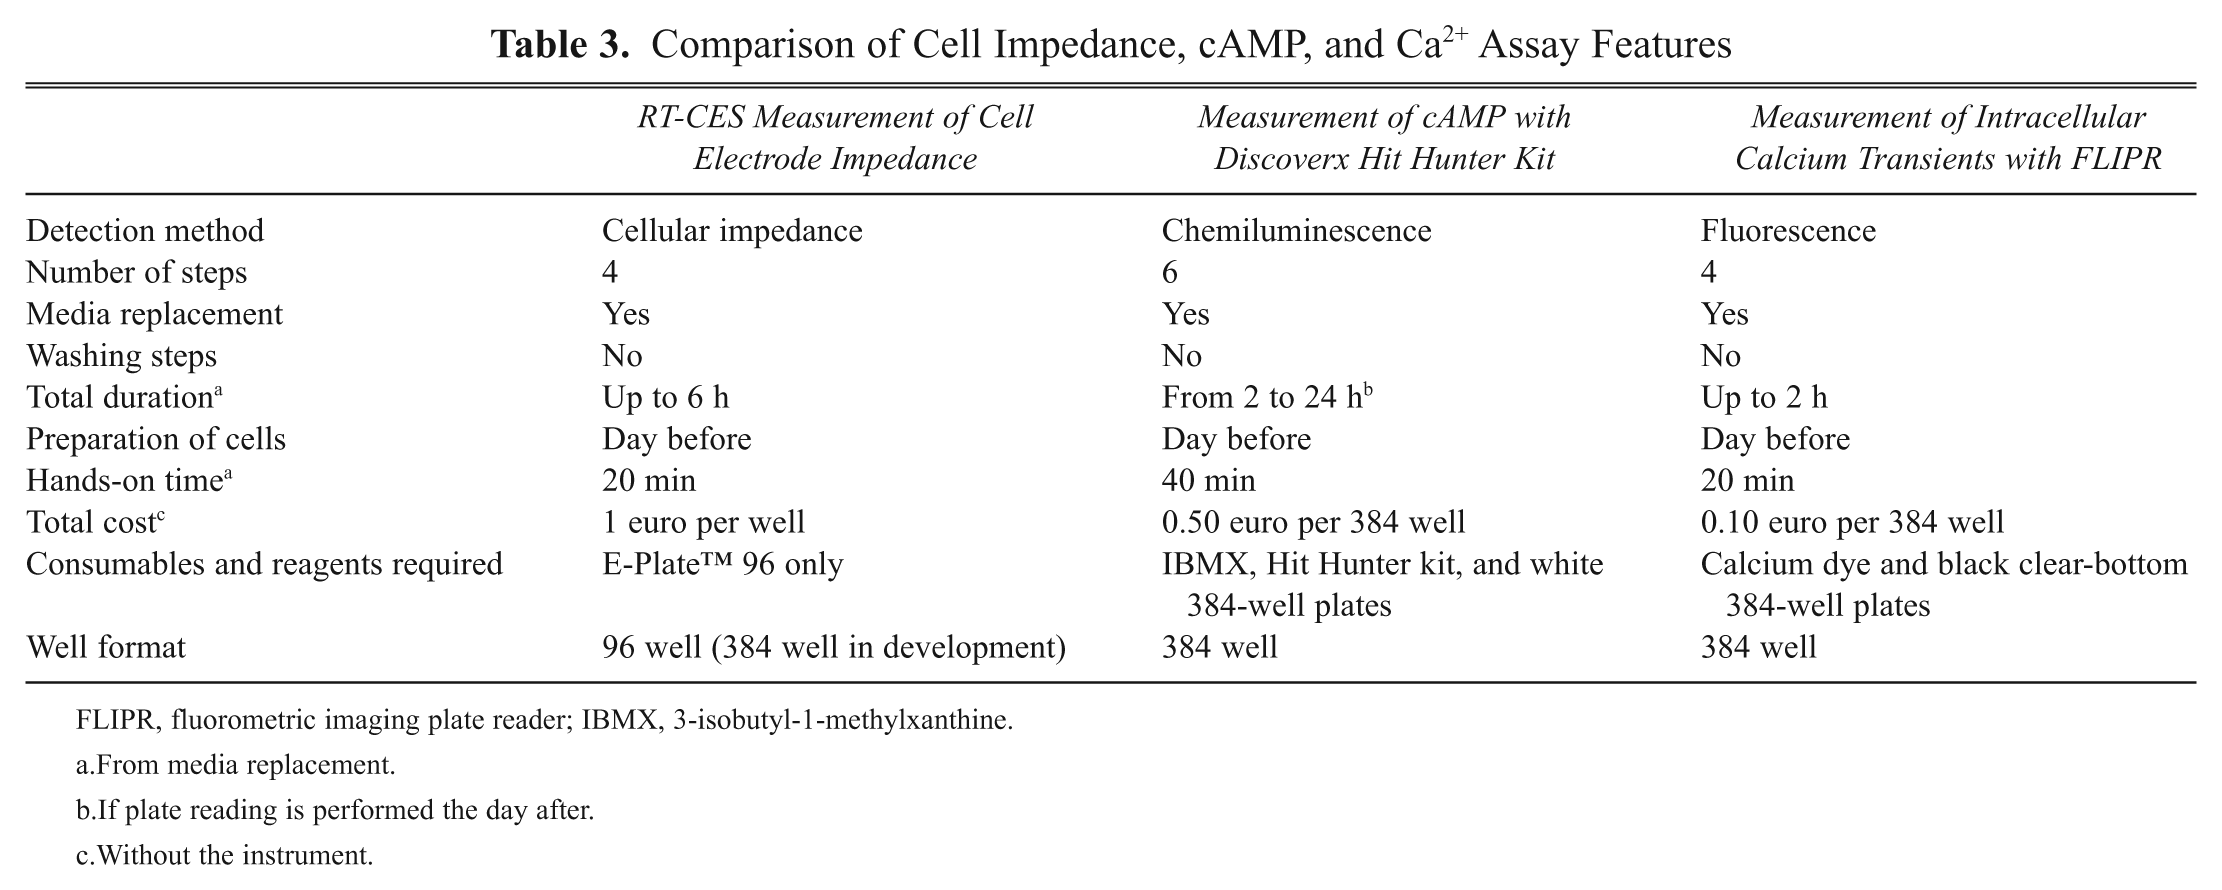
FLIPR, fluorometric imaging plate reader; IBMX, 3-isobutyl-1-methylxanthine.
From media replacement.
If plate reading is performed the day after.
Without the instrument.
Impedance-based technology could be successfully applied to the pharmacological characterization of specific compounds where it could convey interesting complementary information that could not be collected with classical end point assays.