
Abstract
The method described here employs a high-content cell-based assay format for the detection of neutralizing antibodies (NAbs) to panitumumab, a fully human monoclonal antagonistic antibody to the human epidermal growth factor (EGF) receptor in human serum (screening assay). A specificity assay was also developed and qualified to confirm that the neutralizing activity was attributable to the presence of NAbs and not due to serum interference (serum interference assay). The ArrayScan IV HCS reader was used for the measurement of tyrosine phosphorylation of the epidermal growth factor receptor (EGFR) and STAT-1 redistribution between the cytoplasm and nucleus in the human epidermoid carcinoma cell line A431. Assay conditions were developed by (1) optimizing the response of the A431 cells to recombinant human EGF in pooled human serum, (2) evaluating the ability of panitumumab to inhibit the EGF response, and (3) assessing the assay’s sensitivity for detecting a positive control affinity purified rabbit polyclonal anti-panitumumab antibody. Panitumumab dose-dependently inhibited 4 ng/mL EGF, and the positive control antibody showed a dose-dependent neutralization of 50 ng/mL panitumumab. The experiments indicated that in comparison to STAT-1 translocation, EGFR phosphorylation was the optimal endpoint for the screening and serum interference assays. Assay cut points were derived for the screening and serum interference assays by obtaining normalized ratios of mean fluorescence intensity values obtained with EGFR phosphorylation by testing sera from healthy human donor sera. The assay sensitivity was determined to be 0.125 µg/mL for the positive control antibody.
Keywords
Introduction
A
Strategies for immunogenicity testing have used a 2-tiered approach 3,4 where serum samples from study subjects are first screened for the presence of binding antibodies specific to the therapeutic protein in an immunoassay. Samples that are found to contain specific binding antibodies are frequently tested in a cell-based assay to determine if these antibodies have the ability to neutralize the biological activity of the therapeutic protein. 5
Depending on the biological effect exerted by a therapeutic, a wide choice of biochemical endpoints for cell-based assays for neutralizing antibody (NAb) detection is available, 6 but the uses of these assays for the analysis of samples of biological origin (serum, plasma, etc.) are prone to a wide range of technical difficulties such as nonspecific matrix effects, including cytotoxicity. 7 These effects can create ambiguous observations that are difficult to interpret and can lead to false-positive or false-negative results. High-content screening methods using fluorescent microscopy have gained wide use as bioassays for screening and identification of drug molecules with the desired biological activity. Here we have described the development of a method that used high-content analysis for its ability to detect neutralizing antibodies to panitumumab, a fully human monoclonal antibody to the human epidermal growth factor receptor (EGFR mAb) in human serum.
Epidermal growth factor (EGF) interacts with the EGF receptor (EGFR), a tyrosine kinase, and regulates cell growth, differentiation, and survival via interactions with the EGFR. 8 EGFR expression is upregulated in a large number of human solid tumor cancer cells, 9 and blocking EGF-EGFR interactions is being explored as a potential target for antitumor therapy. 10,11 Upon EGF binding to the EGFR, the receptor dimerizes and autophosphorylates intracellular tyrosine residues. 12 Following receptor activation by EGF, a series of signaling events occurs involving activation of the signal transducer and activator of transcription (STAT) family of transcription factors. 13 STAT proteins exist in an inactive form within the cytoplasm. Activation of various cell surface receptors results in STAT tyrosine phosphorylation, dimerization, and entrance into the nucleus to mediate the regulation of multiple genes. 14 The STATs were first identified as ligand-induced transcription factors in interferon (IFN)–treated cells where receptor activation results in activation of Janus kinases (JAKs) that mediate STAT phosphorylation. It has since been shown that STATs can also be phosphorylated by activated receptor tyrosine kinases (RTKs) such as EGFR and platelet-derived growth factor (PDGF). 14
The method described here employed a multiplexed, high-content cell-based assay to evaluate endpoints for the detection of neutralizing antibodies against panitumumab in human serum measuring EGFR phosphorylation and STAT-1 translocation in the EGFR-expressing human epidermoid carcinoma cell line A431. Development and qualification of the NAb assay using the ArrayScan IV platform was conducted using previously described approaches. 5,15 Because RTKs and tyrosine kinases in general are responsive to serum, this work was undertaken to establish the feasibility and specificity of an NAb assay system that employed EGF-EGFR signaling in a human serum-based matrix.
Materials and Methods
Cells and reagents
Recombinant human epidermal growth factor (rhEGF) was obtained as a lyophilized stock from R&D Systems (Minneapolis, MN). Anti-phosphorylated EGF receptor (Y1173) polyclonal antibody was obtained from R&D Systems, and murine monoclonal anti-phosphotyrosine clone 4G10 antibody was obtained from Millipore (Billerica, MA). Hoechst 33342 solution, fluorochrome conjugates of anti-mouse or anti-rabbit IgG-Alexa 488, and anti-rabbit IgG-Alexa 647 were obtained from Molecular Probes (Carlsbad, CA). Triton-X100 and 37% formaldehyde solutions were obtained from Sigma-Aldrich (St. Louis, MO). STAT-1, STAT-3, NFκB, and Hit Kits (containing antibodies to the targets and Alexa-conjugated secondary antibodies) were obtained from Cellomics (Thermoscientific, Pittsburgh, PA). Panitumumab and an affinity-purified rabbit polyclonal anti-panitumumab antibody preparation were obtained internally (Amgen, Inc., Thousand Oaks, CA). Pooled normal human serum (PNHS) and serum from normal individual human subjects were obtained from Bioreclamation (Hicksville, NY).
A431 cells were obtained from ATCC (Manassas, VA) and maintained in high-glucose Dulbecco’s modified Eagle’s medium (DMEM; Gibco-BRL, Carlsbad, CA) with 10% fetal bovine serum (Gibco-BRL) and 100 U/mL penicillin, 100 µg/mL streptomycin, and 0.292 mg/mL glutamine in 0.0085% saline and 0.10 mM citrate buffer (stock is 100×, Gibco-BRL) in a 37 ± 1°C incubator with 5% ± 1% CO2 and 90% ± 10% humidity. Cells were passaged every 3 to 4 days at 1 × 10⁵, 2 × 10⁵, or 4 × 10⁵ cells/mL in a 225-cm2 flask. Cell monolayer was washed twice with Dulbecco’s phosphate-buffered saline (DPBS, without magnesium or calcium chloride; Gibco-BRL) followed by the addition of 5 to 15 mL trypsin-EDTA (Gibco-BRL). Cells were incubated with trypsin-EDTA for up to 10 min at 37°C until detached. Growth medium was added at twice the trypsin volume, and cells were counted for an assay or passaged at 1 × 10⁵, 2 × 10⁵, or 4 × 10⁵ cells/mL in a 225-cm2 flask.
A431 cell preparation for imaging
A431 cells were plated overnight at 10,000 cells/well in 96-well black, clear-bottom Packard View plates (PerkinElmer, Waltham, MA). The medium was removed and rhEGF was added to the wells in DMEM (low glucose; Gibco-BRL) for 15 to 25 min at 37°C. Controls included negative control (N) that contained only A431 cells and ligand control (M) that contained cells and EGF. The medium was aspirated from the wells, and the cells were washed once with DPBS. Then, 100 µL of 3.7% formaldehyde warmed to 37°C was added to all wells for 10 min at ambient temperature (25 ± 2°C). The fixative solution was removed, and 100 µL of 0.01% Triton X-100 solution was added to each well and incubated for 1.5 min at ambient temperature (25 ± 2°C). The cells were washed 3 times with 200 µL DPBS. Anti-phosphotyrosine, anti-STAT-1, STAT-3, or NFκB antibodies were diluted to 1 µg/mL in DPBS containing 1% bovine serum albumin (BSA). Then, 100 µL of this solution was added to each well for an hour at ambient temperature (25 ± 2°C). The antibody solution was removed, and the cells were washed 3 times with 200 µL of 1× DPBS. Anti-mouse IgG-Alex 488 or anti-rabbit Alexa 647 and Hoechst were diluted to 1 µg/mL in DPBS with 1% BSA. Then, 100 µL of this solution was added to each well and incubated for an hour at ambient temperature (25 ± 2°C). This mixture was removed, and the cells were washed 3 times with 200 µL DPBS. Next, 200 µL of DPBS was added after the final wash, and the plates were sealed.
Imaging and analysis
Measurement of EGFR phosphorylation or transcription factor translocation from the cytoplasm to the nucleus was done using the ArrayScan IV HCS reader (Version 4.0.2 MR2, Thermo Scientific, Pittsburgh, PA). The target activation and cell health profiling bioapplication software was used to acquire images using appropriate filter sets in 4 separate fluorescent channels ( Fig. 1 ):
Channel 1: Hoechst (nuclear reference and object identification)
Channel 2: Nuclear transcription factor (rabbit polyclonal antitranscription factor detected with anti-rabbit IgG-Alexa 488)
Channel 3: Cytoplasmic transcription factor (rabbit polyclonal antitranscription factor detected with anti-rabbit IgG-Alexa 488)
Channel 4: Cytoplasmic/membrane tyrosine phosphorylation (murine monoclonal anti-phosphotyrosine detected with murine-anti-Ig-Alexa 647)
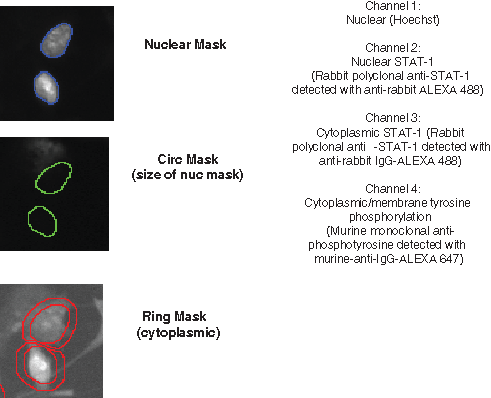
Principle of the cell health profiling bioapplication. The bioapplication was used to quantify epidermal growth factor receptor (EGFR) tyrosine phosphorylation and STAT-1 translocation from the cytoplasm to the nucleus. Cells were identified using a Hoechst 33342 DNA intercalating dye. Subsequent masks were set for measurements within the cytoplasm by expanding a ring around the nucleus by 4 pixel units. Measurements were taken within the mask rings in each of the Alexa 488 and Alexa 647 channels. Nuclear measurements were taken within the nuclear masks in the Alexa 488 channel. For STAT-1 translocation, the average mean fluorescent intensity (MFI) in the cytoplasm was subtracted from the average MFI in the nucleus, which is a measure of STAT-1 redistribution within the cell.
Imaging was done at a 20× objective and a 0.4 numerical aperture (0.4 NA) with exposure times of 0.1 s (Hoechst), 1 s (Alexa 488), and 1 s (Alexa 647). Images were collected at 1000 cells/well, and values are expressed as mean average fluorescent intensity (MFI).
Transcription factor detection was done using the Cellomics Hit Kits for indirect immunofluorescent detection of STAT-1, STAT-3, and NFκB and measured using the ArrayScan IV HCS Reader and the cytoplasm-to-nucleus translocation bioapplication software. The bioapplication measures cytoplasmic and nuclear levels of each transcription factor and calculates the difference between the average MFI. The magnitude of the activation (i.e., translocation) correlates with the extent of the observed differences between the 2 cellular compartments. A robust activation (i.e., translocation) of the transcription factor was indicated by a larger difference in intensity obtained from the cytoplasmic and nuclear compartments. This difference is expressed as mean cyto-nuc difference in this article.
Anti-panitumumab neutralizing antibody screening bioassay
A431 cells were plated overnight at 10,000 cells/well in 96-well black, clear-bottom Packard View plates. Serum from individual healthy donor sera or the positive control antibody in pooled normal human serum was diluted to 10% with low-glucose DMEM and incubated with 50 ng/mL panitumumab for 30 min at ambient temperature (25 ± 2°C). Medium was aspirated from wells containing plated A431 cells, and the serum/drug mixture was added to the wells and incubated for 30 min at 37°C. Recombinant human EGF (rhEGF) was added to the wells at 4 ng/mL and incubated for 15 to 25 min at 37°C. Controls prepared in PNHS at a final concentration of 10% serum were included on each plate. These controls included negative control (N) that contained only A431 cells; ligand control (M) that contained cells and 4 ng/mL EGF; drug control (D) containing cells, 4 ng/mL EGF, and 50 ng/mL panitumumab; and positive control (P) that, in addition to the constituents contained in control D, also included 12.5 ng/mL of a rabbit polyclonal anti-panitumumab antibody. The cells were fixed and stained for targets as described previously.
Anti-panitumumab neutralizing antibody specificity bioassay
A431 cells were plated overnight at 10,000 cells/well in 96-well black, clear-bottom Packard View plates. Serum from individual healthy donors was diluted to 10% with low-glucose DMEM and incubated for 30 min at ambient temperature (25 ± 2°C). Medium was aspirated from wells containing plated A431 cells, and the serum mixture was added to the wells and incubated for 45 to 55 min at 37°C. The cells were fixed and stained for targets as described previously in the section on A431 cell preparation for imaging. Controls N and M described earlier were included in these experiments.
Results
Epidermal growth factor–induced signaling
A431 cells were plated overnight and treated with rhEGF for 20 min. Cells were fixed and permeabilized, and EGFR intracellular tyrosine phosphorylation was detected using either a murine monoclonal anti-phospho EGFR (Y1173) or a murine monoclonal anti-phosphotyrosine antibody clone 4G10. Identification of the cells was done using the Hoechst stain ( Fig. 1 ). Intracellular EGFR phosphorylation was measured with a mask drawn 4 pixel units out to form the nuclear mask ( Fig. 1 ).
A dose-dependent increase in EGFR tyrosine phosphorylation was seen with increasing concentrations of rhEGF using both Y1173 and 4G10 antibodies ( Fig. 2A ). There were no qualitative differences between the 2 detection antibodies; however, the intensity of staining and average MFI was greater using the anti-phosphotyrosine antibody clone 4G10. In addition, there was a lower observed variability among the replicates. Thus, 4G10 was used for all further experiments. A time course study showed that maximum phosphorylation was detected after 20 min of induction with rhEGF (data not shown), and therefore this incubation time was used for all further experiments. Because the EGF-EGFR signaling mechanism works through an RTK-STAT-mediated pathway and effort to identify the appropriate target in A431 cells, STAT-1, STAT-3, and NFκB translocation from the cytoplasm to the nucleus was tested at different concentrations of rhEGF. Transcription factor translocation from the cytoplasm to the nucleus was measured and expressed as the mean cyto-nuc difference or average MFI ( Fig. 2B ).
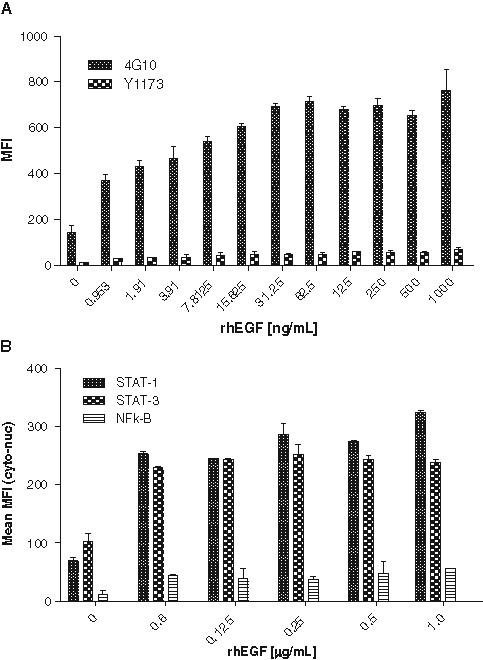
Epidermal growth factor (EGF)–induced phosphorylation of epidermal growth factor receptor (EGFR) and translocation of transcription factors. A431 cells were plated at 10,000 cells/well overnight followed by treatment with (
There was a measurable EGF-induced translocation response in the A431 cells observed with all the transcription factors, but the weakest response was observed with NFκB translocation. STAT-1 was used as an endpoint for all further experiments, and further optimization was undertaken to evaluate the dose response at lower rhEGF concentrations (data not shown) because the dose response at the higher concentrations was not significant ( Fig. 2B ). This is likely because the rhEGF concentrations chosen were at the upper plateau of the dose-response curve. A concentration of 4 ng/mL rhEGF was chosen for further assay qualification as this was the lowest concentration in 10% PNHS that gave a greater than 2-fold signal to background for both EGFR phosphorylation and STAT-1 translocation.
Human serum effects on A431 response to rhEGF
Because the objective of this work was to evaluate the reliability of the assay endpoints available within the EGF signaling cascade for supporting clinical sample analysis, the effect of human serum on the detection of STAT-1 translocation and EGFR phosphorylation was tested. The response of A431 cells to rhEGF was measured in the presence of 10%, 20%, and 40% PNHS. A dose-dependent increase in EGFR phosphorylation (
Fig. 3A
) and STAT-1 translocation (
Fig. 3B
) was observed in all PNHS concentrations. Although a dose-dependent response in EGFR phosphorylation and STAT-1 translocation was observed at all levels, 10% PNHS yielded the lowest background; higher serum concentrations showed higher background values, thereby diminishing the overall signal-to-background window (
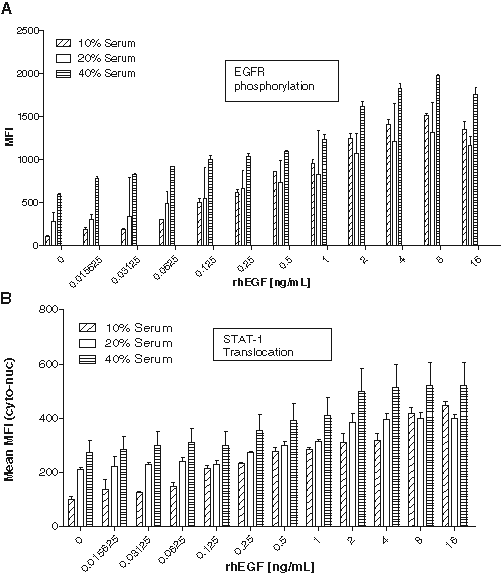
Effects of human serum on A431 responses to rhEGF. A431cells were plated overnight and treated with 16, 8, 4, 2, 1, 0.5, 0.25, 0.125, 0.0625, 0.03125, 0.015625, and 0 ng/mL rhEGF for 20 min in the presence of 10%, 20%, or 40% pooled normal human serum (PNHS). Cells were fixed and stained for (
Inhibition of EGFR phosphorylation and STAT-1 translocation by panitumumab
Optimization of the panitumumab concentration was done in PNHS by performing a titration in the presence of 4 ng/mL rhEGF in 10% PNHS. Panitumumab blocked both EGFR phosphorylation ( Fig. 4A ) and STAT-1 translocation ( Fig. 4B ) in a dose-dependent manner, with maximum inhibition (~4-fold) being observed at 200 ng/mL panitumumab. A concentration of 50 ng/mL panitumumab was selected as the fixed concentration of drug to use for the detection of any antidrug neutralizing antibodies that may have been present in any clinical samples because this concentration lay around the linear portion of the panitumumab curve.
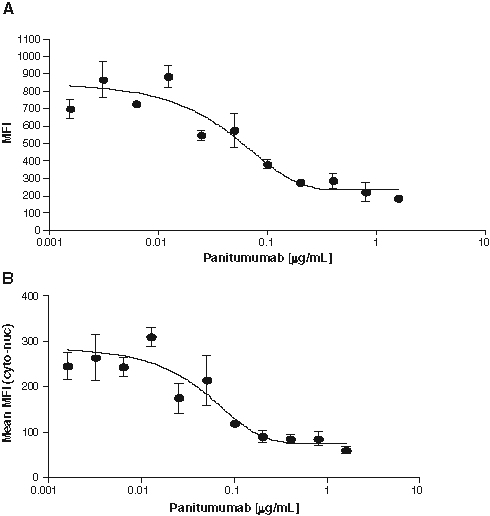
Panitumumab inhibition of rhEGF-induced tyrosine phosphorylation and STAT-1 translocation. A431 cells were plated and pretreated with 1.6, 0.8, 0.4, 0.2, 0.1, 0.05, 0.025, 0.0125, 0.00625, 0.003125, 0.0015625, and 0 µg/mL panitumumab in 10% pooled normal human serum for 30 min, followed by the addition of 4 ng/mL rhEGF and incubation at 37°C for 30 min. Cells were fixed and stained for (
Anti-panitumumab positive control neutralizing antibody
A dose-dependent neutralization of panitumumab activity by the positive control antibody is shown in
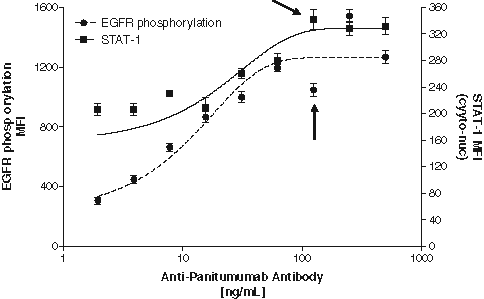
Neutralization of panitumumab by an affinity-purified rabbit polyclonal anti-panitumumab positive control antibody. The positive control antibody was added in at 500, 250, 125, 62.5, 31.25, 15.625, 7.8125, 3.906, 1.95, and 0 ng/mL to pooled normal human serum. Panitumumab was added at a final concentration of 50 ng/mL and allowed to incubate with the antibody containing serum for 30 min. This mixture was added to plated cells and incubated for 30 min. rhEGF was added, followed by 20-min incubation. Cells were fixed and stained for receptor tyrosine phosphorylation and STAT-1 translocation from the cytoplasm to the nucleus. Results are expressed as the average mean fluorescence intensity (MFI) values from 1000 cells/well in triplicate wells, and error is expressed as standard deviation. Antibody concentrations are expressed in undiluted pooled normal human serum. Arrows indicate the assay sensitivity at 0.125 µg/mL antibody.
Screening assay cut point
To determine the screening assay cut point, we tested serum samples from 28 individual healthy donors in the screening assay as described earlier. The level of EGFR phosphorylation was measured as described for each subject and control ( Fig. 6A ). The mean MFI from each subject was divided by the mean MFI from the drug control to give a ratio termed the screening assay value.
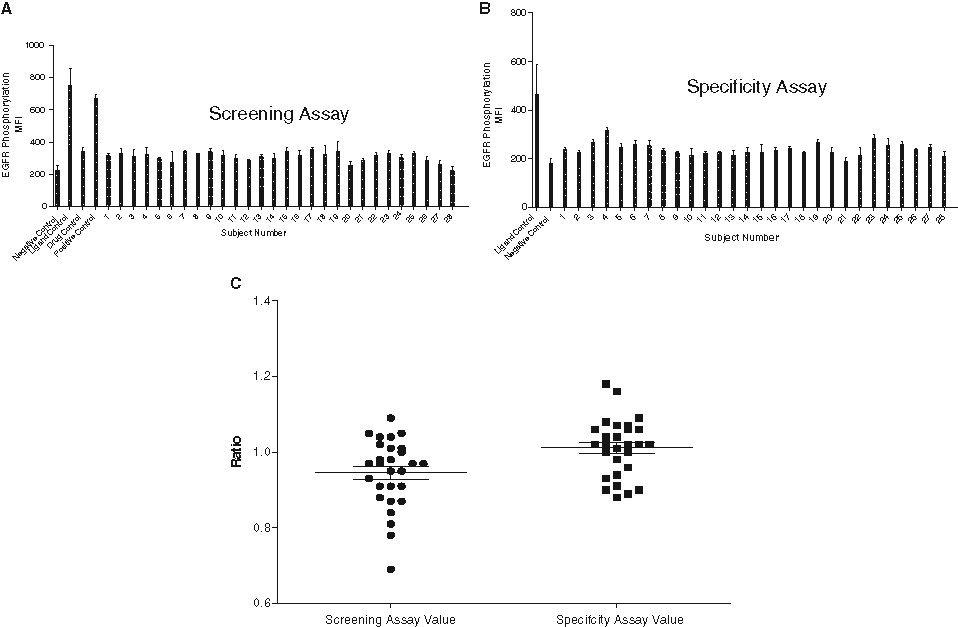
Effect of serum from 28 individual normal human subjects on the (
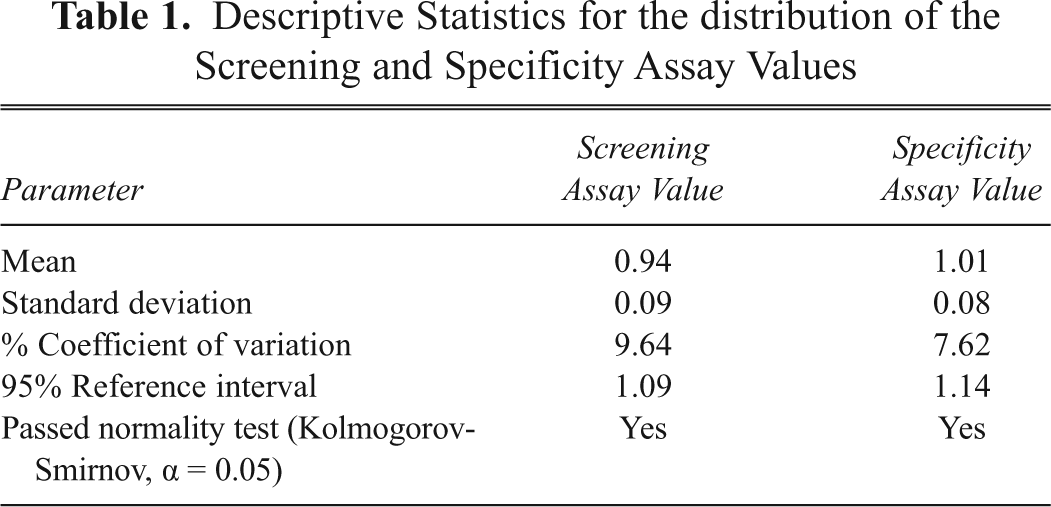
The resulting normalized screening assay values were used to determine the variability of the assay as well as to estimate the assay cut point. The distribution of the screening assay values ( Fig. 6C ) was normal based on the Kolmogorov-Smirnov test ( Table 1 ). The mean screening assay value was 0.94 with percent coefficient of variation (CV) between donors less than 10% ( Table 1 ). The upper 95% reference interval (i.e., assay cut point) was estimated to be 1.09 for the screening assay ( Table 1 ). Consequently, a sample with a screening assay value above that point would be considered to have neutralizing activity to panitumumab.
Descriptive Statistics for the distribution of the Screening and Specificity Assay Values
Specificity assay cut point
The specificity assay was conducted by incubating the serum samples from individual subjects with plated A431 cells alone. The results from this test determined if the positive neutralizing antibody result (i.e., high EGFR stimulation) was due to nonspecific factors in the serum itself. Serum samples from 28 normal individual subjects were tested without addition of rhEGF or panitumumab. The level of EGFR phosphorylation was measured for each subject and control ( Fig. 6B ). The subject results were divided by the negative control, resulting in a ratio termed the specificity assay value.
Similar to the observations made with the screening assay, there was little variation between the subjects, and the results obtained from the individuals were similar to the negative control in pooled serum. The distribution of the screening assay values ( Fig. 6C ) was normal based on the Kolmogorov-Smirnov test ( Table 1 ), and the mean specificity assay value for the 28 subjects was 1.01, with %CV between donors less than 10% ( Table 1 ). The upper 95% reference interval (i.e., assay cut point) was estimated to be 1.14 for the specificity assay ( Table 1 ). This indicated that a sample with a specificity assay value above that point would be considered to have endogenous factors that induce EGFR phosphorylation. Thus, any sample showing neutralizing activity in the screening assay but having a specificity assay value greater than 1.14 would be called nonspecific and negative for the presence of neutralizing antibodies to panitumumab.
Assay qualification
To qualify the assay for its intended use, serum from 5 individual normal human subjects was tested, spiked at the estimated limit of detection of the assay, 0.125 µg/mL rabbit panitumumab antibody, and unspiked in the screening assay, as described in Materials and Methods, measuring EGFR phosphorylation as the endpoint.
The MFI of EGFR phosphorylation was measured and the screening assay values were calculated as described earlier. All unspiked samples had screening assay values below the estimated assay cut point of 1.09 (negative), and all antibody-spiked samples fell above the assay cut point of 1.09 (positive) ( Fig. 7 ).
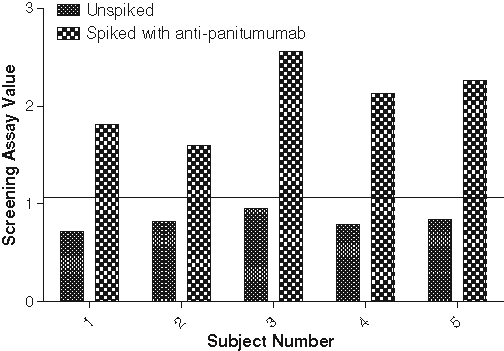
Serum samples from 5 individual normal human subjects were tested unspiked and spiked with 0.125 g/mL anti-panitumumab antibody in the screening assay along with assay controls in pooled normal human serum (PNHS). The mean fluorescence intensity (MFI) for epidermal growth factor receptor (EGFR) phosphorylation for the samples and controls was detected and the screening assay values calculated. The estimated assay cut point of 1.09 was applied to the sample data (solid line). All unspiked samples fell below the cut point (negative), and all antibody-spiked samples fell above the assay cut point (positive).
Discussion
We have demonstrated the feasibility of a cell-based NAb assay format that may be conducted in a human serum matrix that relies on changes in phosphotyrosine levels of EGFR and STAT-1 in EGF-mediated signaling. Serum is known to have a profound effect on the activity of tyrosine kinases, and in an NAb assay system, it constitutes the assay matrix in which test samples are analyzed for the presence of antidrug neutralizing antibodies. The evaluation of the results from EGFR phosphorylation and STAT-1 translocation during assay development provided streamlined evaluation in the determination of the final assay format.
Although EGFR phosphorylation and STAT-1 activation can be measured using different methods (e.g., enzyme-linked immunosorbent assay), the use of an automated fluorescent microscopy system such as the ArrayScan IV allowed for the rapid (less than 10 min/96-well plate) measurement of multiple targets and events within intact, individual cells. The implementation of a high-content platform such as the one described here not only was effective for the quality of endpoint measurement but also provided a mechanism for the assessment of the health of the cells in the assay. The size, shape, and staining intensity of the nucleus (Hoechst 33342) were measured simultaneously with the other primary assay endpoints. Ultimately, this enabled the selection of a high-quality endpoint with optimized conditions.
During assay development, the optimization of the ArrayScan IV settings was essential for enhancing the signal as well as for reducing the intra- and interday variability (data not shown). Measurement parameters on the ArrayScan IV instrument using the Cell Health Profiling algorithm, such as target fluorescent channel exposure times, size and shape of cytoplasmic and nuclear masks, and object identification parameters, were optimized prior to the commencement of assay validation ( Fig. 1 ). Once optimized, the protocol was locked and used for the remainder of the experiments to reduce subjectivity that is inherent in image-based analysis.
Cell density in the wells was an important consideration during optimization of the image analysis portion of the assay, and the final cell number (1000 cells/well) was determined to be optimum for obtaining a robust signal as well as for allowing appropriate quantitation using the Cell Health Profiling bioapplication. At higher cell densities, the software was unable to distinguish single cells from clusters. Although there are mechanisms built into the software to allow an adjustment for resolution of single cells from areas of cells in close contact with each other, excessive crowding made it impossible to resolve this issue.
As the quantitation of the fluorescent images by the bioapplication was optimized, the reagents used for target detection were also studied. Figure 2 shows a comparison of the 2 antibodies used to detect phosphorylation of the EGF receptor. The use of the murine monoclonal anti-phospho-EGFR antibody 4G10 resulted in higher fluorescent counts than the anti-phospho-EGFR (Y1173) antibody and also demonstrated improved precision in the measurements, thereby allowing the selection of this antibody for subsequent experiments.
Assay development was conducted to optimize the response of the A431 cells to rhEGF in human serum prior to beginning validation. The length of the incubation time selected to stimulate the cells with rhEGF played an important role in the assessment of the appropriate signal window to measure receptor phosphorylation as well as transcription factor activation (data not shown). It is well known that EGF-EGFR signaling events involve the activation of the STAT family of transcription factors. 13 It has also been suggested that in certain cell types, EGF can induce activation of NFκB. 16 In contrast to STAT-1 and STAT-3 translocation responses, the EGF-induced NFκB translocation response was remarkably weak. Because EGF-induced STAT-1 activation was most pronounced, it was chosen as the transcription factor endpoint for further evaluation for this assay.
Because the NAb assay was intended to be performed in a human serum–based matrix, it was important to consider the effects of human serum on the assay. The response of A431 cells to rhEGF was assessed in different concentrations of pooled normal human serum ( Fig. 3 ). Serum concentrations of 20% and 40% significantly increased background responses in A431 cells for both tyrosine phosphorylation ( Fig. 3A ) and STAT-1 translocation ( Fig. 3B ). The data also suggested an increase in variability (triplicate %CV) at higher concentrations of serum. A serum concentration of 10% was ultimately chosen to decrease variability and maximize signal response. All experiments were conducted with a single preparation of pooled normal serum.
The determination of an assay cut point is an important component of assay validation for immunogenicity assays.
17
The assay cut point was derived by assessing the baseline response in individual human subjects in the presence of panitumumab and rhEGF. The response from the human subjects was assessed using the STAT-1 and EGFR phosphorylation endpoints from 50 donors in both the screening and specificity assays (results from 28 are shown in
In conclusion, the multiplexed evaluation of assay endpoints for NAb detection for panitumumab using the ArrayScan IV platform provided efficient selection and assurance that the RTK endpoint for the EGF-EGFR signaling pathway could yield a reliable assay for routine use for monitoring the immunogenicity of panitumumab during clinical development.