
Abstract
Background
Prognostic nutritional index (PNI) has recently been identified as a novel marker of nutritional status. However, existing evidences on the association between PNI and the risk of lower extremity deep venous thrombosis (LEDVT) are limited and conflicting.
Objective
To determine the association between PNI and the risk of LEDVT, and further evaluate its diagnostic value.
Methods
Over a 10-year period (2012–2022), a total of 12790 patients who underwent compression ultrasonography examinations were consecutively included, and 1519 (11.9%) LEDVT events occurred. Multivariate logistic regression analysis was used to investigate the association, and receiver operating characteristic (ROC) curve was constructed to evaluate its diagnostic performance.
Results
After full adjustment, patients in third quartile (odds ratio [OR] = 1.486, 95% confidence interval [CI]: 1.205–1.832), second quartile (OR = 2.436, 95% CI: 1.993–2.978) and first quartile (OR = 3.422, 95% CI: 2.791–4.195) of PNI were at higher risk of LEDVT compared with those in fourth quartile, and the test for trend was significant. Consistently, each unit decrease in PNI was associated with a 6.0 % (95% CI: 1.052–1.069) increased risk of LEDVT. Moreover, adding PNI to a base model improved the area under the curve (AUC) from 0.721 (95% CI: 0.709–0.734) to 0.746 (95% CI: 0.734–0.758).
Conclusion
PNI is inversely associated with the risk of LEDVT, and provides significant incremental diagnostic value for the identification of LEDVT events. These findings suggest that PNI may be a potential biomarker to help clinicians identify patients at risk of thrombosis and make clinical decisions timely.
Keywords
Introduction
Venous thromboembolism (VTE), consisting of deep venous thrombosis (DVT) and pulmonary embolism (PE), is the third most common cardiovascular disease worldwide with substantial morbidity and mortality.1,2 Since VTE events are often preventable, early diagnosis and timely treatment are crucial for ensuring satisfactory patient outcomes.3–5 Unfortunately, the clinical manifestations of VTE are typically insidious and nonspecific, potentially leading to misdiagnosis and incorrect treatment.6,7 In view of this, identification of new biomarker for the diagnosis of VTE is urgently need in clinical practice.7,8
Recently, there seems to be a potential link between nutrition and thrombosis.9,10 As an objective nutritional marker, low serum albumin was closely associated with increased thrombotic events.11–13 This inverse association was confirmed by a recent meta-analysis. 14 In addition, another meta-analysis included 4035 VTE cases and 66679 controls from 25 studies, and concluded that lymphocyte count was significantly lower in patients with VTE than healthy subjects. 15 Based on serum albumin concentration and lymphocyte count, prognostic nutritional index (PNI) is easily calculated and widely used as a novel marker of nutritional status in various diseases, such as cancers (eg, gastric cancer), 16 cardiovascular diseases (eg, acute coronary syndrome), 17 urological diseases (eg, chronic kidney disease), 18 and even in the general population. 19 As mentioned above,11–15 low levels of albumin and lymphocyte in patients with VTE can eventually lead to a lower PNI, therefore, we hypothesized that PNI may serve as a potential diagnostic biomarker for venous thrombosis.
To our knowledge, existing research focusing on the relationship between PNI and the risk of thrombosis is limited.20–25 As shown in detail in Supplementary Table 1, these studies were generally limited by small sample sizes (ranging from 100 to 1326 participants), and inconsistent findings (4 studies: favor, 2 studies: against). Therefore, the first aim of this study was to determine the association between PNI and the risk of lower extremity DVT (LEDVT) in a large sample over a 10-year period (2012–2022). To date, little is known about the diagnostic ability of PNI in thrombosis, thereby potentially limiting its clinical application. Accordingly, the second aim of this study was to explore whether PNI combined with other factors could improve the diagnostic ability for LEDVT.
Methods
Ethics Approval
This retrospective observational study was approved by the Institutional Review Board of People's Hospital of Deyang City (Ethical Review No. 2021-04-019-K01). The requirement for informed consent was waived owing to the retrospective design and anonymous data analysis. The study was conducted in accordance with the principles of the Declaration of Helsinki.
Study Population
The study population have been described in detail in our previous studies.26–28 Among the 671456 admissions of patients who were hospitalized from January 2012 to July 2022, 20730 consecutive patients undergoing lower extremity compression ultrasonography (CUS) examinations were screened from our hospital information system (HIS) database. Of these eligible patients, (1) individuals with missing data on albumin or lymphocyte, (2) individuals receiving CUS examination earlier than routine blood test, (3) individuals with an admission diagnosis of DVT or PE, (4) individuals with chronic DVT, upper extremity DVT, superficial venous thrombosis, or arterial thrombosis, (5) individuals with incomplete medical records, (6) individuals younger than 18 years were excluded. Finally, a total of 12790 patients were included in this study (Supplementary Figure 1).
Data Collection
Data were extracted from the electronic medical records, including patient demographics (age, sex, body mass index [BMI], smoking status), and comorbidities (hypertension, diabetes mellitus, chronic obstructive pulmonary disease [COPD], atrial fibrillation, heart failure, stroke, hepatic insufficiency, renal insufficiency, and cancer). Obesity was defined as BMI ≥ 28 kg/m2 according to the Guidelines for Prevention and Control of Overweight and Obesity in Chinese Adults. 29 Smoking status was categorized as never, former or current smoking. The presence of comorbidities was determined by the discharge diagnoses, and patients were then classified into those with or without comorbidity. Moreover, laboratory findings closely related to venous thrombosis were also extracted,30–32 including white blood cell (WBC, reference range: 3.5–9.5 × 10⁹/L), red blood cell (RBC, reference range for men: 4.3–5.8 × 10⁹/L, for women: 3.8–5.1 × 10⁹/L), and platelet (reference range for men: 85.0–303.0 × 10⁹/L, for women: 101.0–320.0 × 10⁹/L).
Definition of PNI
At our institute, all blood samples were collected within 24 h after admission, and analyzed by the clinical laboratory, which has achieved ISO15189 certification by the China National Accreditation Service for Conformity Assessment (CNAS, Registration No. CNAS MT0754). Briefly, serum albumin levels were measured using automatic biochemical analyzers (ADVIA2400, Siemens, Germany; reference range: 35.0–55.0 g/L), and lymphocyte counts were measured using automatic hematology analyzers (Sysmex XN2000, Kobe, Japan; reference range: 1.1–3.2 × 10⁹/L). Based on the first laboratory data after admission, PNI was calculated using the following formula: PNI = serum albumin (g/L) + 5 × lymphocyte (109/L). 19 In this study, patients were divided into four groups by PNI quartiles: first quartile (Q1, ≤ 41.3, n = 3210), second quartile (Q2, 41.4–47.0, n = 3190), third quartile (Q3, 47.1–51.9, n = 3210), and fourth quartile (Q4, ≥ 52.0, n = 3180). Due to the overlap of some patients’ PNI values with the quartile cut-off points, this led to an uneven distribution of patient cases across the groups.
Study Outcomes
As we described previously, 33 lower extremity CUS examinations were performed by an experienced ultrasound physician using a color-coded ultrasound system (iU 22, Philips Healthcare, Netherlands) equipped with a 3–9 MHz linear-array transducer. Routinely, the following deep veins were scanned: iliac vein, common femoral vein, superficial femoral vein, deep femoral vein, popliteal vein, anterior tibial vein, posterior tibial vein, fibular vein and calf muscle vein. The criteria for the diagnosis of LEDVT are as follows: (1) noncompressible vein, (2) hypoechoic regions in the lumen, (3) no or only a small amount of blood flow signal. 34 All imaging and ultrasound reports were verified by another senior sonographer for quality assurance purpose. In this study, the primary outcome was the association between PNI and all LEDVT events during hospital stay. Depending on the thrombus location, proximal LEDVT was defined as thrombus occurring in the popliteal vein or above, whereas below the popliteal vein as distal LEDVT. Patients with both proximal and distal thrombosis were classified as proximal since LEDVT is thought to progress from a distal to proximal location. 35 Due to the substantial differences (eg, demographics, comorbidities, risk factors, clinical management, mortality) between proximal and distal LEDVT,36–38 the secondary outcomes were the association between PNI and either distal or proximal LEDVT.
Sample Size Calculation
According to the sample size calculation formula
Statistical Analysis
Before analysis, all data were checked for missing values, and 27.1% of obesity (n = 3464), and 4.2% of smoking (n = 538) were missing. The missing indicator method was used to handle these missing data. 40 Subsequently, continuous variables are described as median (Q1, Q3) according to results of Shapiro-Wilk normality test, whereas categorical variables are reported as numbers (percentages). Differences among PNI quartile groups were compared using the Wilcoxon rank-sum test or Pearson's chi-squared test. Violin plots were constructed to visualize the distributions of albumin, lymphocyte and PNI between patients with and without LEDVT, and the statistical significance was evaluated using Dunn's multiple comparisons test.
Univariate logistic regression analyses were performed to identify potential factors associated with LEDVT (Supplementary Table 2), and factors with a P value < 0.05 in univariate analyses were entered into multivariate analyses. Odds ratios (OR) and 95% confidence intervals (CI) were calculated to estimate the risk of LEDVT. To avoid assumptions of linearity, continuous variables (age, WBC, RBC, platelet) were categorized using the optimal cut-off value determined by the receiver operating characteristic (ROC) curves (Supplementary Table 3, Supplementary Figure 2). After that, three multivariate logistic regression models were built to assess the association between PNI and the risk of LEDVT. Model 1 was adjusted for patient demographics (age, sex, obesity, smoking), model 2 was further adjusted for comorbidities (diabetes mellitus, COPD, atrial fibrillation, heart failure, stroke, hepatic insufficiency, renal insufficiency, cancer), and model 3 was further adjusted for laboratory findings (WBC, RBC, platelet). In these multivariate analyses, PNI was analyzed both as a continuous variable (per unit decrease) and a categorical variable (with Q4 as the reference category). To calculate P value for trend, the median value of PNI in each quartile category was assigned (Q1: 37.0, Q2: 44.5, Q3: 49.4, Q4: 54.8), and modeled as a continuous variable. Meanwhile, variance inflation factors (VIF) were calculated to check multicollinearity, 41 and no significant multicollinearity was found for variables included in these models (Supplementary Table 4). In addition, we constructed restricted cubic spline (RCS) plots to visually examine the dose-response relationship between PNI and the risk of LEDVT. The lowest Akaike information criteria (AIC) value was used to determine the number of knots, using a range of 3 to 7 knots (Supplementary Table 5).
Moreover, we explored the association in subgroups stratified by age (< 71.0 and ≥ 71.0 years), sex (men and women), obesity (yes, no and missing), smoking status (never, former, current smoking and missing). Potential interactions between the stratification factors and PNI were tested. We also performed sensitivity analysis, excluding patients with missing values, to evaluate the potential impact of missing data on the observed association. 42 Lastly, area under the curve (AUC) of ROC curve was compared to estimate the improvement in diagnostic performance after adding PNI to a base model including all significant variables from univariate analyses (model 3).
All reported P values are two-sided, and P < 0.05 was considered statistically significant. Statistical analysis was performed using JMP Pro software (version 17.0.0; SAS Institute Inc., Cary, NC, USA), GraphPad Prism (version 9.1.1; GraphPad Software, San Diego, California, USA) and R statistical software (version 4.2.2; R Project for Statistical Computing).
Results
Patients’ Characteristics
Patient characteristics are summarized in Table 1. The median age was 66.0 years and 52.3% were men. Of these patients, 1519 (11.9%) had LEDVT confirmed by ultrasound, consisting of 1152 distal and 367 proximal LEDVT. Overall, all patient characteristics were statistically significantly different across PNI quartiles (P < 0.001). As expected, patients in the lower PNI quartiles exhibited a higher incidence of LEDVT (P < 0.001). Consistently, violin plots showed that patients with LEDVT had significantly lower levels of albumin, lymphocyte and PNI than those without LEDVT, regardless of thrombus location (P < 0.001, Figure 1).

Violin plots comparing the levels of albumin, lymphocyte and prognostic nutritional index be-tween patients with and without LEDVT. (A) albumin levels; (B) lymphocyte levels; (C) prognostic nutritional index levels. The thick dashed lines within each violin indicate medians, and thin dashed lines indicate interquartile range. Abbreviations: LEDVT, lower extremity deep venous thrombosis.
Patient Characteristics According to Quartiles of PNI.

The P value refers to the comparison among quartiles.
Abbreviations: PNI, prognostic nutritional index; Q1, first quartile; Q2, second quartile; Q3, third quartile; Q4, fourth quartile; COPD, chronic obstructive pulmonary disease; LEDVT, lower extremity deep venous thrombosis.
Association Between PNI and the Risk of LEDVT
As shown in Table 2, the risk of LEDVT increased significantly with decreasing PNI, suggesting an inverse association between PNI and the risk of LEDVT. In detail, the fully adjusted model (model 3) indicated that patients in Q3 (OR = 1.486, 95%CI: 1.205–1.832, P = 0.001), Q2 (OR = 2.436, 95% CI: 1.993–2.978, P < 0.001) and Q1 (OR = 3.422, 95% CI: 2.791–4.195, P < 0.001) were at higher risk of LEDVT compared with those in Q4, and the test for trend was statistically significant (P < 0.001). When PNI was modeled as a continuous variable, each unit decrease in PNI was associated with a 6.0 % (95% CI: 1.052–1.069, P < 0.001) increased risk of LEDVT. We further evaluated the association based on the thrombus location, and the inverse association between PNI and either distal or proximal LEDVT remained significant in unadjusted and adjusted models (P < 0.05). Also, nonlinear inverse associations between PNI and the risk of LEDVT were clearly observed in the RCS curves (Figure 2).

Restricted cubic spline (RCS) analyses between prognostic nutritional index and the risk of LEDVT. (A) RCS curve for all LEDVT events; (B) RCS curve for distal LEDVT events; (C) RCS curve for proximal LEDVT events. The red lines represent restricted cubic spline curves, and light red areas represent 95% confidence intervals. Models were adjusted for patient demographics (age, sex, obesity, smoking), comorbidities (diabetes mellitus, chronic obstructive pulmonary disease, atrial fibrillation, heart failure, stroke, hepatic insufficiency, renal insufficiency, cancer), and laboratory findings (white blood cell, red blood cell, platelet). Abbreviations: OR, odds ratio; CI, confidence interval.
Association Between PNI and the Risk of LEDVT in the Main Analysis (n = 12790).

Model 1: adjusted for patient demographics (age, sex, obesity, smoking); Model 2: adjusted for patient demographics and comorbidities (diabetes mellitus, chronic obstructive pulmonary disease, atrial fibrillation, heart failure, stroke, hepatic insufficiency, renal insufficiency, cancer); Model 3: adjusted for patient demographics, comorbidities and laboratory findings (white blood cell, red blood cell, platelet).
Abbreviations: PNI, prognostic nutritional index; Q4, fourth quartile; Q3, third quartile; Q2, second quartile; Q1, first quartile; OR, odds ratio; CI, confidence interval; LEDVT, lower extremity deep venous thrombosis.
Subgroup Analysis and Sensitivity Analysis
To verify the robustness of our results, a series of subgroup analyses were conducted (Table 3). The results in all subgroup analyses were generally consistent with the main analyses, and no interaction effect reached significance. Moreover, 8931 patients were available for sensitivity analysis after excluding 3859 patients with missing data (Supplementary Figure 1). Of these patients, 1209 (13.5%) were diagnosed with LEDVT, including 948 distal and 261 proximal LEDVT. The sensitivity analysis showed similar results (Supplementary Table 6).
Subgroup Analysis of the Association Between PNI (Per Unit Decrease) and the Risk of LEDVT.

The associations (ORs) were adjusted for patient demographics (age, sex, obesity, smoking), comorbidities (diabetes mellitus, chronic obstructive pulmonary disease, atrial fibrillation, heart failure, stroke, hepatic insufficiency, renal insufficiency, cancer), and laboratory findings (white blood cell, red blood cell, platelet) except for the one defining the subgroup.
Abbreviations: LEDVT, lower extremity deep venous thrombosis; OR, odds ratio; CI, confidence interval.
Incremental Diagnostic Value of PNI
We next evaluated the incremental diagnostic value of PNI to a base model including traditional risk factors. As shown in Figure 3, the AUC of all LEDVT (AUC = 0.721, 95% CI: 0.709–0.734) improved by 0.025 (95% CI: 0.018–0.031, P < 0.001) when adding PNI (AUC = 0.746, 95% CI: 0.734–0.758), and the AUC of distal LEDVT (AUC = 0.738, 95% CI: 0.724–0.752) improved by 0.015 (95% CI: 0.009–0.021, P < 0.001) when adding PNI (AUC = 0.753, 95% CI: 0.740–0.766), and the AUC of proximal LEDVT (AUC = 0.703, 95% CI: 0.676–0.728) improved by 0.054 (95% CI: 0.036–0.072, P < 0.001) when adding PNI (AUC = 0.757, 95% CI: 0.733–0.780).
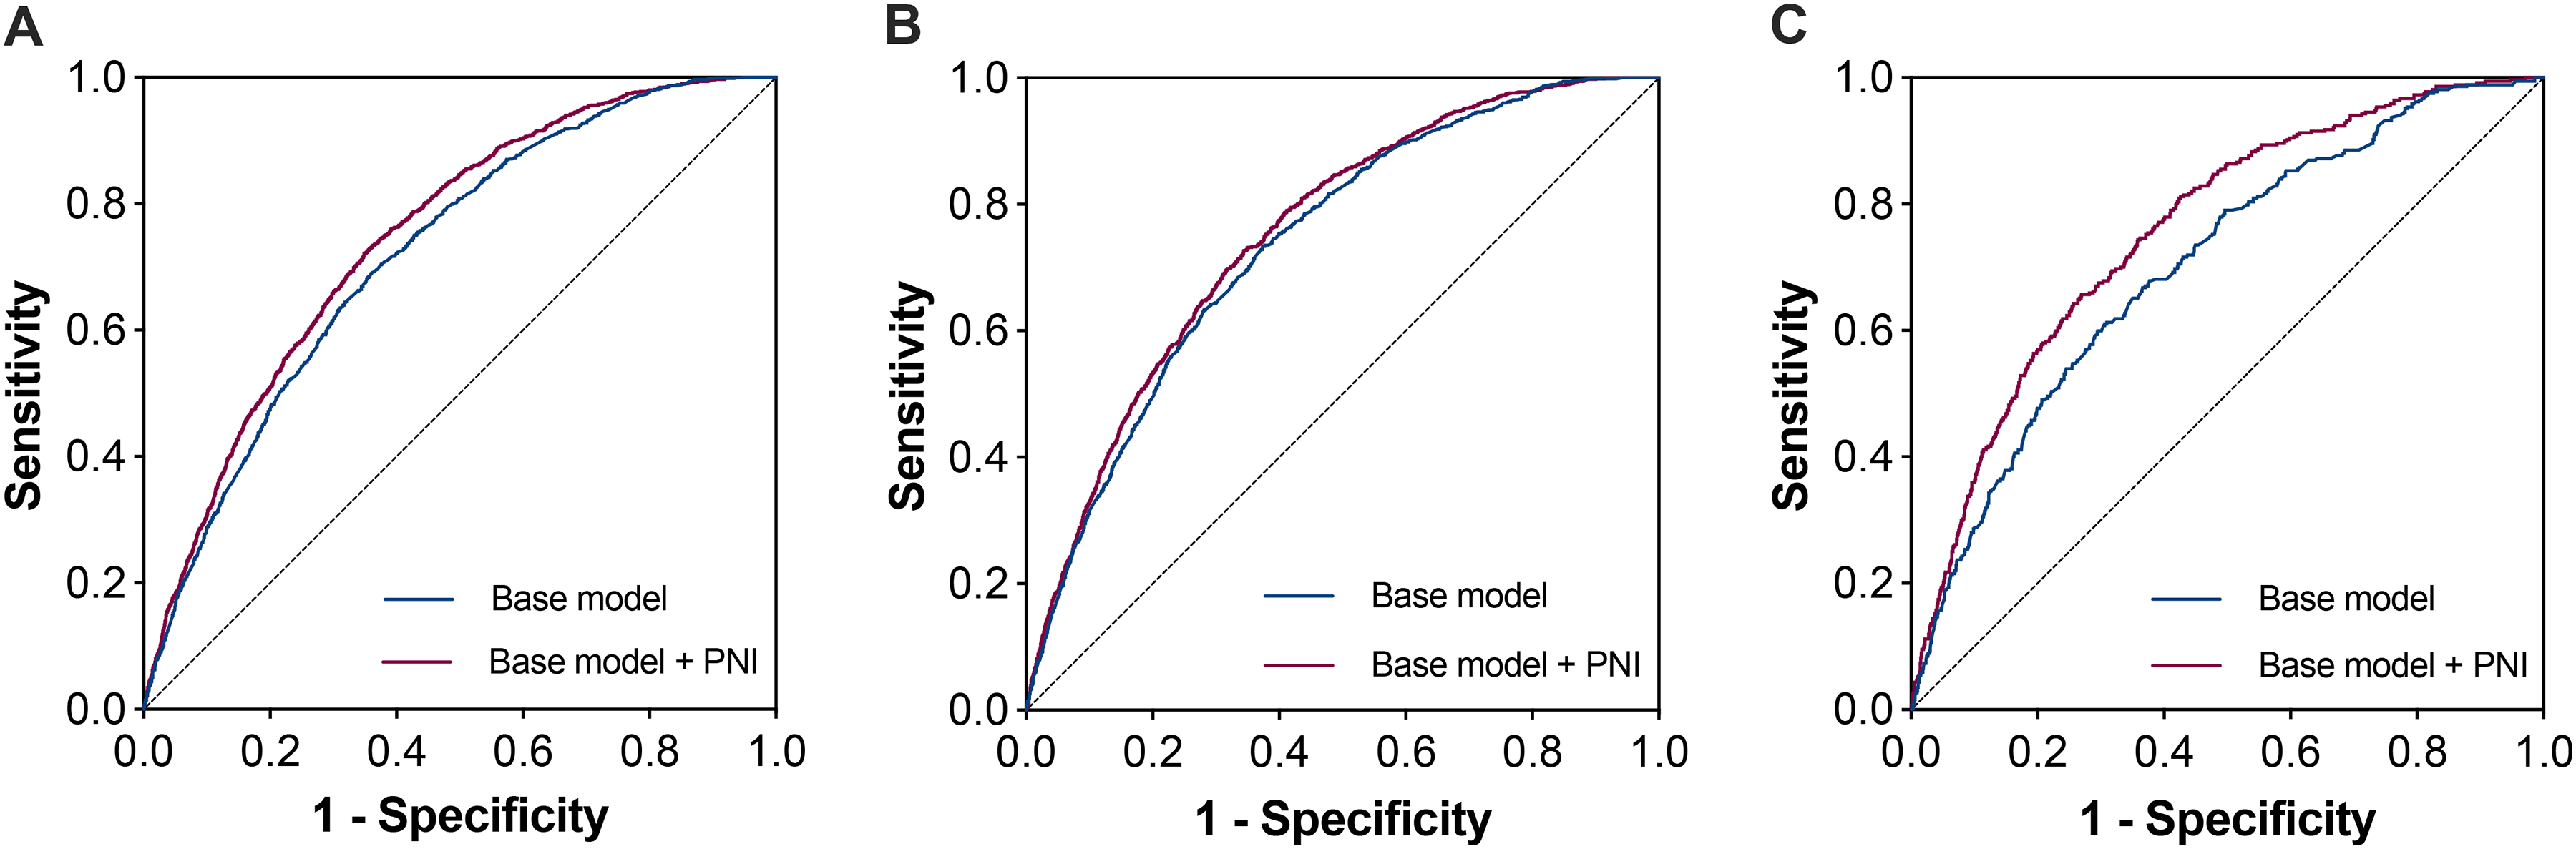
Receiver operating characteristic (ROC) curves for performance comparison between the base model and the base model plus PNI. (A) ROC curves for all LEDVT events; (B) ROC curves for distal LEDVT events; (C) ROC curves for proximal LEDVT events. The purple curves represent the base model plus PNI, while the blue curves represent the base model. The base model was adjusted for patient demographics (age, sex, obesity, smoking), comorbidities (diabetes mellitus, chronic obstructive pulmonary disease, atrial fibrillation, heart failure, stroke, hepatic insufficiency, renal insufficiency, cancer), and laboratory findings (white blood cell, red blood cell, platelet).
Discussion
Regarding the association between PNI and the risk of LEDVT, Zhang et al. 20 reported that PNI was negatively correlated with VTE events in patients with gastrointestinal cancers, of which the risk in the low group (PNI < 45.57) was 1.584 times (95% CI: 1.176–2.133) higher than that in the high group. Viewed from the opposite side, Kaller et al. 22 suggested that high PNI (> 38.65) was a protective factor against early thrombosis in patients with pre-dialysis end-stage renal disease (OR = 0.15, 95% CI: 0.05–0.40). Moreover, the inverse association has also been confirmed in patients with COVID-19, 21 as well as in patients after pancreatic surgery. 23 However, Oe et al. 25 reported that the incidence of DVT and PE was significantly higher in high PNI group (PNI ≥ 50) than in low PNI group (PNI < 50, 6.59% vs 2.54%, P = 0.004). These inconsistent conclusions may be attributed to sample size limitations, hence, the present study conducted an analysis with a large sample study of 12790 hospitalized patients. Consistent with the majority of the aforementioned studies,20–23 we observed an inverse association between PNI and the risk of LEDVT. More specifically, the lower the PNI, the higher the risk of LEDVT, as shown visually in the RCS curves. After adjusting for patient demographics, comorbidities and laboratory findings, each unit decrease in PNI was associated with a 6.0 % increased risk of LEDVT. To verify this trend, patients were divided into four groups based on PNI quartiles, and patients in Q3, Q2 and Q1 had a 1.486-fold, 2.436-fold and 3.422-fold greater risk of LEDVT compared with those in Q4, and the test for trend was statistically significant.
Considering the substantial differences between distal and proximal LEDVT,36–38 we further explored the association based on the thrombus location. Consistently, patients with lower PNI (either categorical or continuous variable) were at higher risk of having LEDVT. For instance, using the highest quartile as the reference, patients in the lowest quartile of PNI had a 2.849-fold and 6.078-fold increased risk of distal and proximal LEDVT, after adjustment for other possible risk factors (model 3). To our knowledge, this is the first study to show this association in both distal and proximal LEDVT. Despite this, a previous study indicated that other inflammatory markers (neutrophil-lymphocyte ratio [NLR], platelet-lymphocyte ratio [PLR]) were significantly correlated with thrombus burden in terms of thrombus location. 43 In addition, subgroup and sensitivity analyses yielded similar results, demonstrating a close association between PNI and the risk of LEDVT.
Although the underlying mechanism is unclear, this study provides additional evidence supporting the relationship between nutrition and thrombosis.9,10 As malnutrition is a modifiable risk factor, strategies to improve the nutritional status have been proposed to reduce the risk of thrombosis.23,24 However, this remains to be determined. On the other hand, we explored the diagnostic value of PNI alone for the detection of LEDVT events. However, the results did not exhibit promising performance, with an AUC of 0.673, a sensitivity of 64.8%, and a specificity of 61.9%, implying that PNI alone was not sufficient for clinical diagnosis. Thrombosis is a complex process that involves the interaction of blood cells, for this reason, there is no single biomarker available to exclusively confirm the diagnosis of VTE. 8 Given that PNI is an affordable and readily available biomarker in routine clinical practice, we constructed ROC curves and calculated the corresponding AUCs to evaluate the incremental diagnostic value of PNI to a base model. Although the usefulness of the model was still insufficient, adding PNI could significantly improve the diagnostic performance, regardless of whether LEDVT events were distal or proximal. Indeed, malnutrition have been recently integrated into risk assessment models for identifying hospitalized patients at higher risk of VTE.44–46 Therefore, monitoring PNI levels has a certain clinical value and may be used in the clinical diagnosis of LEDVT.
This study has several strengths. First, the relatively large sample size provided sufficient statistical power to detect associations of interest. More importantly, all patients were included consecutively from a population undergoing CUS examinations, thereby reducing the risk of selection bias. Second, LEDVT events were confirmed by CUS examinations, thus ensuring a reliable identification of thrombus location. Third, the robustness of our results was verified in a series of statistical analyses (eg, multivariate, RCS, subgroup and sensitivity analyses).
However, this study also has limitations. First, causal inference could not be established from this observational study. Additionally, being a retrospective study, some important variables were not available, such as other risk factors (eg, previous VTE, immobility, trauma and hormone use), and medication use before admission. It was also for this reason that this study did not compare the incremental diagnostic value of PNI with existing VTE risk assessment models (eg, Caprini, IMPROVE and Padua). 47 Second, this was a single center study, which potentially limited the generalizability of the results. Thus, further prospective multicenter studies are definitely required to confirm our findings. Third, due to the lack of medication regimen in the database (eg, antiplatelet/anticoagulant agents, medication dosage, medication duration), we were unable to evaluate the impact of medication data after admission on this association. Lastly, PNI levels were assessed only once at admission, which could cause potential bias due to measurement error.
Conclusion
This study indicated that low PNI is significantly associated with an increased risk of LEDVT in hospitalized patients. Importantly, PNI provides significant incremental diagnostic value for the identification of LEDVT events, regardless of distal or proximal LEDVT. These findings suggest that PNI may be a potential biomarker to help clinicians identify patients at risk of thrombosis and make clinical decisions timely, thereby preventing the progression to PE and improving clinical outcomes, which needs to be confirmed by further studies.
Supplemental Material
sj-docx-1-cat-10.1177_10760296251317520 - Supplemental material for Prognostic Nutritional Index as a Potential Biomarker for the Risk of Lower Extremity Deep Venous Thrombosis: A Large Retrospective Study
Supplemental material, sj-docx-1-cat-10.1177_10760296251317520 for Prognostic Nutritional Index as a Potential Biomarker for the Risk of Lower Extremity Deep Venous Thrombosis: A Large Retrospective Study by Hong Wang, Qing Zhou, Zhicong Wang, Xi Chen, Yuxuan Wu and Mozhen Liu in Clinical and Applied Thrombosis/Hemostasis
Supplemental Material
sj-docx-2-cat-10.1177_10760296251317520 - Supplemental material for Prognostic Nutritional Index as a Potential Biomarker for the Risk of Lower Extremity Deep Venous Thrombosis: A Large Retrospective Study
Supplemental material, sj-docx-2-cat-10.1177_10760296251317520 for Prognostic Nutritional Index as a Potential Biomarker for the Risk of Lower Extremity Deep Venous Thrombosis: A Large Retrospective Study by Hong Wang, Qing Zhou, Zhicong Wang, Xi Chen, Yuxuan Wu and Mozhen Liu in Clinical and Applied Thrombosis/Hemostasis
Footnotes
Acknowledgements
We sincerely thank Yuhang Cai from People's Hospital of Deyang City for data checking and cleaning.
Author Contributions
ZW, XC and ML: conceptualization and supervision; HW, QZ and YW: project administration; ZW, XC and ML: methodology; HW, QZ and YW: investigation; YW: data curation; HW and QZ: formal analysis and writing - original draft; ZW and XC: writing - review and editing. All authors reviewed and approved the final manuscript.
Data Sharing Statement
All data generated and analyzed during the study are included in this article. Further inquiries can be directed to the corresponding author.
Declaration of Conflicting Interests
The authors declared no potential conflicts of interest with respect to the research, authorship, and/or publication of this article.
Ethical Approval
This study was conducted in accordance with the Declaration of Helsinki principles and received approval from the Institutional Review Board of People's Hospital of Deyang City (Ethical Review No. 2021-04-019-K01).
Funding
This study was supported by the Scientific Research Project of Sichuan Health Information Association (grant number: 2023024), the Orthopedics (Shang Antong) Special Research Project of Sichuan Medical Association (grant number 2024SAT20), and China Efficient Industry-University-Research Innovation Fund - Huatong Guokang Medical Research Special Project (grant number: 2023HT068).
Informed Consent
The requirement for informed consent was waived owing to the retrospective design and anonymous data analysis.
Supplemental Material
Supplemental material for this article is available online.
References
Supplementary Material
Please find the following supplemental material available below.
For Open Access articles published under a Creative Commons License, all supplemental material carries the same license as the article it is associated with.
For non-Open Access articles published, all supplemental material carries a non-exclusive license, and permission requests for re-use of supplemental material or any part of supplemental material shall be sent directly to the copyright owner as specified in the copyright notice associated with the article.