
Abstract
Purpose
This study aimed to create and assess machine learning (ML) models that utilize nutritional and inflammatory indices, focusing on the advanced lung cancer inflammation index (ALI) and neutrophil-to-albumin ratio (NAR), to improve the prediction accuracy of PE prognosis.
Patients and methods
We conducted a retrospective analysis of 312 patients, comprising 254 survivors and 58 non-survivors. The Boruta algorithm was used to identify significant variables, and four ML models (XGBoost, Random Forest, Logistic Regression, and SVM) were employed to analyze the clinical data and assess the performance of the models.
Results
The XGBoost model, with optimal hyperparameters, achieved the best performance, with an accuracy of 0.882, an F1-score of 0.889, a precision of 0.917, a sensitivity of 0.863, a specificity of 0.905, and an AUC of 0.873. Analysis of feature importance indicated that the most critical predictors across models were respiratory failure, log-transformed ALI, albumin level, age, diastolic blood pressure, and NAR.
Conclusion
The ML-based prediction models effectively predicted the prognosis of PE, with the XGBoost model exhibiting good performance. Respiratory failure, ALI, albumin level, age, diastolic blood pressure, and NAR were correlated with PE prognosis.
Keywords
Introduction
Pulmonary embolism (PE) is a serious cardiovascular emergency that can lead to significant health complications and even death. 1 Upon diagnosis of pulmonary embolism (PE), initiating treatment promptly is essential, and the foremost action is to conduct a thorough risk assessment to guide the immediate initiation of anticoagulation, which is vital for improving patient outcomes. 2 The prognosis of patients with PE can vary widely, with some experiencing complete recovery and others experiencing rapid deterioration or death. This variability highlights the need for reliable predictive models that can forecast the prognosis of PE, which is crucial for clinical practice.3,4 Traditionally, the prognosis of PE has been evaluated using clinical scoring systems like the Pulmonary Embolism Severity Index (PESI) and the simplified PESI.4–8 These systems take into account demographic information, vital signs, and laboratory results to categorize patients into different risk levels.9–11 Although these tools have proven useful in clinical settings, their predictive accuracy is limited, often overlooking the complex interactions of various pathophysiological factors that affect PE outcomes. Recently, machine learning (ML) techniques have proved as a promising method for improving the prediction of PE prognosis.12–15 ML models can reveal complicated relationships within complex clinical data, potentially providing deep insight into the model. However, most of these studies have primarily focused on easily accessible clinical and laboratory parameters, neglecting a more comprehensive evaluation of the patient's nutritional and inflammatory status.9,15–19
Accumulating evidence suggests that nutritional and inflammatory indices are key predictors of the outcomes of various cardiovascular and pulmonary diseases. One such index, the advanced lung cancer inflammation index (ALI), is a composite marker that reflects the balance between the nutritional and inflammatory parameters. Studies have confirmed that an ALI score below 18 is a robust independent prognostic marker for poor outcomes in patients with advanced lung cancer, suggesting that the ALI may also be a significant predictor in other respiratory conditions.20,21 Similarly, the neutrophil-to-albumin ratio (NAR), which is a readily available biomarker indicating the relationship between inflammation and nutrition, has been linked to poor outcomes in both cardiovascular and pulmonary disorders.21–23 However, regarding pulmonary embolism (PE), the prognostic significance of these nutritional and inflammatory indices has not been thoroughly investigated. Incorporating these markers into predictive models could improve the accuracy of predicting the prognosis of patients with PE, potentially leading to more personalized risk assessments. The present study focused on creating and validating predictive models based on machine learning techniques to assess the prognosis of pulmonary embolism, utilizing a comprehensive set of nutritional and inflammatory indices, including ALI and NAR, as key predictors. By employing the machine learning methods, we aimed to enhance the accuracy and clinical relevance of PE prognosis predictions.
Material and Methods
Data Collection
The data for this study were extracted from the electronic healthcare system of the Taicang Affiliated Hospital of Soochow University, covering the period from 2016 to 2024. We focused on patients diagnosed with pulmonary embolism (PE) using lung computed tomography pulmonary angiography (CTPA). Those with severe comorbidities, a history of thromboembolic events, or who were lost to follow-up during the data collection period were excluded from the study. This study was approved by the Ethics Committee of Taicang Affiliated Hospital of Soochow University under the ethical approval number 2024-lw-008. The inclusion criterion for the study subjects was patients aged 18 years or older who had been diagnosed with pulmonary embolism. Individuals who were unable to obtain complete data were excluded. We collected baseline characteristics such as patient age, gender, height, weight, diseases history and baseline levels of inflammatory markers. As this was a retrospective study, patient consent was not required.
Data Preprocessing
Data preprocessing steps included data cleaning, handling of missing values, and feature selection using R software (version 4.3.2). Data cleaning was aimed at removing inconsistent and erroneous records. Quantitative data that adhered to a normal distribution were expressed as mean ± standard deviation (x̄ ± SD). To compare groups, one-way analysis of variance (ANOVA) was utilized. Categorical variables were summarized by their frequency and percentage, and intergroup comparisons were carried out utilizing either the Chi-square test or Fisher's exact probability test. For variables with missing values less than 25%, we employed the multiple imputation method (numeric variables using “pmm,” category variables using “random forest”) from the ‘mice’ package to impute the missing data. Variables with missing values greater than 25% were not included in the indicators of this study. Advanced lung cancer inflammation index calculation: serum albumin level (g/dl) × Body Mass Index (BMI) / Neutrophil-to-Lymphocyte Ratio (NLR), calculated using a validated algorithm. NAR calculation: neutrophil/albumin ratio. Prior to analysis, we utilized the ‘Boruta’ package for feature importance selection, and the selected features underwent correlation analysis to remove the feature with high correlation (r > 0.7) before being included in the model. 24 The Boruta algorithm functions by creating “shadow features,” which are random permutations of the original features. It then evaluates the importance of the actual features against these shadow features. Features that show significantly greater importance than their shadow versions are deemed significant and selected for the final model. A major advantage of the Boruta algorithm is its ability to handle both linear and nonlinear correlations between the features and target variable, making it a reliable option for feature selection. We employed a range of machine learning algorithms, utilizing R packages such as ‘caret’, ‘e1071’, ‘xgboost’, and ‘randomForest’, to develop predictive models, which included logistic regression, random forest, xgboost, and support vector machine (SVM). 25
Model Training and Validation
The dataset was split up into a training set (70%) and a testing set (30%) at random. The training set was further divided after SMOTE resampling, and the initial testing set was used for the validation analysis to evaluate the performance of the model. 26 The “DMwR” package was used to execute SMOTE resampling. To ensure the generalizability of the model, we used 5-fold cross-validation to assess the model performance.
Performance Evaluation Metrics
Model performance was assessed employing the following metrics: sensitivity, accuracy, specificity, F1-score and AUC. 27 F1-score calculation formula: 2 * (Precision * Recall) /(Precision + Recall). These metrics help to assess the efficacy of the model in distinguishing the prognosis of pulmonary embolism. Feature importance analysis of the advanced lung cancer inflammation index and others was carried out to rank the importance of each model.
Results
Characteristics of the Patients
This study included 312 patients, with 254 survivors and 58 non-survivors. No significant differences observed between the two groups initial attributes, such as age, gender, body mass index (BMI), dyspnea, chest pain, and syncope (p > 0.05). However, non-survivor group exhibited notable abnormalities in their vital signs. Specifically, the non-survivors had significantly lower systolic blood pressure (134 vs 146 mm Hg, p = 0.007) and diastolic blood pressure (78.5 vs 84.7 mm Hg, p = 0.007) compared to the survivors. Additionally, the non-survivors had higher neutrophil counts (6.18 vs 5.13 × 10^9/L, p = 0.038), but lower albumin (34.3 vs 38.2 g/L, p < 0.001) levels. Regarding comorbidities, the non-survivor group had a higher incidence of pneumonia (39.7% vs 25.2%, p = 0.040), hypertension (69.0% vs 52.4%, p = 0.032), diabetes (20.7% vs 5.12%, p < 0.001), and cancers (20.7% vs 8.27%, p = 0.011) compared to the survivors. Furthermore, respiratory failure (25.9% vs 3.94%, p < 0.001) was more common in the non-survivor group (Table 1).
Baseline Characteristics of the Patients.
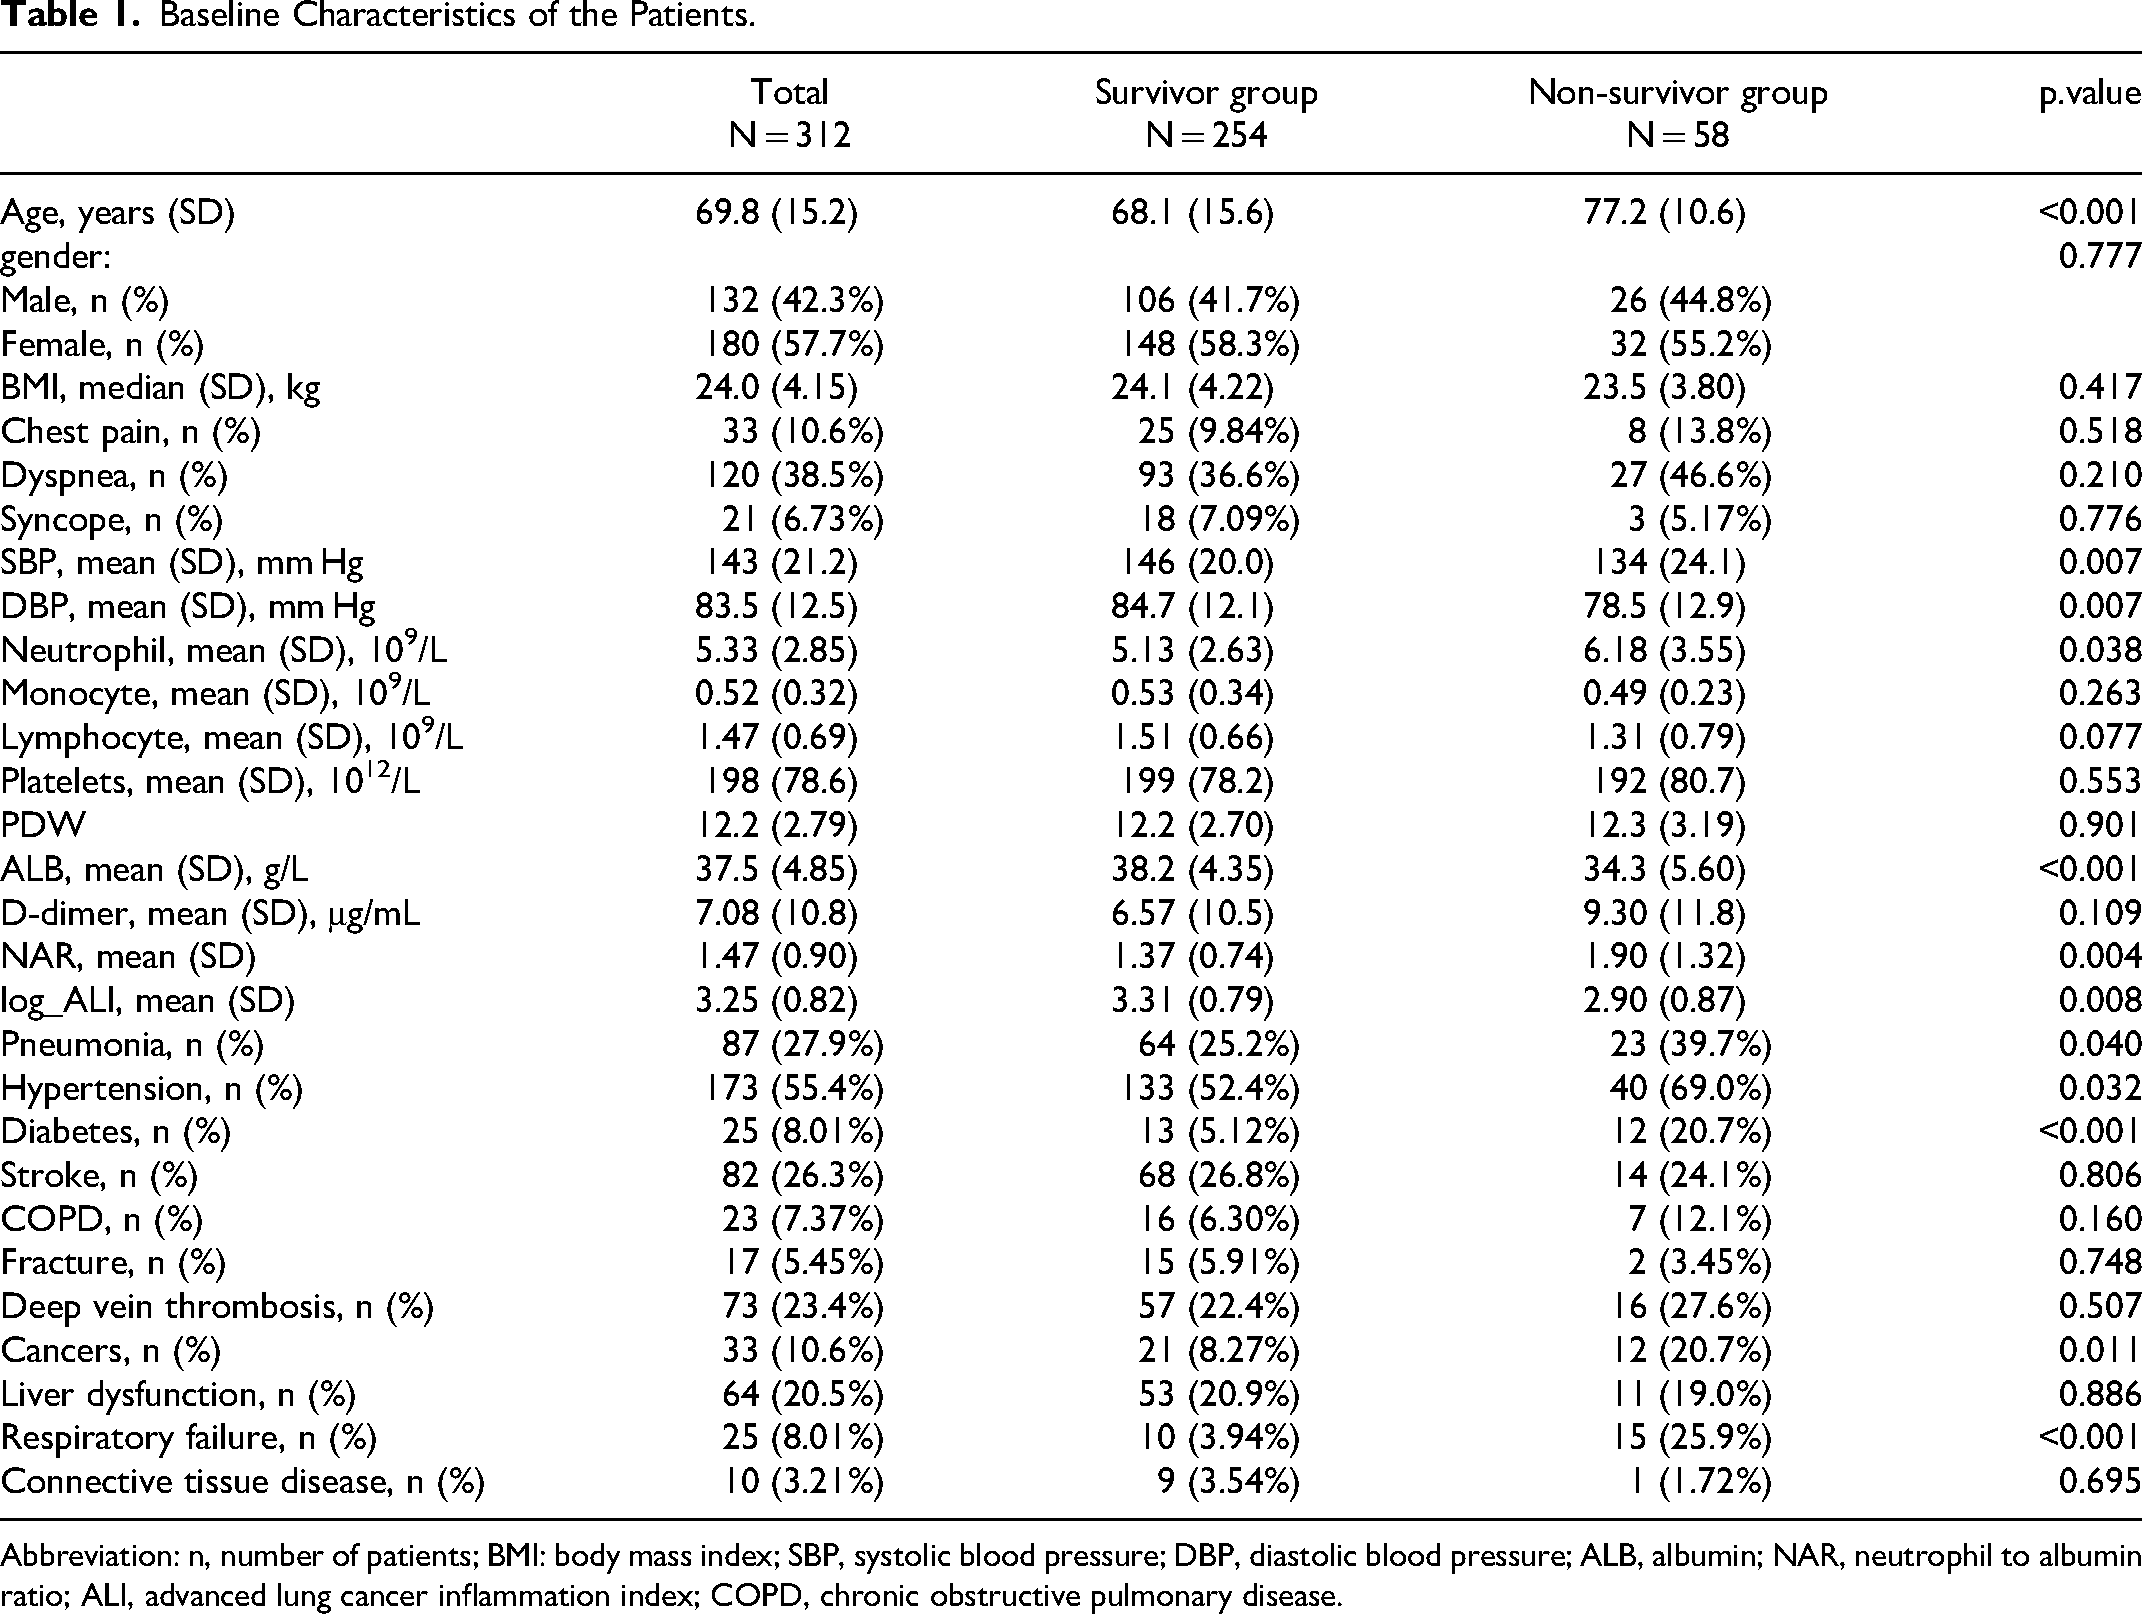
Abbreviation: n, number of patients; BMI: body mass index; SBP, systolic blood pressure; DBP, diastolic blood pressure; ALB, albumin; NAR, neutrophil to albumin ratio; ALI, advanced lung cancer inflammation index; COPD, chronic obstructive pulmonary disease.
Data Sets and Feature Selection
The original training set comprised 218 patients. The original test set consisted of 94 patients. After applying SMOTE, the training set had 308 patients, of whom 132 patients (41.3%) were in the non-survivors group. The SMOTE method was not applied to the test set. The Boruta algorithm identified seven out of the 21 features as important, with an additional 1 feature deemed tentative (Figure S1A). Among these seven crucial features, one exhibited a correlation coefficient that exceeded 0.70. To address collinearity, the neutrophil count feature was eliminated (Figure S1B).
Models Evaluation
Model evaluation results showed in Table 2. The primary metrics for evaluation encompassed accuracy, F1-score, precision, sensitivity (also known as recall), specificity, and AUC with a 95% confidence interval. The Logistic Regression model yielded an accuracy of 0.763, an F1-score of 0.792, a precision of 0.764, a sensitivity of 0.824, a specificity of 0.690, and an AUC of 0.757 (Figure S2 A), accompanied by a 95% confidence interval ranging from 0.652 to 0.855. In contrast, the Random Forest model, optimized with a hyperparameter setting of Mtry = 2, exhibited enhanced performance, achieving an accuracy of 0.860, an F1-score of 0.871, precision of 0.880, sensitivity of 0.863, specificity of 0.857, and an AUC of 0.848 (Figure S2 B), with a 95% confidence interval of 0.785 to 0.927. The SVM model, utilizing hyperparameters of C = 1 and Sigma = 1, demonstrated commendable performance, achieving an accuracy of 0.806, an F1-score of 0.827, precision of 0.811, sensitivity of 0.843, specificity of 0.762, and an AUC of 0.823 (Figure S2 C), with a 95% confidence interval of 0.727 to 0.908. Finally, the XGBoost model, configured with 500 trees, an interaction depth of 3, a shrinkage parameter of 0.1, and a minimum of one observation per node, produced the most favorable outcomes overall. It recorded an accuracy of 0.882, an F1-score of 0.889, precision of 0.917, sensitivity of 0.863, specificity of 0.905, and an AUC of 0.873 (Figure S2 D), with a 95% confidence interval from 0.839 to 0.974 (Table 2). The findings indicate that the XGBoost model, characterized by its superior performance across multiple evaluation metrics, emerges as the most appropriate choice for addressing the problem at hand among the models analyzed.
External Validation on Test Data in four machine learning models.
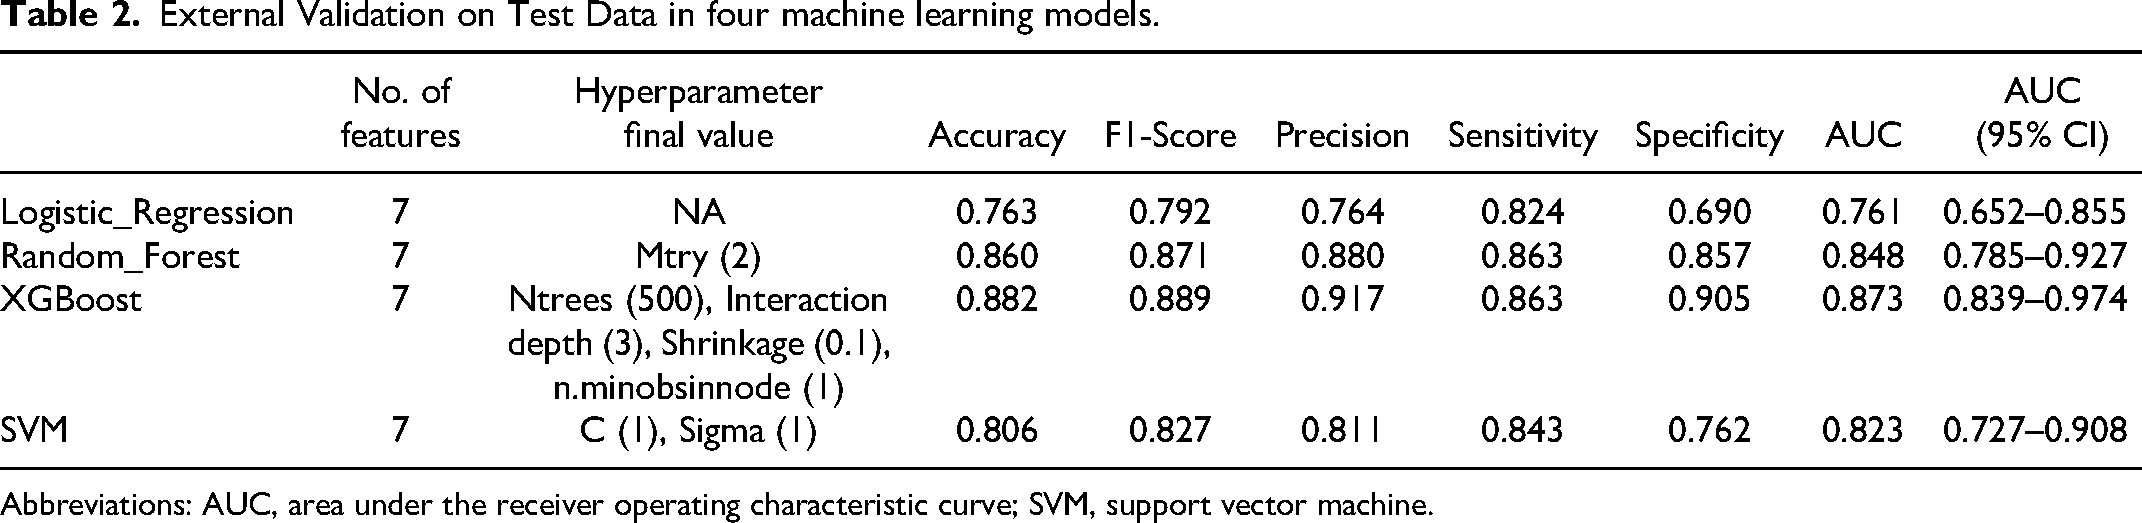
Abbreviations: AUC, area under the receiver operating characteristic curve; SVM, support vector machine.
Models Feature Importance
Analysis of the feature importance plots revealed the following key points. In the logistic regression model (Figure 1A), the most important features, in order of importance, were NAR, age, DBP, stroke, respiratory failure, and log_ALI. In the random forest model (Figure 1B), the key features were log_ALI, ALB, NAR, age, DBP, and respiratory failure. In the XGBoost model (Figure 1C), the most important features were log_ALI, ALB, age, DBP, and NAR. Similarly, in the support vector machine model (Figure 1D), the key features were log_ALI, ALB, stroke, age, NAR, and respiratory failure. Overall, log_ALI, ALB, age, DBP, and NAR were recognized as important across the multiple models.
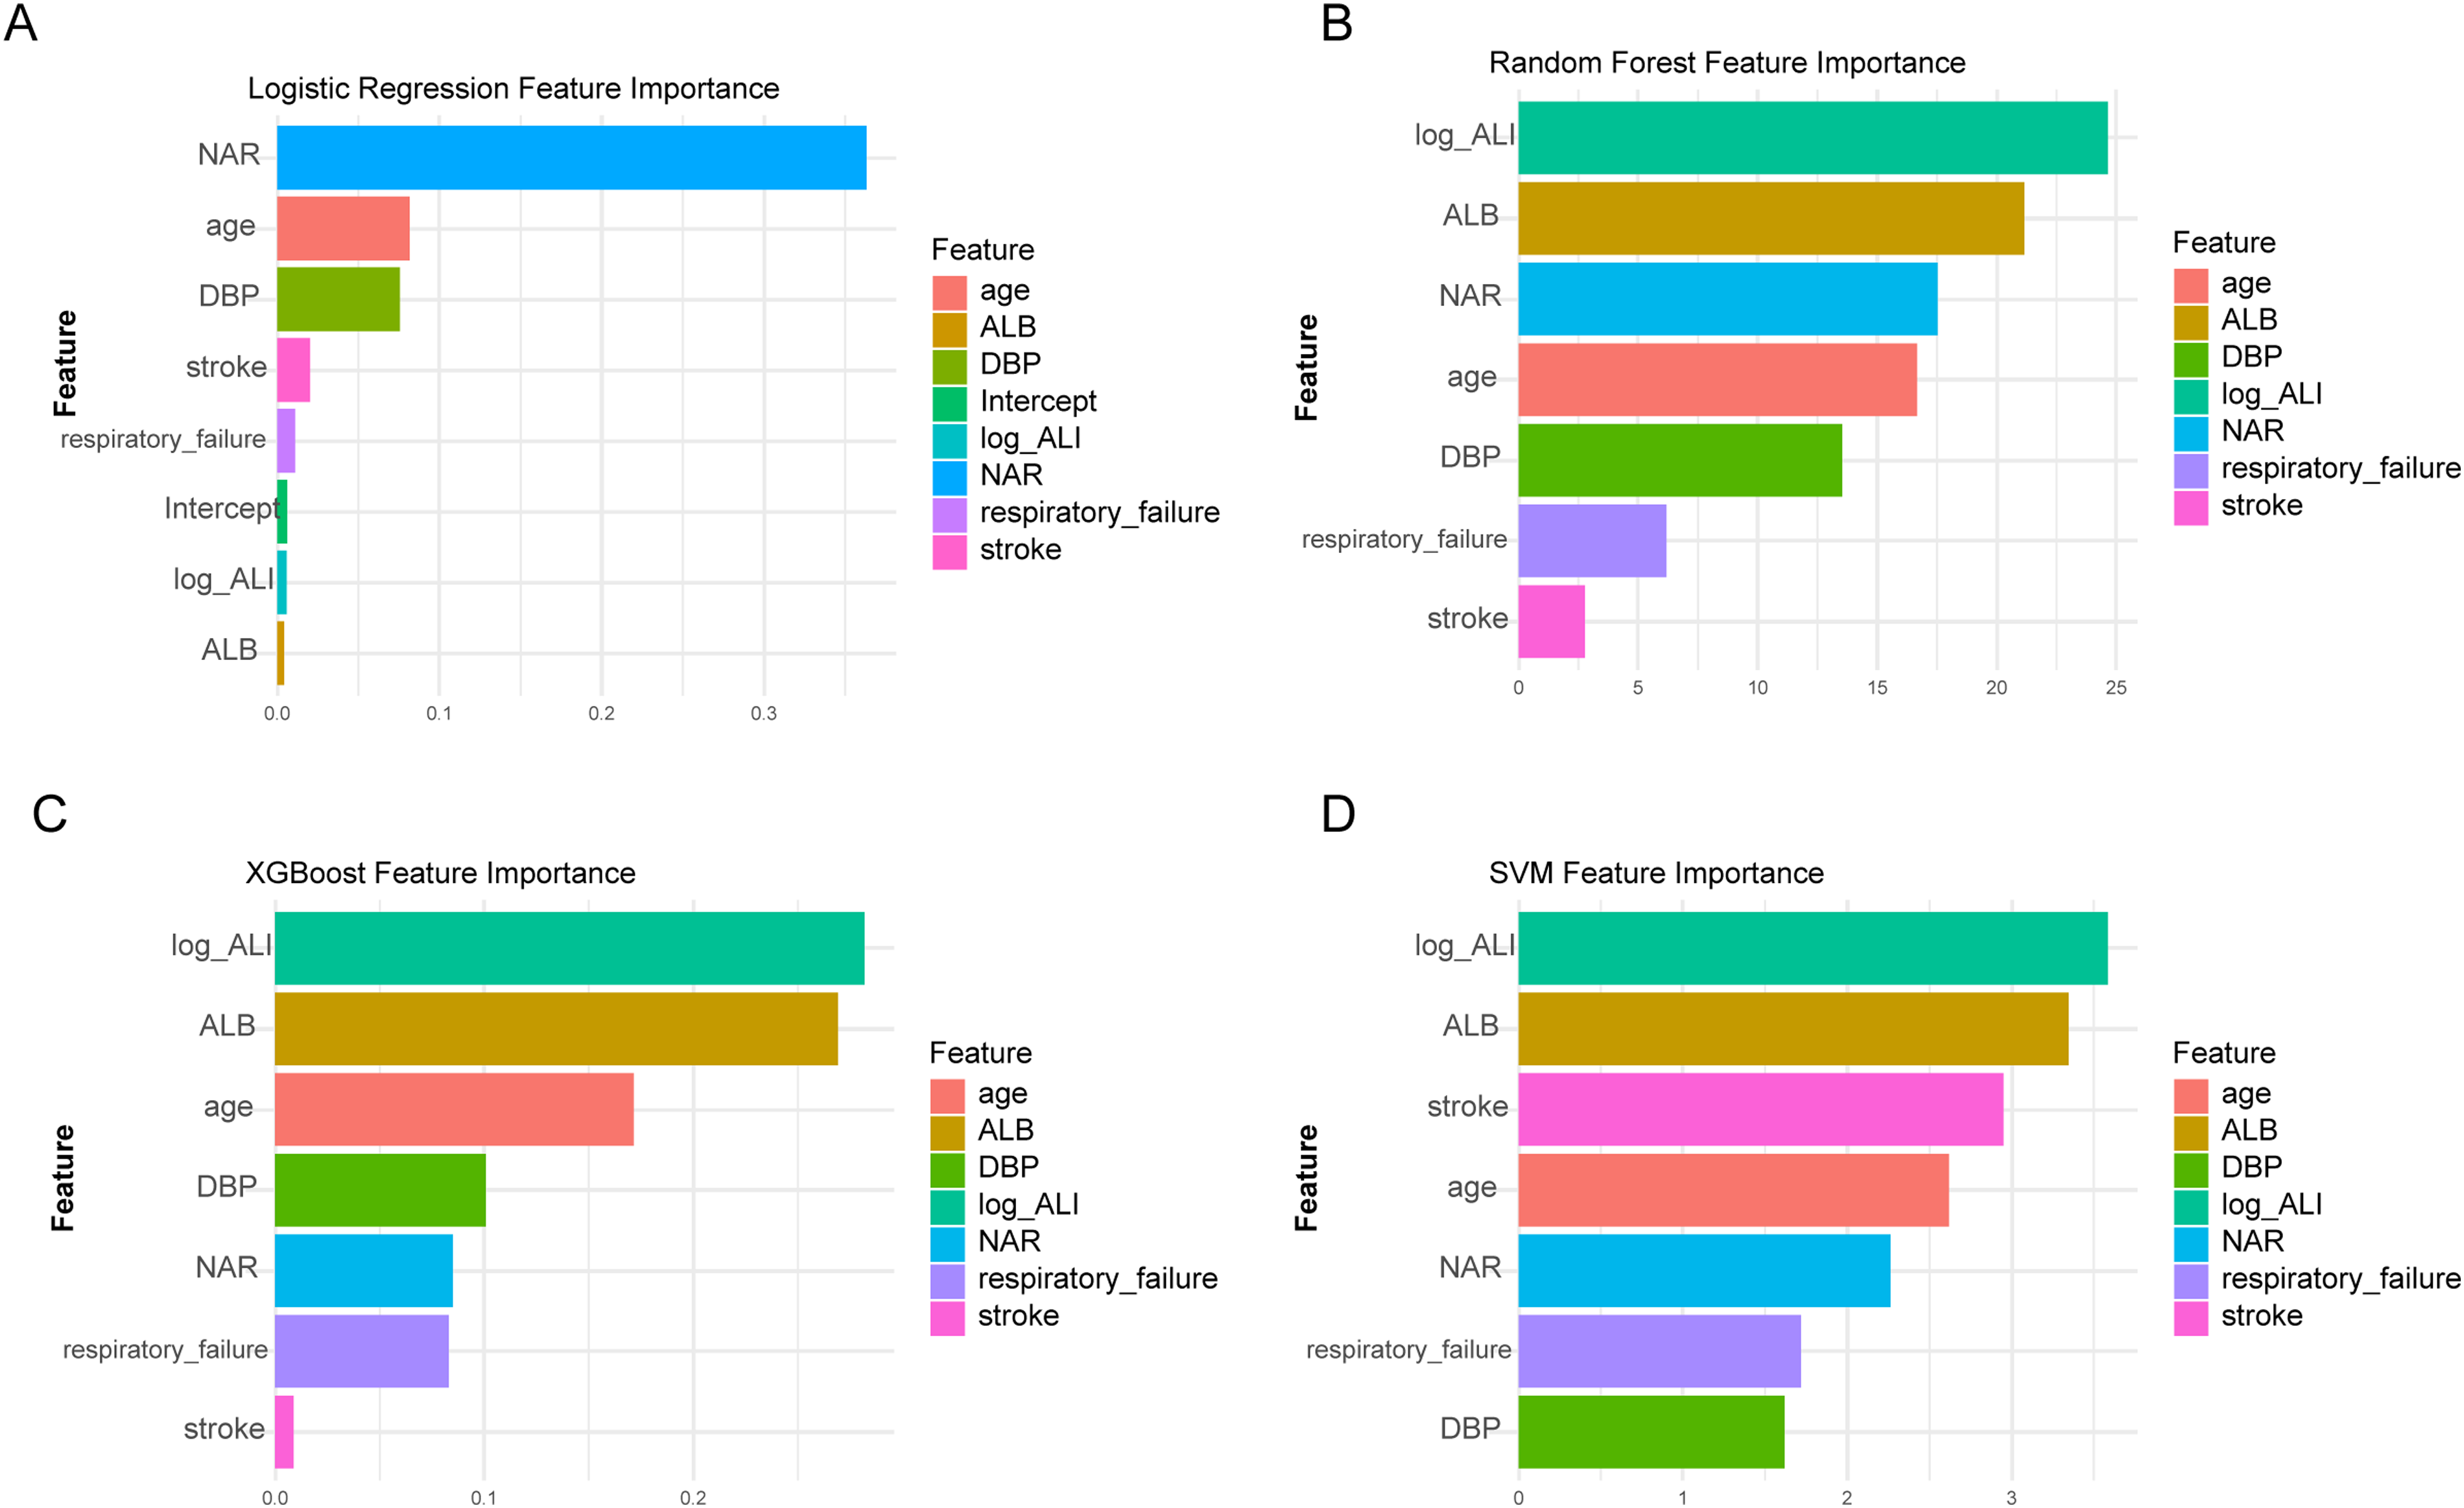
Comparative feature importance across different machine learning models. (A) Logistic Regression Feature Importance: This figure shows the relative importance of different features in a logistic regression model predicting the outcome of PE. Neutrophil-to-albumin ratio (NAR) is a prominent feature. (B) Random Forest Feature Importance: This section presents the feature importance scores from a random forest model. Log_ALI, ALB and NAR emerge as key features. (C) XGBoost Feature Importance: This figure illustrates the relative importance of different features in an XGBoost model, with log_ALI and ALB being more influential features. (D) SVM Feature Importance: This figure depicts the relative importance of different features in a support vector machine (SVM) model. Log_ALI and ALB are identified as the important features.
Discussion
In this study, we aimed to develop and evaluate machine learning models that utilizes the ALI and NAR as novel prognostic biomarkers to predict survival status in patients with pulmonary embolism (PE). While inflammation's role as a prognostic marker in various cancers is well-established, the use of ALI to predict PE outcomes has not been previously explored. We utilized retrospective clinical data to apply several machine learning algorithms, evaluating their sensitivity, accuracy, specificity, and the area under the curve (AUC) for predicting PE prognosis. Our results showed that the four machine learning models we evaluated performed well in predicting outcomes for PE, yet there were significant differences in their performance metrics. These differences can be attributed to several factors. Logistic regression, which is a relatively straightforward linear model, may underfit the data, resulting in less effective performance on the test set. In contrast, nonlinear models, such as random forest, XGBoost and support vector machines, are better equipped to capture complex data patterns. Additionally, ensemble models such as random forest and XGBoost generally possess enhanced fitting capabilities and greater generalization, contributing to their superior performance in this context. Support vector machines strike a balance between complexity and generalization, occupying a unique position in machine learning. In terms of calculating feature importance, different models employ distinct methods: logistic regression relies on model coefficients to indicate feature significance, while random forest and XGBoost utilize tree-based measures. Since support vector machines do not have built-in methods for assessing feature importance, we employed Permutation Importance based on model performance. These varying approaches to calculating feature importance can result in different feature rankings across models. Additionally, models exhibit different sensitivities to data distribution, potentially leading to inconsistent performances across certain metrics. Our findings suggest that incorporating ALI and NAR significantly enhances predictive capabilities compared to traditional models, providing a robust framework for clinical decision-making. 28 Respiratory failure, albumin, age and blood pressure are important features predicting the outcome of pulmonary embolism, aligning with previous studies.29–32 One of the significant findings in our study is the notable age difference between PE patients who survived and those who did not. This observation aligns with our expectations and is consistent with previous research that has identified age as a critical factor in PE prognosis.
However, this study had several limitations. Primarily, its retrospective design posed challenges in data collection. We faced difficulties in obtaining complete information on the exact dates of mortality for some patients. This incomplete data prevented us from recording precise survival times in our analysis and conducting a survival analysis. The challenges in collecting precise data on the exact times of death and treatment durations stem from the inherent limitations of retrospective studies. These studies often rely on recollections from patients and their families during follow-up, which can be problematic due to the passage of time. Memory inconsistencies can significantly affect the completeness and accuracy of the data collected, a common issue in real-world clinical research, particularly when long follow-up periods are involved. It is worth noting that in the study design, we excluded the high-risk population with severe comorbidities or previous thrombosis. These high-risk groups inherently have poorer prognosis, which may have influenced the independent prognostic value assessment of the selected biomarkers. Future research may consider expanding the study scope to include this high-risk population, further investigating the prognostic predictive ability of these markers in different subgroups of patients. This would help to more comprehensively evaluate the clinical application of these emerging biomarkers in the management of pulmonary embolism patients. Additionally, while this sample size was adequate for model training, a larger cohort would enhance the model's predictive capabilities. Future studies should consider prospective designs that facilitate more accurate and timely data collection. This approach would enhance the robustness of the models and provide a more comprehensive understanding of pulmonary embolism outcomes across diverse patient populations and settings. Furthermore, the link between smoking and pulmonary embolism (PE) is well-established, with smokers experiencing a heightened risk of venous thromboembolism (VTE). 33 Although our study wasn't designed to explore the effect of smoking on PE prognosis, we can leverage existing literature to discuss this relationship. Smoking's prothrombotic effects, such as increased platelet aggregation and fibrinogen levels, promote thrombus formation, potentially leading to PE. 34 In terms of prognosis, smokers with PE often present with more severe disease, reflected in higher rates of right ventricular dysfunction and mortality. Additionally, smoking-induced inflammation may diminish treatment efficacy and increase the risk of complications like chronic thromboembolic pulmonary hypertension. Importantly, smoking cessation is tied to better VTE outcomes and a lower risk of recurrence, underscoring its significance in PE management. 35 Despite the absence of smoking history data in our study, the literature emphasizes the need to consider smoking as a modifiable risk factor in PE. Future research should incorporate smoking history to fully assess its prognostic impact and to inform clinical practices aimed at preventing and treating PE.
Conclusion
In conclusion, our findings propose four models for predicting PE outcomes. The XGBoost model showed good performance. Respiratory failure, ALI, albumin, age, diastolic blood pressure and NAR are associated with the prognosis of PE. However, our analysis is limited without considering smoking history. Future research should incorporate this data to enhance our understanding of PE risk factors and refine predictive models for better clinical outcomes.
Footnotes
Acknowledgments
The authors greatly thank Cheng Hou, Qing Li for their support in our data collection.
Declaration of Conflicting Interests
The authors declared no potential conflicts of interest with respect to the research, authorship, and/or publication of this article.
Funding
The authors disclosed receipt of the following financial support for the research, authorship, and/or publication of this article: This work was supported by the The science and technology program of Taicang, (grant number TC2023JCYL20).