
Abstract
Prophylactic anticoagulation is a standard strategy for patients undergoing total hip arthroplasty (THA) to prevent deep venous thromboembolism (DVT) and pulmonary embolism (PE). Nevertheless, some patients still experience these complications during their hospital stay. Current risk assessment methods like the Caprini and Geneva scores are not specifically designed for THA and may not accurately predict DVT or PE postoperatively. This study used machine learning techniques to establish models for early diagnosis of DVT and PE in patients undergoing THA. Data were collected from 1481 patients who received perioperative prophylactic anticoagulation. Model establishment and parameter tuning were performed using a training set and evaluated using a test set. Among the models, extreme gradient boosting (XGBoost) performed the best, with an area under the receiver operating characteristic curve (AUC) of 0.982, sensitivity of 0.913, and specificity of 0.998. The main features used in the XGBoost model were direct and indirect bilirubin, partial activation prothrombin time, prealbumin, creatinine, D-dimer, and C-reactive protein. Shapley Additive Explanations analysis was conducted to further analyze these features. This study presents a model for early diagnosis DVT or PE after THA and demonstrates bilirubin could be a potential predictor in the assessment of DVT or PE. Compared to traditional risk assessment, XGBoost has a high sensitivity and specificity to predict DVT and PE in the clinical setting. Furthermore, the results of this study were converted into a web calculator that can be used in clinical practice.
Introduction
Total hip arthroplasty (THA) is a primary intervention for treating end-stage hip disease and plays a vital role in enhancing the quality of life of elderly patients. 1 However, deep venous thromboembolism (DVT) and pulmonary embolism (PE) are significant complications for hospitalized patients, and they are the leading causes of mortality and morbidity after THA. 2
Numerous causes contribute to the development of DVT and PE after THA, the commonly thought causes being venous injury, venous stasis, and a hypercoagulable state of the blood.2–4 However, in clinical practice, factors such as advanced age, restricted movement, ethnicity, obesity, and inflammation are thought to be jointly involved in the development of DVT.5–11
Concurrently, prophylactic anticoagulation has become a requisite approach in the perioperative period of THA, which significantly decrease the overall incidence of postoperative venous thromboembolism (VTE). However, despite receiving prophylactic anticoagulation therapy, some patients still suffer from these severe complications during their hospital stay and post hospital stay. 12
The current incidence of VTE after THA in China ranges from 2.4% to 6.49%. However, according to Cho and Li, the range is much wider, between 2.9% and 20%.13,14 It is worth noting that patients under prophylactic anticoagulation therapy are still susceptible to developing DVT or PE postoperatively, as evidenced by previous studies.2–4,15 However, in clinical, it is rare to actually identify patients who develop DVT or PE after THA at an early stage.
The Caprini score and Geneva score are commonly used to determine the risk of DVT or PE in patients undergoing elective THA.16–18 However, in the Caprini score, all THA patients are scored 5 for “elective critical replacement” or “hip, pelvis or lower extremity fracture,” indicating a high risk for DVT development. Similarly, in the Geneva score, THA patients typically have “unilateral limb pain and swelling” and are mostly elderly, leading to a high score and moderate risk group classification. However, this classification has limited usefulness in accurately predicting DVT or PE in this population.
Thus, our goal is to utilize machine learning (ML) techniques to establish a predictive risk model that can diagnose the incident of DVT or PE after elective THA based on patient status. This will help address the current challenge of inadequate risk assessment before THA surgery.
Materials and Methods
Study Design and Protocol
The study protocol (Figure 1) complies with the principles of the Declaration of Helsinki, and it was approved by the Ethics Committee of Shanghai Changzheng Hospital (approval No. CZEC (2021)-02). Since this is a retrospective research and anonymized data were evaluated, patient consent was waived by our institutional ethic committee.
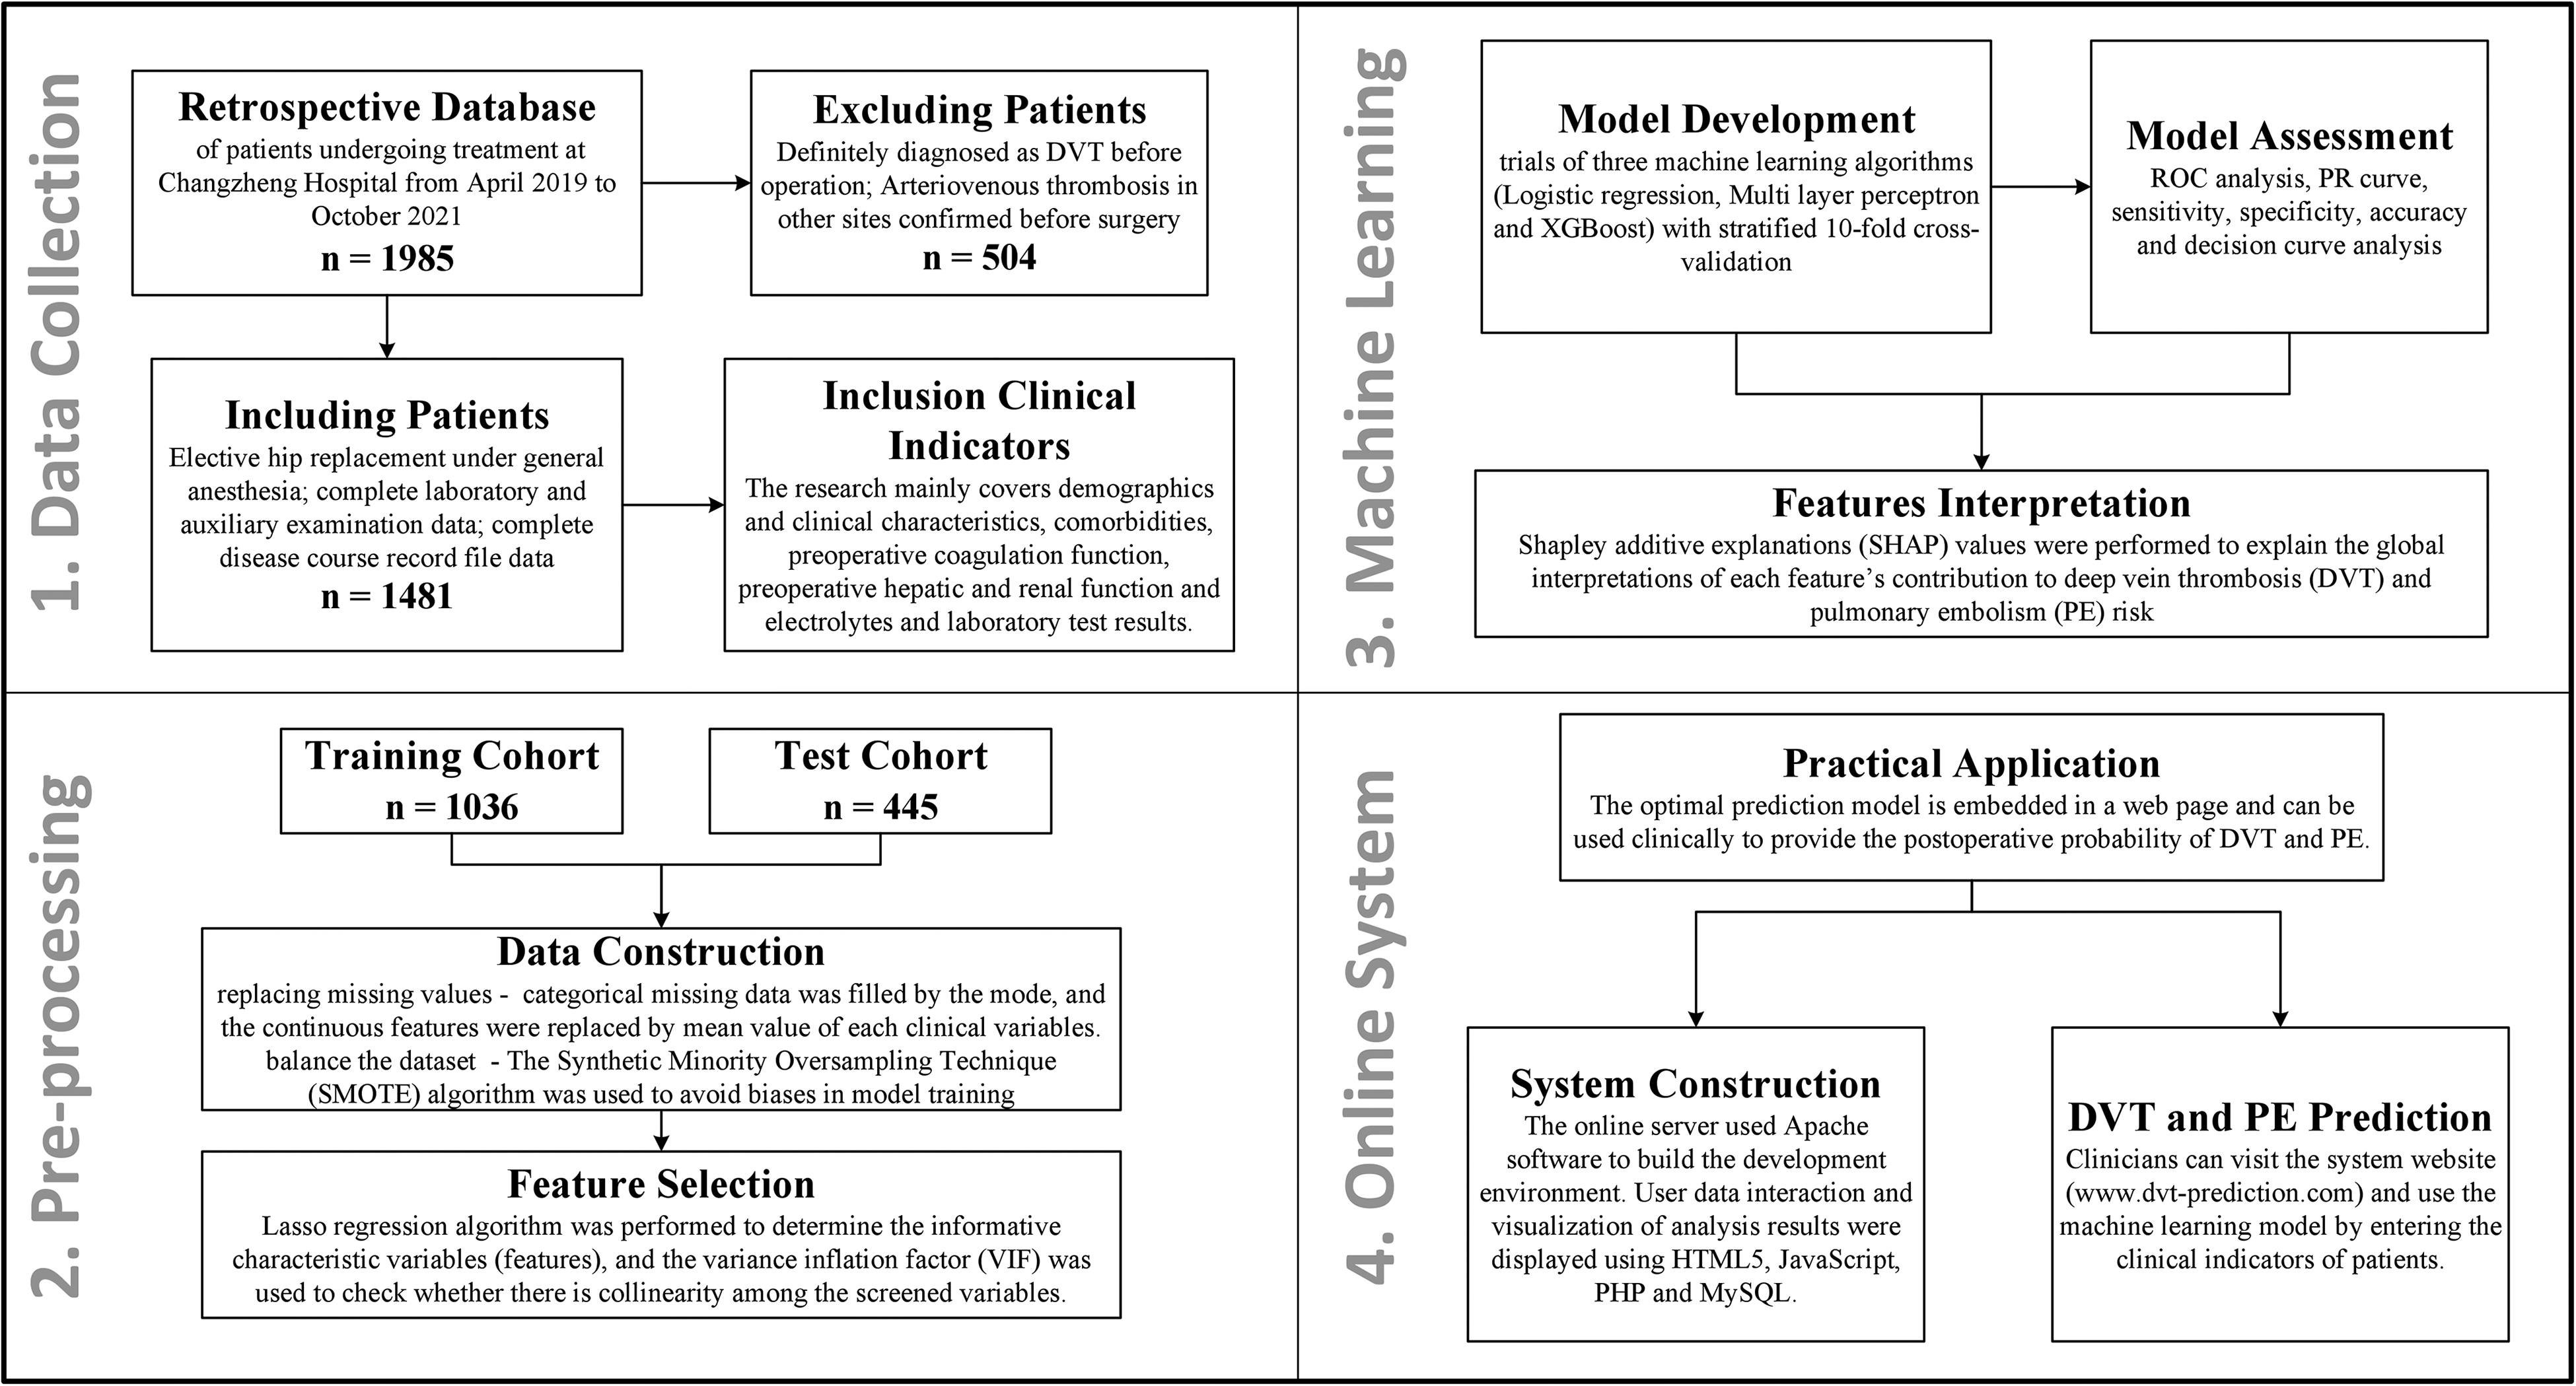
Outline of the study protocol.
Study Samples
This retrospective study included a total of 1985 patients who underwent hip arthroplasty at Shanghai Changzheng Hospital between April 2019 and December 2021. The inclusion criteria were as follows: elective surgeries, hip arthroplasty under general anesthesia, complete laboratory and ancillary examination data, and complete medical records. The exclusion criteria were as follows: patients diagnosed with DVT before surgery and patients with confirmed arterial or venous embolism in other parts of the body before surgery; more than 30% of laboratory and auxiliary examination data were missing. All included THA patients were subjected to standardized VTE prophylaxis measures. The basic preventive measures encompass several strategies aimed at minimizing the risk of VTE, such as gentle surgical techniques, proper limb elevation, early mobilization, muscle exercises, patient education, and lifestyle modifications. Regarding medication-based prophylaxis, we administer fondaparinux sodium 2.5 mg subcutaneously once daily during the hospital stay, starting no earlier than 6 h after surgery. After discharge, patients are prescribed rivaroxaban 10 mg orally once daily for 30 days postoperatively. Mechanical prophylaxis measures such as graduated compression stockings, intermittent pneumatic compression, or venous foot pumps were not employed.
Variable Extraction
For each of these patients, pre-operate clinical features such as demographics and clinical characteristics, comorbidities, preoperative coagulation function, preoperative hepatic and renal function and electrolytes and laboratory results were extracted retrospectively from the electronic health records (EHRs). Table 1 presents the major clinical variables of the patients extracted from the electronic medical records.
Pre-operate Clinical Features Included in the Analysis.

Study Outcomes
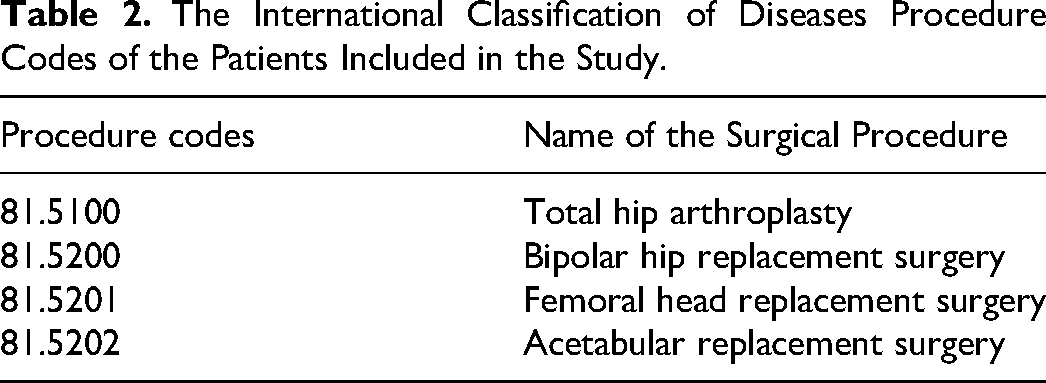
The study endpoint was the diagnosis of DVT or PE at discharge, which was identified using the International Classification of Diseases (ICD-10) procedure codes (Table 2).
The International Classification of Diseases Procedure Codes of the Patients Included in the Study.
Data Pre-processing
The structured database initially comprised over 70 clinical variables. Firstly, clinical variables with missing percentages >30% (n = 6) were excluded. Then, categorical missing data were filled by the mode, and the continuous features were replaced by mean value of each clinical variable. Furthermore, categorical data were transformed into dummy variables for subsequent model construction. The final set of input features included 67 pre-operate clinical characteristics of patients (Supplemental Table 1).
The patient data were randomly divided into 2 data sets: (1) a training data set (70% of patients) used for feature selection and model training and (2) a testing data set used for model performance evaluation (30% of patients). Statistical comparisons between the 2 data sets are shown in Supplemental Table 2. The training data set was oversampled using the Synthetic Minority Oversampling Technique algorithm to balance the data set and avoid biases in model training.
To obtain the feature subset with the maximum information content, we also used ML method lasso regularization to construct the feature subset, and the lambda value with the best predictive performance during cross-validation was selected as the final regularization coefficient. To avoid bias in subsequent model training and improve the interpretability of the constructed ML model, variance inflation factor (VIF) was used to check for multicollinearity among the selected features, ensuring that the VIF values of the features used for model training were all <5.
Model Development and Assessment
The ML task is to predict the probability distribution of patients developing deep vein thrombosis based on these preoperative clinical variables. Model development included trials of 6 ML algorithm including logistic regression (LR), multilayer perceptron (MLP), extreme gradient boosting (XGBoost), adaptive boosting (AdaBoost), gradient boosting tree model (GBC), and k-nearest neighbor (KNN). We trained the models using 10-fold cross-validation in the training set and used a grid search method to tune the hyperparameter of each algorithm to obtain the optimal predictive performance.
To evaluate the predictive performance of each model, receiver operating characteristic (ROC) curves were calculated and used as the primary evaluation metric. We also calculated decision curve analysis (DCA) curves, sensitivity, specificity, accuracy, FP (false positive) rate, PPV (positive predictive value), NPV (negative predictive value), brier score, AP (average precision), and F1 for each model.
To better evaluate the ML models, we also compared the optimal ML model with traditional scores, including Geneva score, DVT index (Imai published on PLoS One in 2017, which is named “PLOS” below), and Rapt.
Feature Interpretation
We used the Shapley Additive Explanations (SHAP) algorithm to explain the major features that made significant contributions to the prediction after the ML model was trained, as appropriate. Specifically, the SHAP algorithm can calculate the Shapley value of each feature value, which is the average contribution of that feature value to the prediction across all possible feature combinations. By taking a weighted average of the Shapley value of each feature value, we can obtain the contribution of that feature to the overall prediction.
Statistical Analysis
Continuous variables are expressed as mean ± SD, and categorical variables are presented as frequency. Continuous variables were compared using analysis of 2-tailed Student's t-tests or Mann–Whitney U-test, as appropriate. For comparison of categorical variables, chi-squared test or Fisher's exact test was used based on variable type. P-value <.05 indicates statistical significance of the difference.
The statistical analysis and major data pre-processing were conducted using R (version 4.2.2, https://www.r-project.org/). The ML models were created using the scikit-learn package in the Python environment (version 3.9.13, https://www.python.org/). The detailed version information of the relevant packages is presented in Supplemental Table 3.
Results
Study Participants
Our study cohort ultimately included 1481 patients (63.63 ± 14.74 years, 615 [41.53%] males) who underwent hip arthroplasty. A total of 76 DVT or PE patients (77.59 ± 13.33 years, 20 [26.32%] males) were enrolled and entered to the database. Table 3 shows the main patient features extracted from our EHRs.
Baseline Epidemiological Data of Included Patients.

Abbreviations: VTE, venous thromboembolism.
Predictive Feature Selection
Feature selection and simplification can reduce the complexity and overfitting risk of the model, improve the efficiency and stability of the model, and enhance the interpretability of the model. The clinical features with missing values exceeding 30% were first removed, including FDP, calcium, cystase inhibitor C, retinol binding protein, estimated glomerular filtration rate, and phosphorus. As shown in Figure 2A and B, through feature selection using lasso regularization, the best predictive performance was obtained at a lambda value of 0.00483, and a total of 27 informative clinical indicators were selected, while the other 50 clinical indicators were excluded. The included clinical features consist of history of surgery, hypertension, diabetes, spring, winter, age, prothrombin time, activated partial thrombin time, INR, D-dimers, direct bilirubin, indirect bilirubin, AST, glucose, urea, uric acid, creatinine, prealbumin, alkaline phosphatase, carbon dioxide, lymphocyte percentage, eosinophils, red blood cells, mean erythrocyte volume, mean hemoglobin concentration, platelet, and hypersensitive C-reactive protein. After checking for multicollinearity, all the included indicators have VIF values <5, indicating no collinearity issues, as shown in Supplemental Figure 1.

Selection of indicators with prognostic pre-operate clinical features. (A) Selection of optimal parameter (lambda) in least absolute shrinkage and selection operator (LASSO) model. The lambda value with the best predictive performance during cross-validation is considered as the optimal lambda value (corresponding to the dashed line on the left). (B) Generate coefficient profile plot for clinical indicators with prognostic information based on the sequence of logarithmic (lambda) values, where the y-axis represents the distribution of LASSO coefficients for clinical indicators.
Model Performance
In this study, we performed model training and hyperparameter tuning based on the training set and validated the model on the training set. The results of parameter tuning and model training are shown in Table 4. We can see that the area under the receiver operating characteristic curve (AUC) of the XGBoost model is the highest in both the training set and validation set, with values of 0.991 ± 0.012 (10-fold cross-validation) and 0.982, respectively.
Results of Hyper-parameter Tuning With Different Machine Learning Algorithms.
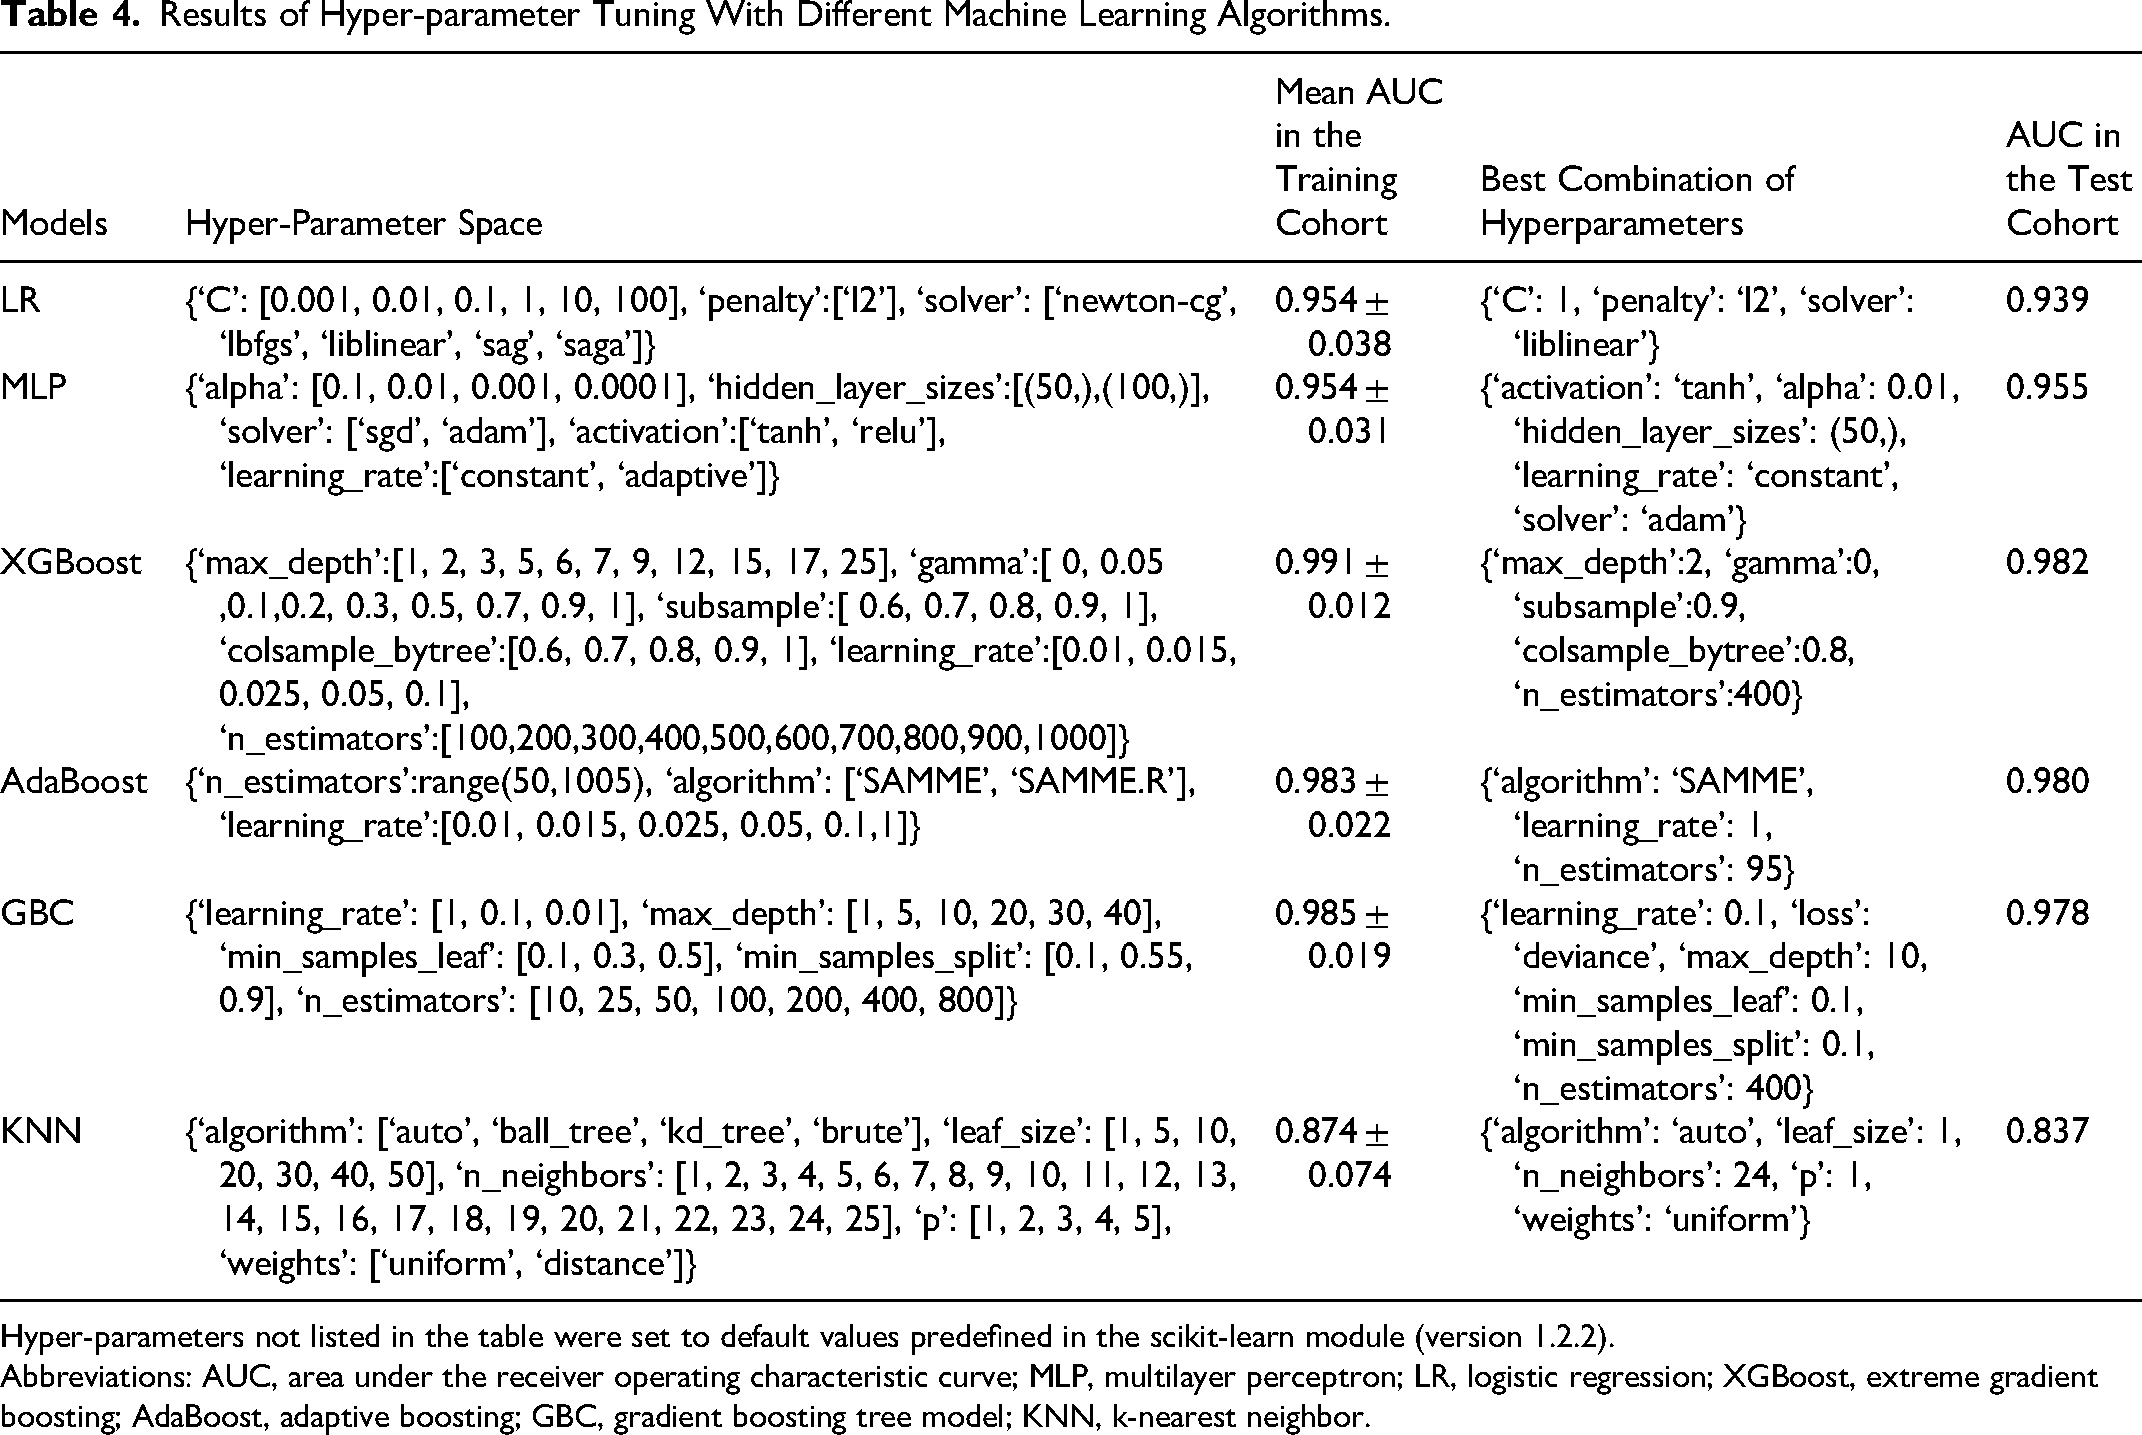
Hyper-parameters not listed in the table were set to default values predefined in the scikit-learn module (version 1.2.2).
Abbreviations: AUC, area under the receiver operating characteristic curve; MLP, multilayer perceptron; LR, logistic regression; XGBoost, extreme gradient boosting; AdaBoost, adaptive boosting; GBC, gradient boosting tree model; KNN, k-nearest neighbor.
Comparison of the ML-Based Model With the Pre-existing Scores
To gain a comprehensive understanding of our model’s predictive ability, we also included several existing DVT scoring systems for detailed comparison. Table 5 and Supplemental Table 4 provide detailed comparisons of predictive performance, and Figure 3 shows ROC and DCA curves.
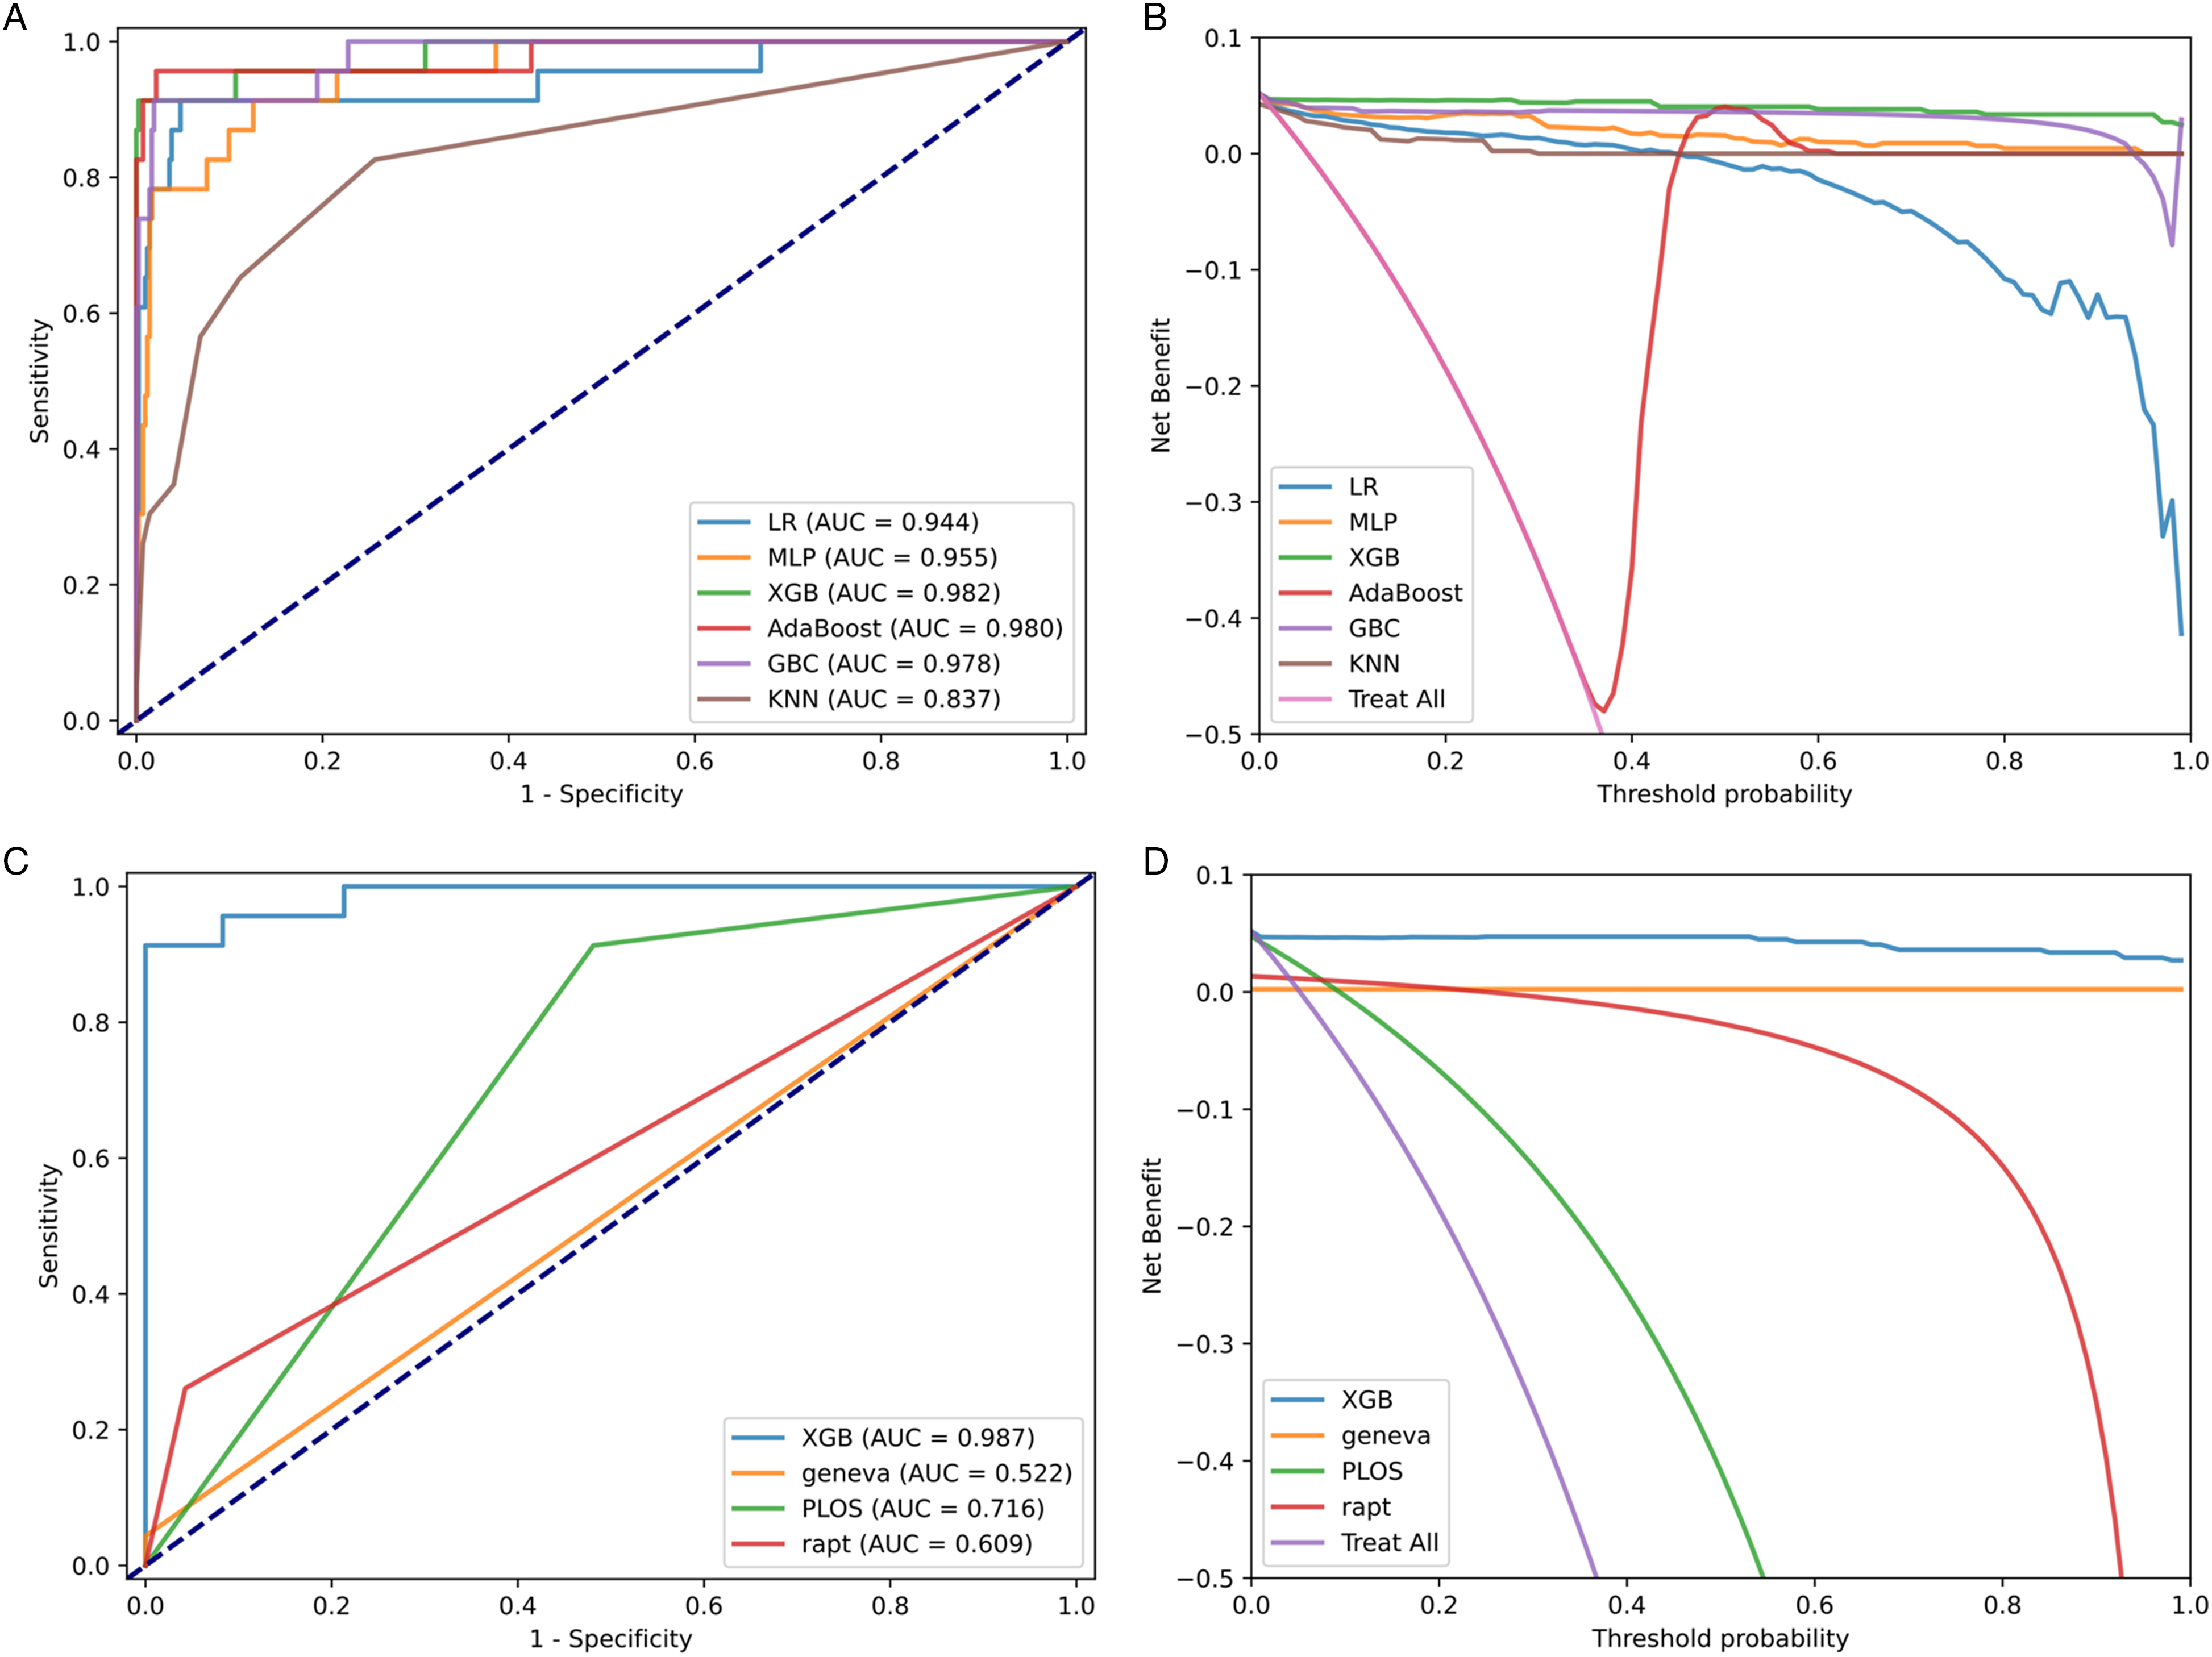
Evaluate the predictive model for DVT and PE. (A) The ROC curves of different machine learning prediction models. (B) The DCA curves of different machine learning prediction models. (C) The ROC curve of the optimal machine learning model and traditional scoring. (D) The DCA curve of the optimal machine learning model and traditional scoring.
Performance Summary in Terms of AUC, Sensitivity, Specificity, and Accuracy.

Abbreviations: AUC, area under the receiver operating characteristic curve; MLP, multilayer perceptron; LR, logistic regression; XGBoost, extreme gradient boosting; AdaBoost, adaptive boosting; GBC, gradient boosting tree model; KNN, k-nearest neighbor.
The results on the test set showed that all ML models had an AUC >0.8, while the highest score among the traditional scoring systems was PLOS (0.716). The sensitivity of ML model AdaBoost was 0.957, which was higher than most of the scoring systems. PLOS score also showed high sensitivity (0.913), but its specificity (0.519) and accuracy (0.539) were lower than those of the ML models. Several traditional scores such as Geneva and Rapt achieved very high specificity and accuracy, but their sensitivity was very low. This means that these scores were unable to detect potential positive DVT or PE patients, while ML models were very balanced. Among them, XGBoost performed the best on most evaluation metrics except for specificity and NPV, with the highest AUC of 0.982, and it also had the greatest net benefit gain on the DCA curve. In our study, XGBoost was considered the best DVT and PE prediction model.
Most Important Predictors of DVT and PE
Next, we used the SHAP algorithm to identify the best predictors for DVT or PE occurrence, in order to help improve clinical outcomes by implementing effective interventions as early as possible. The ranking of SHAP values for each feature in the training data set based on the optimal predictive model XGBoost is shown in Figure 4. The results showed that direct bilirubin was the most important feature affecting the prediction of DVT and PE in patients, followed by indirect bilirubin, D-dimers, and activated partial thrombin time.

SHAP analysis results of optimal DVT and PE prediction model XGBoost. (A) Average impact of pre-operate clinical features on model output magnitude. (B) SHAP scores for XGBoost-based predictor displayed as a bee diagram (rank 1-9 in importance).
Additionally, to obtain the exact form of factors influencing DVT and PE, SHAP dependence plots were used for detailed description. SHAP values greater than zero were considered as a threshold and were regarded as risk factors. At this point, critical points corresponding to each feature can be observed. The analysis results are shown in Figure 5 and Supplemental Figures 2 and 3. The results showed that the lower levels of direct bilirubin, D-dimers, hypersensitive C-reactive protein, carbon dioxide, and urea are protective factors for DVT and PE, while lower levels of indirect bilirubin, activated partial thrombin time, red blood cells, and creatinine are risk factors for DVT and PE. Overall, this type of analysis can help clinicians understand the potential intervention outcomes and design appropriate personalized treatment strategies for early intervention to reduce the risk of DVT and PE.
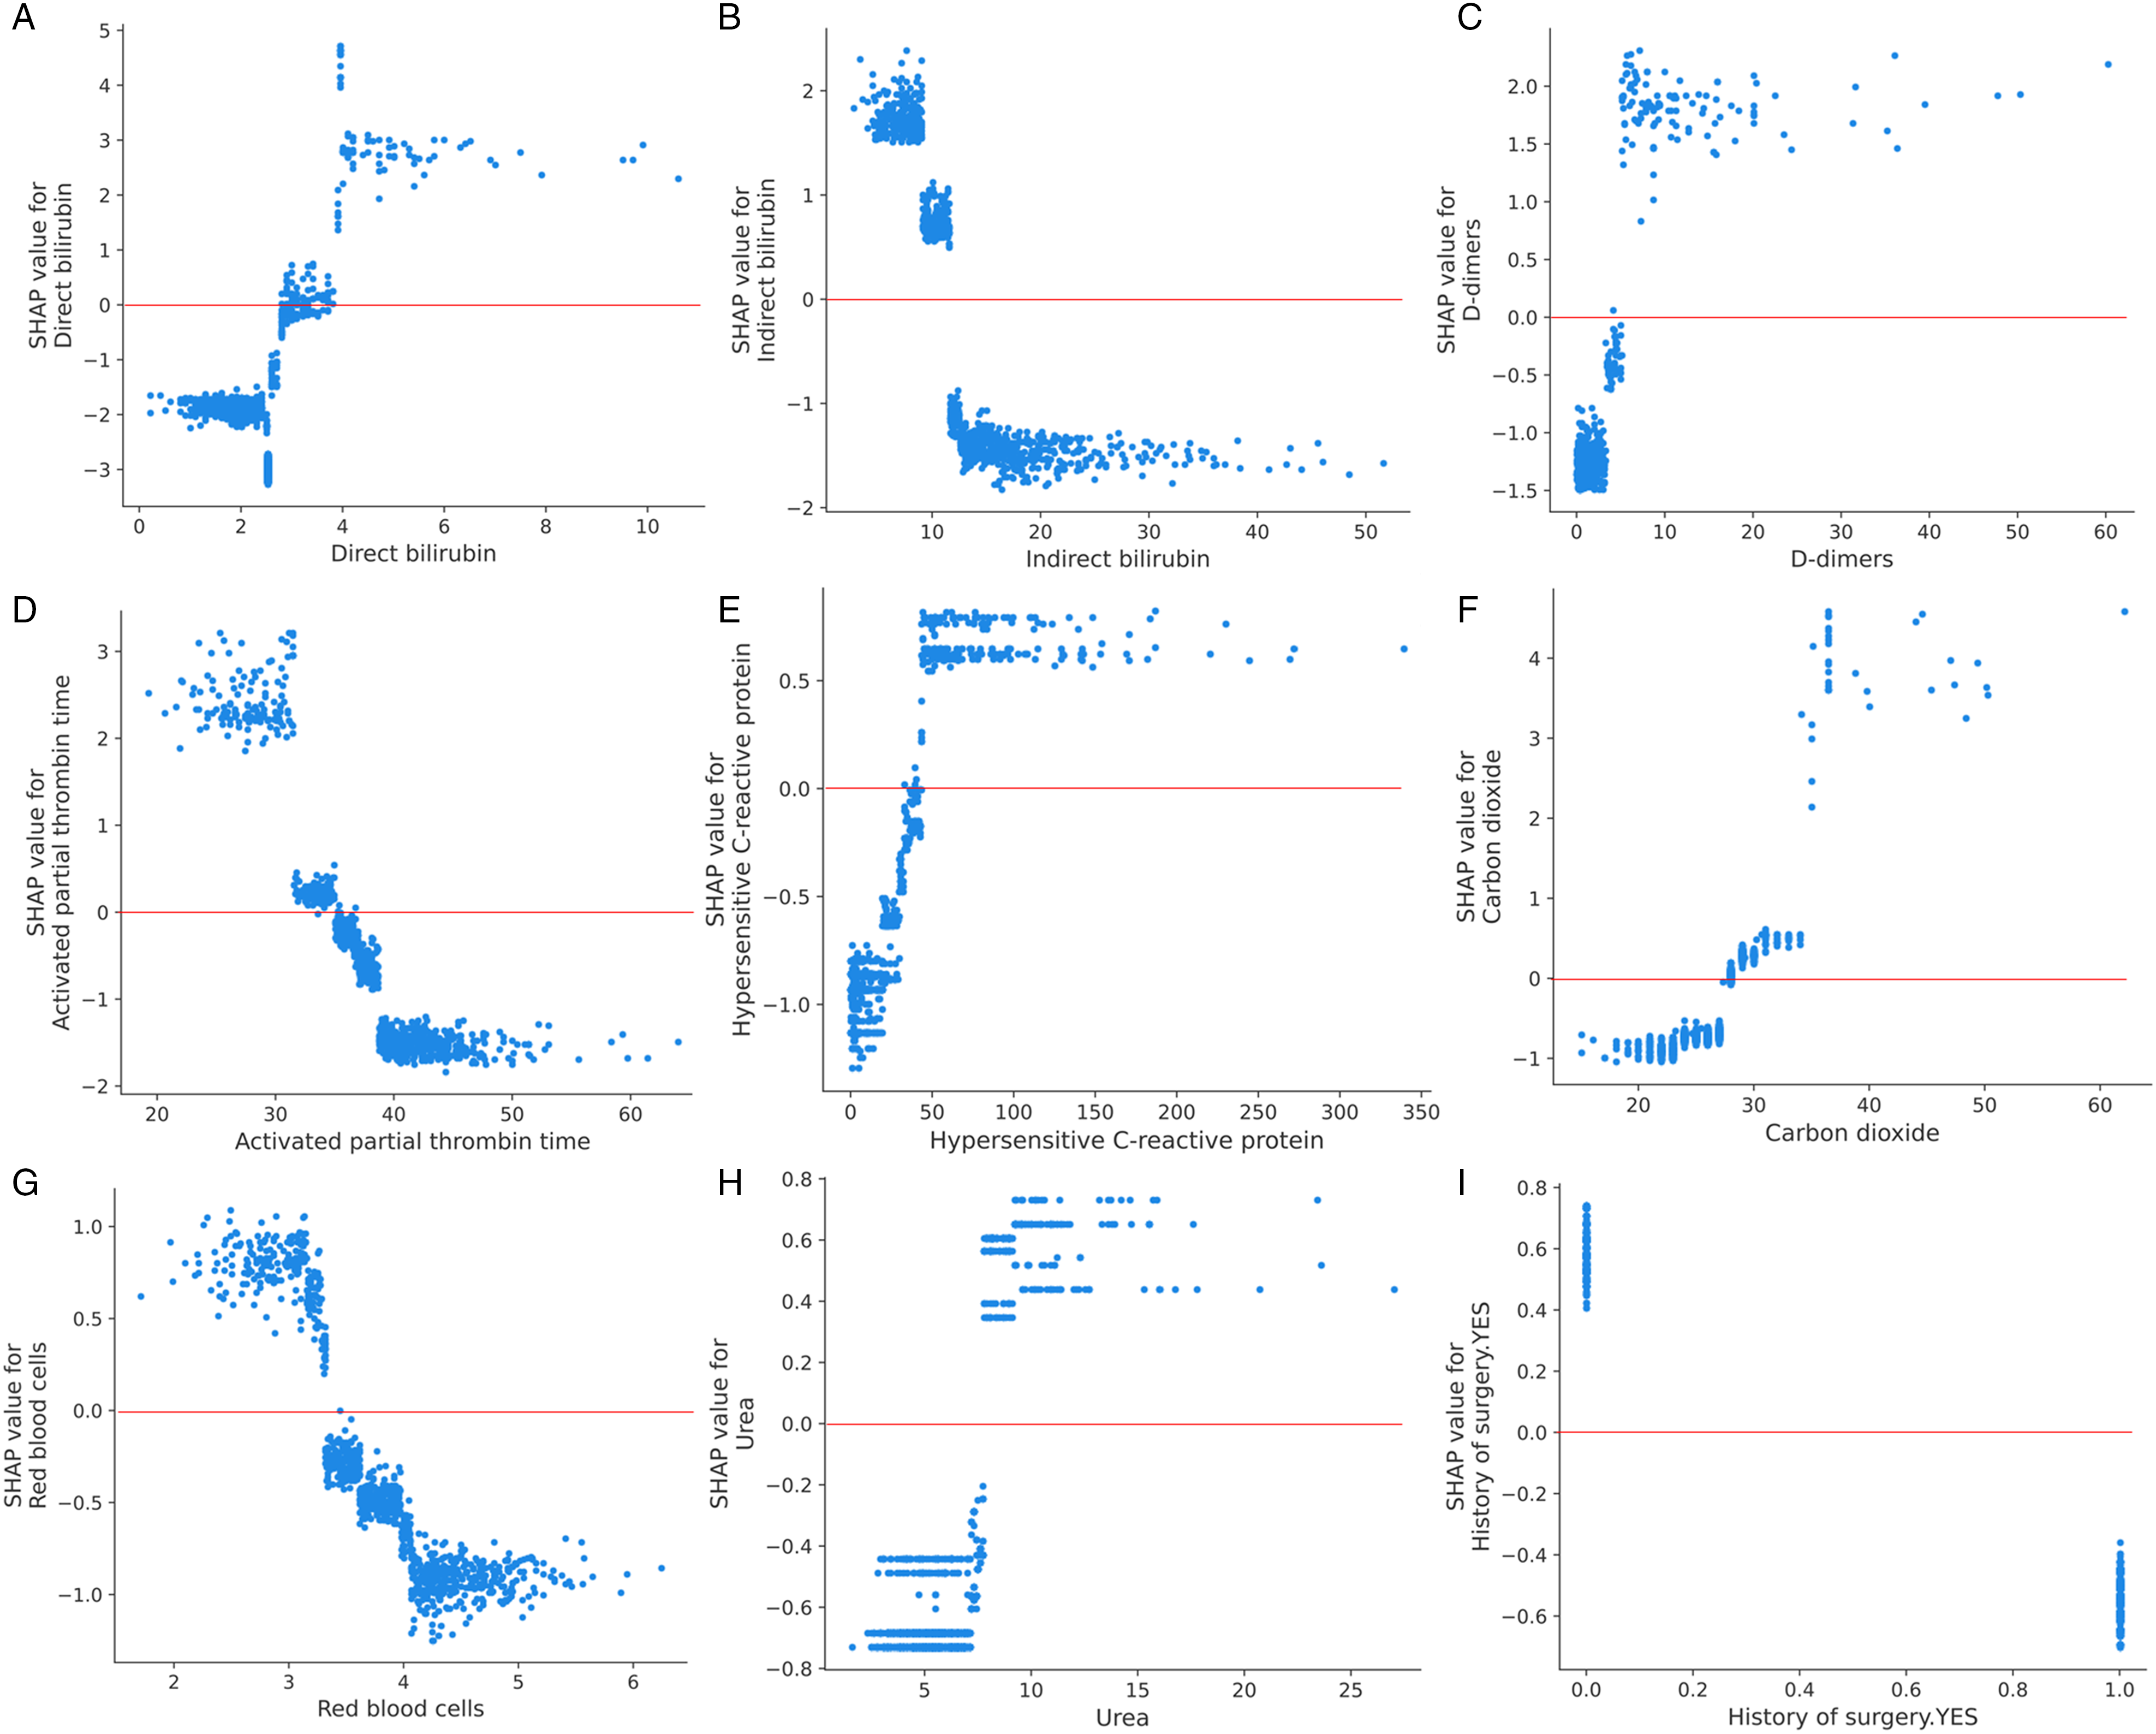
Dependence plot based on SHAP values shows the influence of a single feature on the XGBoost-based prediction model output. SHAP values greater than zero were considered as a threshold and were regarded as risk factors. (A–I) SHAP values of direct bilirubin, indirect bilirubin, D-dimers, activated partial thrombin time, hypersensitive C-reactive protein, carbon dioxide, red blood cells, urea, and creatinine.
Online Tool for XGBoost-Based DVT and PE Prediction
We have developed an online DVT and PE prediction tool (www.dvt-prediction.com) for clinical use based on the optimal prediction model XGBoost and the included clinical features (Figure 6). After entering the required preoperative clinical features for prediction, the system will automatically generate a unique ID for result inquiry, and the DVT and PE prediction result can be obtained on the query interface.
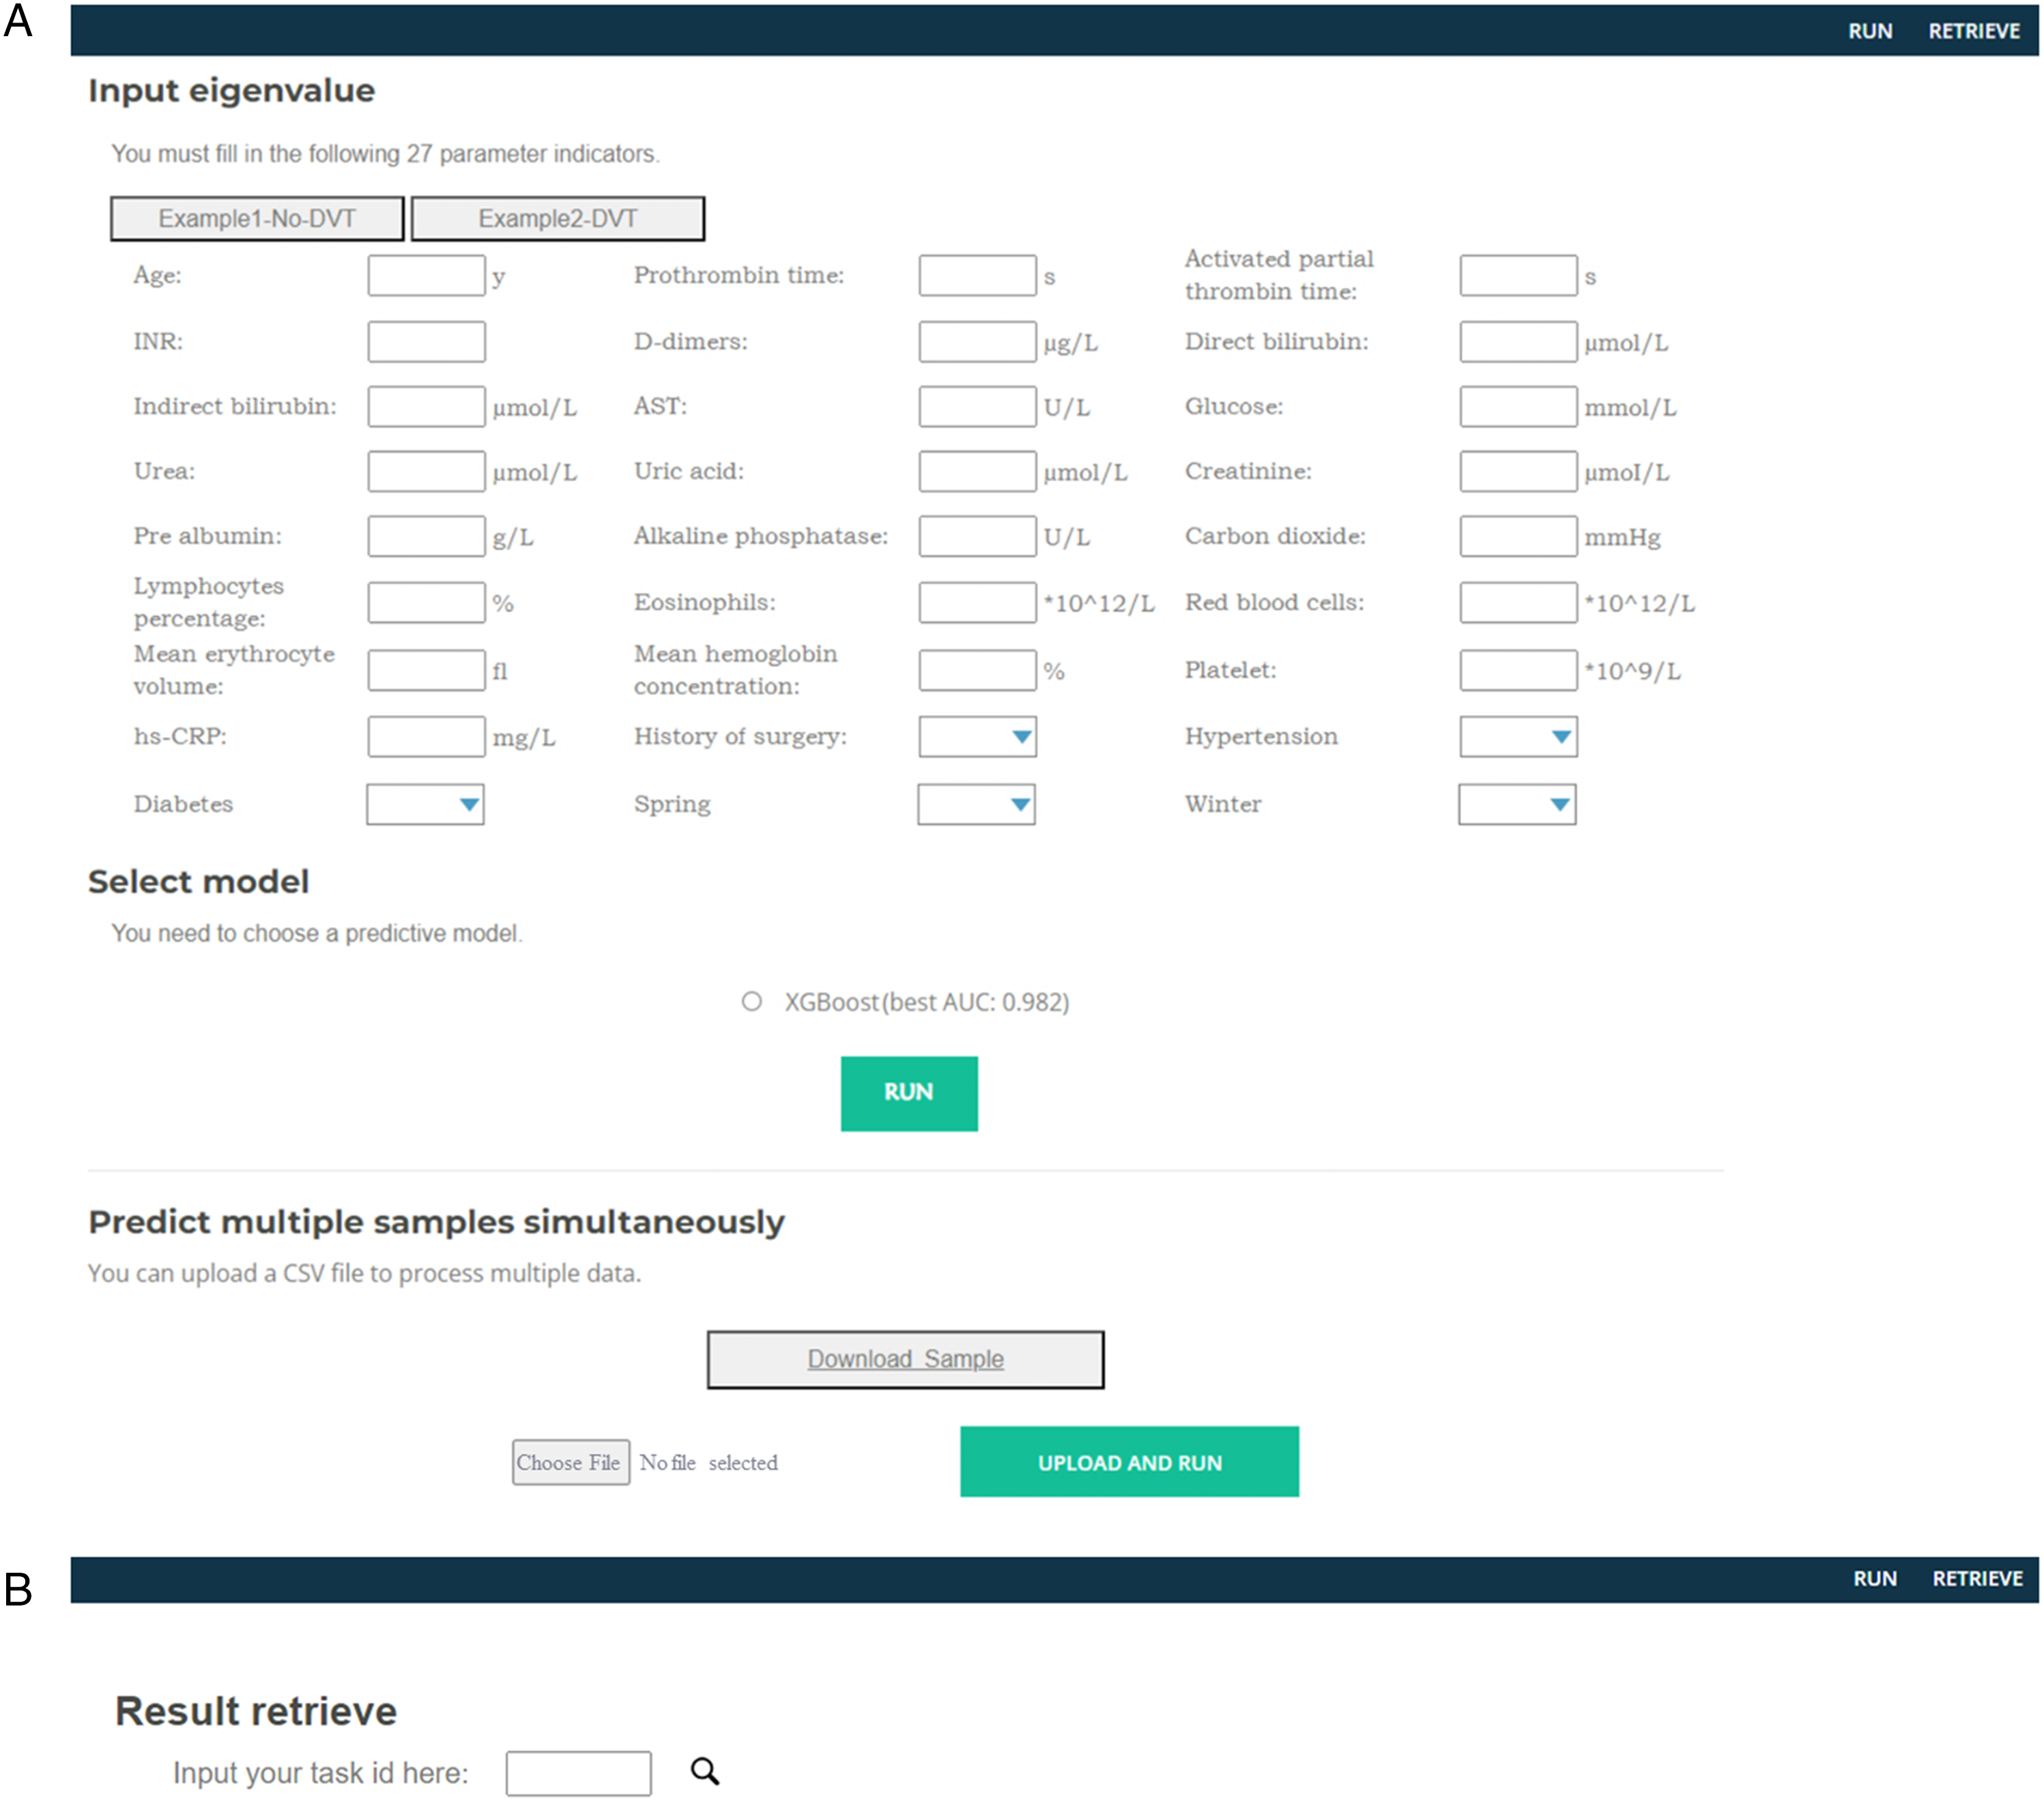
Online tools for diagnosis of DVT and PE using pre-operate clinical features. (A) Diagnosis page. (B) Results query page.
Discussion
Our study included 1481 patients who underwent elective hip replacement surgery under general anesthesia, with all patients receiving perioperative prophylactic anticoagulation. Unfortunately, 76 patients were diagnosed with DVT or PE and had to be discharged during hospitalization, resulting in an overall incidence rate of 5.1%, which was similar to that reported by Fu and Reilly.19,20 The possible reasons are as follows: underestimation of asymptomatic DVT21,22 and overlooking the risk of DVT in the healthy limb.23,24 Furthermore, delayed time from hip injury to the surgery also leads to longer bed rest and delayed preoperative anticoagulation, which increases the likelihood of DVT in China. 20 As a result, our data set showed a higher percentage of DVT or PE occurrence during hospitalization than previously reported in literature.13,14
The Caprini, Geneva, and Rapt scores are common instruments to assess the risk of DVT or PE and limited applicability in patients undergoing THA. The Caprini score assigns a score of 5 to all THA patients for the item “elective critical replacement” or “hip, pelvis, or lower extremity fracture,” resulting in all THA patients being classified as high risk for DVT. Similarly, the Geneva is not informative in THA patients due to the high prevalence of unilateral limb pain and swelling, resulting in most patients being classified as moderate risk. Therefore, the current risk assessment tools are inadequate for identifying patients who are truly at risk for DVT or PE after the THA operation. Numerous studies have investigated risk factors associated with DVT following THA, including age, obesity, metabolic syndrome, cardiovascular disease, previous history of thrombosis, and ASA classification.25–27 In addition, factors such as history of diabetes, female, duration of surgery, and blood loss have been identified as significant contributors to postoperative DVT. 20 Despite the multitude of risk factors identified, the available assessment systems remain limited to accurately predict the occurrence of postoperative DVT.
As THA surgical techniques continue to advance, the differences in intraoperative factors are becoming less pronounced. Therefore, we aimed to develop a preoperative risk assessment tool, similar to the Caprini score and Geneva score, that can diagnosis patients at high risk for DVT following THA at the early stage while excluding intraoperative factors.
Traditional methods for identifying risk factors typically rely on building risk models based on univariate or multivariate regression models, but these models often overlook interactions and nonlinear relationships among variables. In contrast, ML models can better capture the complex relationships among variables and uncover potential nonlinear relationships and interactions. The SHAP algorithm is a method used for ML interpretation. The algorithm is based on the Shapley value concept in game theory, which calculates the contribution of each feature to the prediction. This allows us to understand the impact of each feature on the model and further explain the model's prediction results.
In our study, XGBoost performed the best with the highest AUC of 0.982, and it also had the greatest net benefit gain on the DCA curve. Compared to Imai's tool, which utilizes age and D-dimer levels in a formula, achieved an AUC of 0.905 (0.836-0.975). 28 We consider the results of our model to be feasible, particularly as it accounts for multiple patient characteristics. However, we acknowledge the potential for overfitting of the model due to imbalanced data distribution, and thus, steps should be taken to prevent this.
The unexpectedly high weighting of direct and indirect bilirubin in our model needs further investigation. Direct bilirubin, also known as conjugated bilirubin, is produced when unconjugated bilirubin enters the liver and is bound to glucuronide by intrahepatic glucuronosyltransferase. Interestingly, recent animal studies have demonstrated that hyperbilirubinemia can increase the size of cerebral infarcts and the risk of cerebral infarction. 29 Additionally, Wang’s study found a significant correlation between bilirubin levels and stroke, 30 and Dural's study showed that mild hyperbilirubinemia was associated with increased anti-inflammatory and antioxidant capacity, which may offer some protection against cardiovascular disease. 31 In our study, we observed a positive association between bilirubin levels and postoperative DVT or PE, partially supporting these previous findings.
We also discovered that an elevated level of indirect bilirubin may have a protective effect against the development of DVT. Furthermore, we did not find a significant correlation between total serum bilirubin levels and the occurrence of DVT in our model, which suggests that the protective effect may be associated more specifically with indirect bilirubin levels. Therefore, it is more likely that an increase in indirect bilirubin levels could prevent the occurrence of DVT to some extent. Our findings also suggest that bilirubin levels could be used in conjunction with conventional coagulation tests to determine a patient’s risk for developing DVT or PE.
However, it should be emphasized that the relationship between direct and indirect bilirubin and DVT presented in the significance of the characteristics represented by the SHAP analysis is more of a correlation than a causal relationship.
Coagulation routine is a classical instrument to assess the coagulation status of patients widely. D-dimer, activated partial thromboplastin time (APTT), prothrombin time (PT), and INR are enrolled. Due to its high specificity, D-dimers are used for exclusionary diagnosis, enabling the quick rule out of DVT and PE occurrences when it is negative. To enhance the accuracy of D-dimer in DVT diagnose, age-adjusted D-dimer concentration thresholds have been set for patients, allowing the inclusion of the possibility of DVT and PE when their levels exceed these thresholds.28,32,33 We observed a clustering of a significant number of D-dimer aggregates in the category of 0 to 10 μ, with those whose suggestive effect for DVT increases with concentration referenced to them. However, our study differed from others in that we did not consider D-dimer aggregates as the sole indicator of diagnostic DVT but rather in the context of the entire model species. Thus, even at low levels, D-dimer aggregates are not conclusive for the development of DVT in patients. APTT is the main criterion for evaluating whether endogenous coagulation is normal. A high APTT level indicates a possible coagulation deficiency. 34 This may also be the case if the patient is taking certain anticoagulant drugs. From the APTT levels in the model, preoperative anticoagulation does have a role in preventing the development of postoperative DVT. Elevated D-dimers and decreased APTT levels are consistent with the conventional understanding of postoperative DVT. In contrast, PT and INR had a weaker impact on the model, although they should still be considered in combination with other factors. These findings highlight the importance of routine coagulation test in predicting the occurrence of DVT or PE postoperatively.
The level of carbon dioxide binding in the renal function test yielded unexpected results, which indirectly reflects the alkaline reserve in the body. Higher levels of carbon dioxide binding usually indicate metabolic alkalosis or respiratory acidosis. Surprisingly, the SHAP analysis suggested that a high level of carbon dioxide binding can partially prevent postoperative DVT development. This contradicts our conventional understanding as previous clinical experience shows that DVT is more likely to occur during metabolic acidosis. 35 Unfortunately, due to the high number of missing values in arterial blood gas, it was removed in the preprocessing. Further analysis of carbon dioxide binding requires blood gas analysis for a more detailed assessment.
Our diagnostic tool includes several other features, such as prealbumin, red blood cell count, creatinine, and high-sensitivity C-reactive protein, all of which are necessary preoperative laboratory tests preoperatively. Additionally, we incorporated age and surgical history as history-related features. Some features in the tool have SHAP values that do not align with clinical knowledge. However, it is important to consider that these features contribute differently to the overall model and should be viewed as an ensemble.
Our study has several limitations. First, the outcome was restricted to the duration of hospitalization, as we lacked further clinical data to track patients after discharge. Additionally, there are numerous complex factors that could affect outcomes beyond the 30-day postoperative period. Thus, our study focused on identifying high-risk patients for DVT or PE during the hospitalization period. Second, due to limitations in the data system, we were unable to observe patients who were transferred to rehabilitation facilities around 7 days after surgery for a longer period of time. Lastly, while we determined the outcome variables primarily based on discharge diagnosis, we were unable to determine the extent of DVT or PE in the patients.
Conclusions
We developed a prediction diagnostic tool for DVT and PE occurrence during postoperative hospital stay in patients undergoing elective THA by utilizing ML techniques in conjunction with routine preoperative testing. Our tool demonstrated promising predictive performance in the data; however, further validation with additional data is necessary to establish its clinical utility. Considering the feature importance, bilirubin could be a potential importance predictor of DVT and PE.
Supplemental Material
sj-docx-1-cat-10.1177_10760296231186145 - Supplemental material for Machine Learning-Based Screening of Risk Factors and Prediction of Deep Vein Thrombosis and Pulmonary Embolism After Hip Arthroplasty
Supplemental material, sj-docx-1-cat-10.1177_10760296231186145 for Machine Learning-Based Screening of Risk Factors and Prediction of Deep Vein Thrombosis and Pulmonary Embolism After Hip Arthroplasty by Ruifeng Ding, Yu Ding, Dongyu Zheng, Xingshuai Huang, Jingya Dai, Hui Jia, Mengqiu Deng, Hongbin Yuan, Yijue Zhang and Hailong Fu in Clinical and Applied Thrombosis/Hemostasis
Footnotes
Author Contributions
RD, MD, and YZ designed the study and wrote original draft; DZ, XH, JD, and HJ collected the data; RD, YD, and YZ analyzed the data and performed the analysis; HF and HY reviewed the conclusions; and RD, YZ, and YD edited and revised the manuscript.
Data Availability Statement
The raw data supporting the conclusions of this article will be made available by the authors, without undue reservation. Please contact corresponding authors for more data information.
Declaration of Conflicting Interests
The author(s) declared no potential conflicts of interest with respect to the research, authorship, and/or publication of this article.
Ethics Statement
The studies involving human participants were reviewed and approved by the Ethics Committee of Shanghai Changzheng Hospital (No. CZEC (2021)-02).
Funding
The author(s) disclosed receipt of the following financial support for the research, authorship, and/or publication of this article: This work was supported by the Science and Technology Commission of Shanghai Municipality (grant number No. 20Y11909500).
Supplemental Material
Supplemental material for this article is available online.
References
Supplementary Material
Please find the following supplemental material available below.
For Open Access articles published under a Creative Commons License, all supplemental material carries the same license as the article it is associated with.
For non-Open Access articles published, all supplemental material carries a non-exclusive license, and permission requests for re-use of supplemental material or any part of supplemental material shall be sent directly to the copyright owner as specified in the copyright notice associated with the article.