
Abstract
The purpose of this study is to establish a novel pulmonary embolism (PE) risk prediction model based on machine learning (ML) methods and to evaluate the predictive performance of the model and the contribution of variables to the predictive performance. We conducted a retrospective study at the Shanghai Tenth People's Hospital and collected the clinical data of in-patients that received pulmonary computed tomography imaging between January 1, 2014 and December 31, 2018. We trained several ML models, including logistic regression (LR), support vector machine (SVM), random forest (RF), and gradient boosting decision tree (GBDT), compared the models with representative baseline algorithms, and investigated their predictability and feature interpretation. A total of 3619 patients were included in the study. We discovered that the GBDT model demonstrated the best prediction with an area under the curve value of 0.799, whereas those of the RF, LR, and SVM models were 0.791, 0.716, and 0.743, respectively. The sensibilities of the GBDT, LR, RF, and SVM models were 63.9%, 68.1%, 71.5%, and 75%, respectively; the specificities were 81.1%, 66.1, 72.7%, and 65.1%, respectively; and the accuracies were 77.8%, 66.5%, 72.5%, and 67%, respectively. We discovered that the maximum D-dimer level contributed the most to the outcome prediction, followed by the extreme growth rate of the plasma fibrinogen level, in-hospital duration, and extreme growth rate of the D-dimer level. The study demonstrates the superiority of the GBDT model in predicting the risk of PE in hospitalized patients. However, in order to be applied in clinical practice and provide support for clinical decision-making, the predictive performance of the model needs to be prospectively verified.
Keywords
Introduction
Venous thromboembolism (VTE) is a disorder that includes deep venous thrombosis (DVT) and pulmonary embolism (PE). The incidence of VTE is increasing annually. According to relevant data, the total incidence of VTE in the Asian population is 17 to 70 per 100,000 people, thus making it the third most common vascular disease.1,2 PE, which is a leading cause of cardiovascular death, 3 occurs when an embolus breaks off a thrombus in a vein and occludes blood vessels of the pulmonary artery. 4 PE affects approximately 112 patients per 100 000 annually in the United States; 5 furthermore, the incidence of PE increased from 23 per 100 000 in 1993 to more than 65 per 100,000 in 2012. 6 A study estimated the overall incidence of postpartum PE among Taiwanese women who had undergone Cesarean sections to be 0.154 per 1000. 7
The symptoms of PE are generally detected incidentally; in many cases, patients with PE die without presenting symptoms. 8 An estimated 60 000 to 100 000 people died from PE in the United States in 2015. 9 In the same study, the all-cause mortality rate of PE patients was 11.4% during the first 2 weeks after diagnosis and 17.4% at 3 months, where 45.1% of deaths were ascribed to PE. Furthermore, 7.9% of patients had recurrent PE within 3 months of presentation of symptoms. Among these patients, the mortality rate was 33.7% at 2 weeks and 46.8% at 3 months. 10 Furthermore, PE survivors can develop post-PE syndrome and have a higher risk of recurrent PE and dysfunction.11,12
Early diagnosis and appropriate management can reduce mortality and morbidity in PE patients. 13 However, the diagnosis and screening of PE is challenging owing to the nonspecific nature of the classic presenting symptoms, and highly specialized expertise, such as that typically possessed by nuclear radiologists, is required. Therefore, it is crucial to establish a prevention concept for PE in hospitalized patients and assess the risk of PE. Currently, the VTE screening scale typically used in hospitals is Caprini; however, the accuracy of the Caprini scale is poor, rendering it ineffective for accurately screening high-risk VTE patients. Moreover, the current screening scales require manual scoring, which is inconvenient and makes performing large-scale screenings difficult; moreover, key data may be lost. Therefore, a VTE risk prediction tool that is easy to use and demonstrates a better predictive performance should be developed. Risk prediction models use variables (covariates) to estimate the absolute probability or risk that a certain outcome will occur or will occur within a certain time period in a patient with a certain predictor variable. 14
The implementation of individualized VTE risk assessment based on machine learning (ML) can significantly reduce the risk of VTE in in-hospital patients. It was discovered in a previous study that ML in the form of logistic regression (LR) and artificial neural networks contributed positively to the risk factor analysis of complications after spine surgery, including VTE. 15 Furthermore, the ML approach may offer clinical benefits for VTE risk stratification in cancer outpatients undergoing chemotherapy. Using the ML approach to devise a risk assessment model may also assist clinicians at critical stages of clinical decision-making.16,17 The study shows that ML-based risk prediction models can identify high-risk patients with greater accuracy compared with previously developed VTE scoring models. In addition, the ML model can be used even when the operator does not possess expertise regarding the relevant risk factors. 18
The purpose of this study is to establish a novel PE risk prediction model based on ML methods, as well as to evaluate the predictive performance of the model and the contribution of variables to the predictive performance.
Materials and Methods
Study Design and Patients
The study was approved by the Ethics Committee of Shanghai Tenth People's Hospital (SHSY-IEC-4.1/19-140/01).
We conducted a retrospective study at the Shanghai Tenth People's Hospital using clinical inpatient data. All inpatients that received pulmonary computed tomography (CT) imaging from January 1, 2014 to December 31, 2018 in the Shanghai Tenth People's Hospital were included. The other inclusion criteria were as follows: admitted patients older than 18 years, hospital length of stay of at least 2 days, and patients suspected of PE. The exclusion criteria included patients with a history of PE before admission and those who had previously consumed antithrombotic drugs (antiplatelet, anticoagulant, thrombolytic, and defibrillation drugs) for prophylaxis. We retrieved and parsed the texts from CT verification reports for PE outcomes via computer programming, followed by manual reconfirmation by physicians. Finally, the cohort comprised 3619 samples, of which 629 were positive, and 2990 were negative.
Diagnostic Criteria of PE
PE-positive diagnoses include those where a filling defect is identified in the central, segmental, or subsegmental pulmonary arteries. PE-negative diagnoses refer to those where evidence of PE is not found. 19 Inconsistent conclusion of test results was adjudicated by 5 experienced respiratory physicians and radiologists.
Data Preprocess and Feature Construction
The outcome, inclusion, and exclusion conditions and potential risk factors were obtained from clinical EHR databases: inpatient records, diagnoses, drug orders, imaging checks, laboratory tests, vital signs and nursing records, and operation and anesthesia records. Based on a system provided by Synyi Medical Technology (Shanghai), which aims at the EHR system integration and data governance, we constructed a feature engineering pipeline to collect and process related data before PE examination. This procedure is also known as extract–transform–load (ETL).
According to ETL, all features can be categorized into 3 types (static features, dynamic features, and derived features). Some static features are retrievable from original databases directly, such as demographic characteristics, life and social behaviors, and admission diagnoses. Meanwhile, some other features are dynamic and recorded as a time series, such as vital signs and laboratory tests. For specific features, we set up a group of time windows before the outcomes (PE examination) and then aggregated all records within these time windows to derive statistics as features, including the maximal, minimal, and mean values, as well as the average change rates. The settings of the time windows depended on data fields and were advised by physicians and medical knowledge experts. For instance, blood cell tests were windowed within 1, 3, and 7 d, whereas enzyme and antibody tests were windowed as early as 1 month and 1 year. Furthermore, we included some derived variables such as the body mass index, compound symptoms, and drug histories, including anticoagulant usage.
Feature Evaluation and Filtering
Thousands of variables can be obtained through our ETL pipeline. However, some features might have high missing value rates that are inconsistent with PE, or they might exhibit strong mutual collinearity with each other, which may yield unstable ML results. For instance, certain uncommon surgery history belongs to the former case, whereas the latter case includes test values within different time windows for the same laboratory items. As an example, red blood cell count could be expanded to “maximum red blood cell count within 3 days” and “minimum mean red blood cell volume within 2 days.” Therefore, it is critical to perform feature selection and filtering to improve the robustness, interpretability, and generalization performance of ML prediction.
We used the scorecard method, 20 a popular technique used in credit scoring, to filter less significant variables. We calculated the information value (IV) for a categorical variable based on the weight of evidence of each level, whereas numerical variables were grouped into bins automatically using a decision tree algorithm before the scorecard measurement. A high IV score represents a strong predictive power, and a feature is preserved only if its IV scores exceed a fixed threshold. It is noteworthy that variables with high missing rates need not be managed specifically as they can be implicitly removed during the scorecard procedure.
To address multicollinearity among variables, we considered the correlation coefficients (CCs) of feature pairs as exclusion criteria. For computation, only features with significant IV were included as candidates. Among all feature pairs with absolute CC values exceeding 0.6, the feature with a smaller IV score was removed.
Machine Learning Models
To assess the predictability of the ML models, the cohort was split randomly into training and testing sets in proportions of 80% (485 positive cases and 2382 negative cases) and 20% (144 positive cases and 608 negative cases), respectively. The training set was used to train the models, including the optimization of the model architectures and parameters, whereas the testing set was used to assess the performances of the prediction models and model overfitting.
Five-fold cross-validation was employed in the training set to estimate the prediction errors. At each cross-validation round, one-fold data were treated as the validation set and the remaining data were used for the parameter fitting of the ML models. Subsequently, the results of all rounds were combined to obtain an overall model evaluation result. Specifically, we computed the area under the curve (AUC) of the receiver operating characteristics and confusion matrices, as well as derived the accuracy, f1 score, precision, sensitivity, and specificity.
We adopted the gradient boosting decision tree (GBDT) algorithm to build a risk prediction model. As a tree boosting method, the GBDT has been shown to outperform many classification tasks and has been used widely in recent years owing to its efficiency, accuracy, and interpretability. In addition, we investigated other representative algorithms for a baseline comparison: LR, support vector machine (SVM) with radial basis function kernels, and random forest (RF).
The configuration variables of the ML models, also known as hyperparameters, such as the tree number, maximal tree depth, and learning rate of the GBDT, as well as the kernel coefficients of the SVM, comprise another important issue affecting the prediction power of the model. We used the average AUC value from cross-validation as the model evaluation for one configuration of the hyperparameters. Searching for the best hyperparameters for maximizing the AUC value is referred to a black box optimization problem, which has been solved using the simulated annealing method, a practical stochastic optimization technique that is more effective compared with alternatives such as grid searching or random searching.
The ML component of this project was developed in Python. The LR, SVM, and RF models used were based on the Scikit-learn package, whereas the GBDT was based on XGBoost, 21 a widely used method to realize the GBDT. The hyperparameters of all the models were optimized using Hyperopt 22 with the default configuration of simulated annealing.
Outcome Indicators
To evaluate the predictive efficacy of the ML-based PE risk prediction models for PE risk in hospitals, we evaluated the AUC, sensitivity, specificity, and accuracy of the risk prediction models.
Statistical Analysis
The patients’ demographics and features included in the final ML model were summarized descriptively. Continuous variables were expressed as N, mean ± SD, and median (Q1, Q3), whereas categorical variables were presented as frequency (%). In addition, the distribution balance between the training and testing groups was evaluated via statistical tests, and P < .05 was considered statistically significant. Statistical analyses were conducted using SPSS version 22.0 (SPSS Inc., Chicago, IL).
Results
A total of 3619 patients were included in this study, of which 2867 and 752 patients were assigned to the training and testing sets, respectively. The training set comprised 485 PE-positive patients (age, 70.5 ± 12.8 years old; male, 48.66%) and 2382 PE-negative patients (age, 65.6 ± 14.1 years old; male, 46.94%), whereas the testing set comprised 144 PE-positive patients (age, 69.1 ± 15 years old; male, 41.67%) and 608 PE-negative patients (age, 65.2 ± 14.7 years old; male, 46.55%) (Table 1).
Demographic Characteristics of In-Hospital Patients.

Abbreviation: PE, pulmonary embolism.
The following variables were selected in the study (Table 2): in-hospital duration, maximum neutrophil count within 2 weeks, maximum serum albumin level within 3 d, minimum plasma fibrinogen level within 1 d, extreme growth rate of plasma fibrinogen level within 2 weeks, plasma prothrombin time average growth rate within 2 weeks, minimum mean red blood cell volume within 2 d, last thrombin time within 1 week, extreme growth rate of urea nitrogen level within 2 weeks, maximum red blood cell count within 3 d, maximum D-dimer level within 2 weeks, extreme growth rate of D-dimer level within 2 weeks, maximum C-reactive protein level within 2 weeks, extreme growth rate of C-reactive protein level within 2 weeks, any primary care within 1 month, and base excess level.
Characteristics Included in the GBDT Model.

Abbreviations: PE, pulmonary embolism; GBDT, gradient boosting decision tree.
Figure 1 shows the curves of the receiver operating characteristics of the 4 predictors, namely LR, SVM, RF, and GBDT, on the test dataset. The detailed results of the prediction performance are presented in Table 3, including the values of sensitivity, specificity, accuracy, and AUC with 95% confident intervals. The classification threshold was specified by maximizing the F1 value. Based on the AUC for predicting the PE risks of different ML models, we discovered that the GBDT model demonstrated the best prediction with an AUC value of 0.799, whereas the RF model (AUC 0.791) was comparable, yet slightly weaker than the GBDT model. In contrast, the results of LR and SVM decreased significantly, yielding AUC values of 0.716 and 0.743, respectively. The sensibilities of these risk prediction models (GBDT, LR, RF, and SVM) were 63.9%, 68.1%, 71.5%, and 75%, respectively; the specificities were 81.1%, 66.1, 72.7%, and 65.1%, respectively; and the accuracies were 77.8%, 66.5%, 72.5%, and 67%, respectively (Table 3).
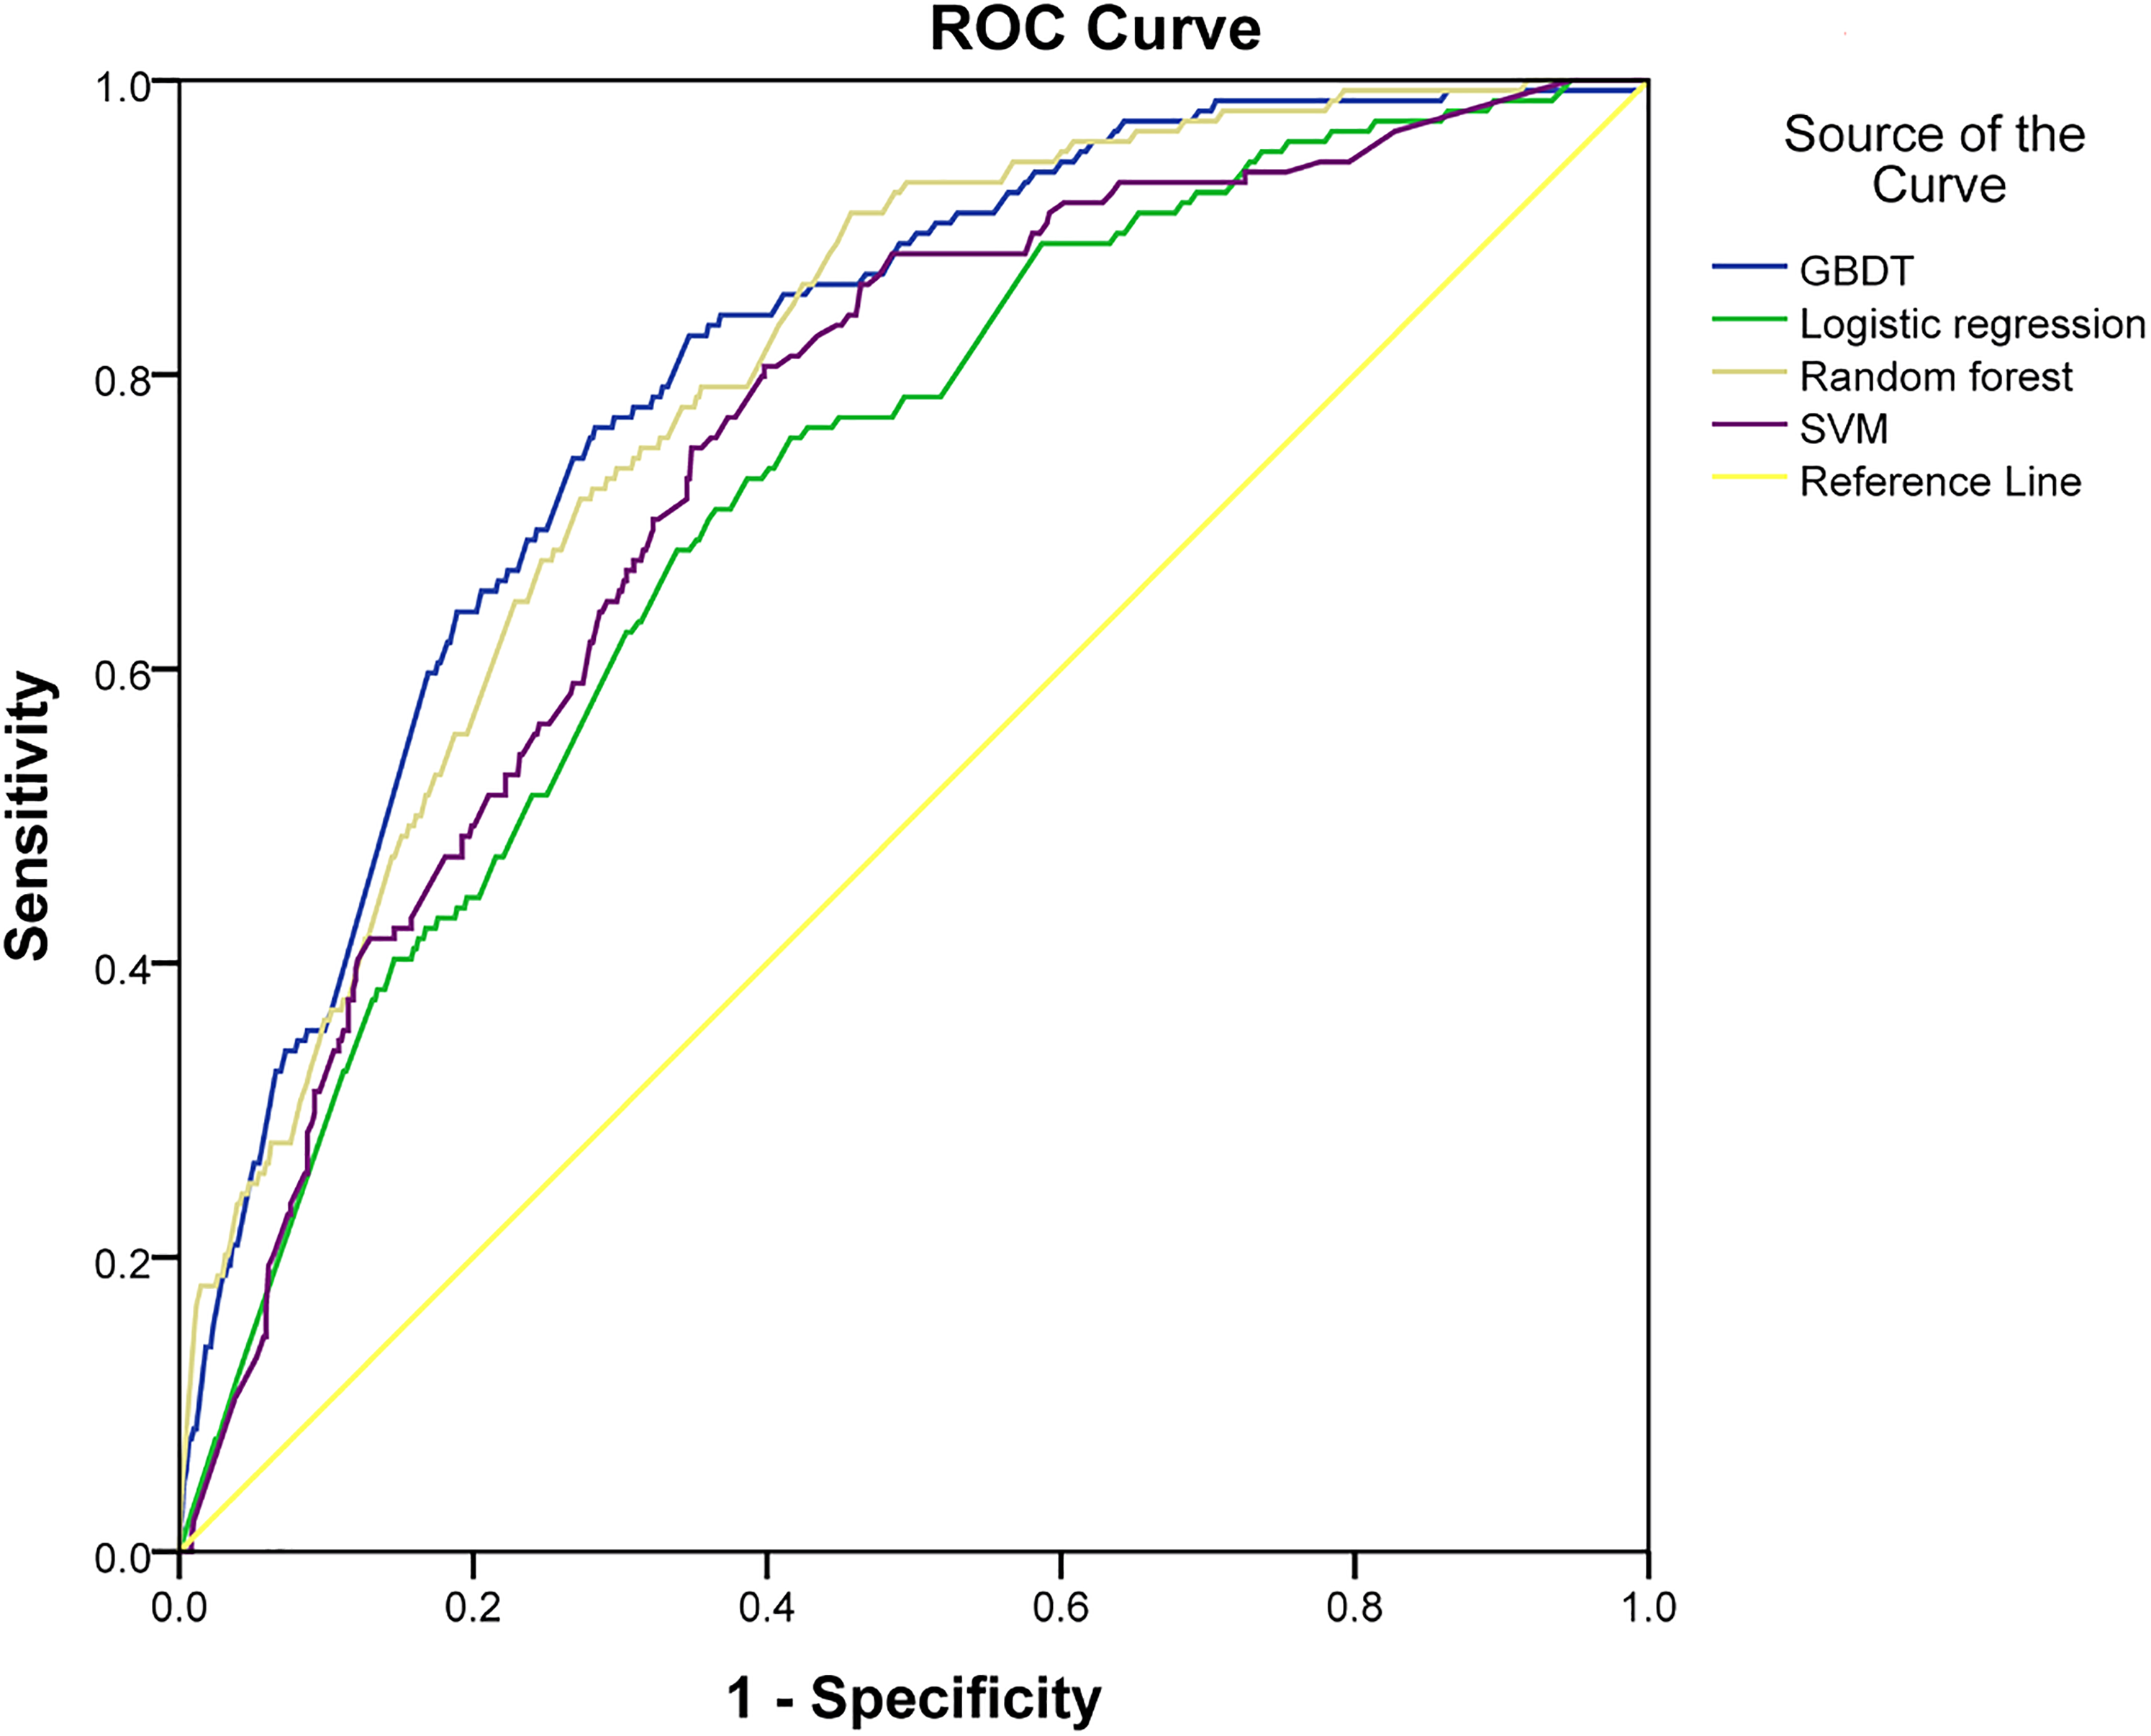
Receiver operating curves for the prediction of pulmonary embolism (PE) risk of different machine learning models (validation set).
Predictive Efficacy Analysis (Verification Set) of Different Machine Learning Models for PE.

Abbreviations: PE, pulmonary embolism; GBDT, gradient boosting decision tree; SVM, support vector machine.
We further analyzed the feature contribution based on the GBDT. The feature importance is defined as the frequency of a feature used in the ensemble of decision trees in the GBDT, which is proportional to its effect on the overall model performance. As shown in Figure 2, the maximum D-dimer level (D_dimer_max) contributed the most to the outcome prediction of the ML models, followed by the extreme growth rate of the plasma fibrinogen level (plasma_fibrinogen_rate), inhospital_duration, and extreme growth rate of the D_dimer level (D_dimer_rate).

Importance of the top 10 risk factors in the prediction model of machine learning: average scores of each feature among the overall gbtree models after cross-validation and downsampling.
Discussion
In this study, we established a novel PE risk prediction model based on ML and evaluated its efficacy in terms of AUC, sensitivity, specificity, and accuracy. We discovered that the GBDT risk prediction model demonstrated the best predictive efficacy. The AUC for predicting PE using the GBDT risk prediction model was 0.799 (95% CI: 0.762-0.837), whereas the sensibility, specificity, and accuracy were 63.9%, 81.1%, and 77.8%, respectively.
The prediction of PE risk is crucial for the prevention and treatment of PE. Previous studies have used different types of predictive models or risk scoring tools to estimate the risk of PE in hospitalized patients. Miniati's research found that the LR model can be used to estimate the risk of PE before obtaining definitive test results. 23 Several studies have confirmed that the Wells rule, modified Wells rule, simplified Wells rule, Geneva score, revised Geneva score, and simplified revised Geneva score can all be used for PE risk prediction, and the efficiency of these models was 43% to 48%.24,25 The AUC of Wells score and the revised Geneva score for the PE risk prediction of outpatients ≥65 years old are 0.632 and 0.610, respectively. 26 The Wells score and the revised Geneva score seem to have no value in predicting PE in pregnant and postpartum populations. 27 In clinical practice, the Caprini score is often used to predict the risk of VTE, but its use still has certain limitations. The study found that the Caprini VTE risk assessment model can effectively predict the VTE risk of critically ill surgical patients. 28 A Caprini score ≥11 can identify high-risk surgical patients who need more effective prevention programs. 29 However, a retrospective clinical study found that, despite the linear relationship between Caprini RAM and the risk of VTE, Caprini RAM was unable to identify a subset of medical patients who would benefit from pharmacologic prophylaxis. 30 The study found that the Caprini model has no significant correlation with the PE risk of DVT patients or the PE risk with significant hemodynamics. 31
Numerous risk factors of PE exist, in which both inherited and acquired risk factors increase the likelihood of VTE and PE, including factor V Leiden, prothrombin gene mutation (G20210-A), antithrombin deficiency, protein C deficiency, protein S deficiency, acute and chronic medical illness, trauma, surgery, malignancy and related factors, peripartum state estrogen therapy, aging, and obesity.32,33 Feature selection is a perennial yet challenging issue, and a universal solution has not been discovered. In this study, we adopted a greedy-like strategy for feature selection in the preprocessing stage. Although the strategy might only seek for a suboptimal feature subset, it is reasonable in practice considering its computational feasibility and prediction accuracy. In our study, we collected the variables of a specific time window and then determined variables suitable for the PE risk prediction model through ML analysis (the 17 variables above).
In recent years, many studies have confirmed that plasma D-dimer (the degradation product of cross-linked fibrin) can be used as a diagnostic tool for PE.34,35
The C-reactive protein levels were significantly higher in patients with PE and concomitant pneumonia, 36 which points to the fact that the C-reactive protein is a risk factor for PE. A previous study indicated that PE can be excluded in the standard C-reactive protein test, which is either performed alone or combined with other assessments. 37 Moreover, it was discovered that the C-reactive protein was associated with right ventricular dysfunction, which is a predictor of PE and may be a promising biomarker for PE risk stratification. 38
The activity of the coagulation system, which is directly related to thrombosis, increases in high-risk PE patients. 39 A study revealed that increased plasma fibrinogen levels are associated with an increased risk of PE in combination with DVT. 40 In addition, preoperatively high fibrinogen and low plasminogen levels are associated with poor long-term outcomes after pulmonary endarterectomy in patients with chronic thromboembolic pulmonary hypertension. 41
The effect of albumin and arterial blood gas on the risk of PE has also been confirmed in several studies. An experimental study revealed that ischemic-modified albumin levels may contribute to PE. 42 Inconsistent findings regarding the effect of PE diagnosis were obtained from arterial blood gas value analysis. In a retrospective study, Cvitanic and Marino 43 discovered that both the arterial blood carbon dioxide partial pressure (PaCO2) and alveolar–arterial oxygen partial pressure difference (P[A-a]O2) can be used as a basis for the exclusion of APE.
In our study, multiple time window detection indicators were used as model variables. Each indicator exhibits a time trend characteristic. Using the ML method, variables with a better correlation with the outcome (PE) were selected, thereby facilitating PE risk prediction. To the best of our knowledge, the proposed PE risk prediction model is the first risk prediction model to use variables within multiple time windows. The variables used in the risk prediction model in previous studies were variables at fixed time points. Furthermore, the detection of variables at a certain time point was affected by multiple factors, and the detected values differed from the original level. Furthermore, we estimated the frequency of the feature used in the ensemble of decision trees in the GBDT; D_dimer_max contributed the most to the outcome prediction of the ML models, followed by the plasma_fibrinogen_rate, inhospital_duration, and D_dimer_rate. Based on the detected values of the variables at different times, the risk of APE in hospitalized patients can be estimated through the model, such that clinicians can monitor the risk of APE in patients on a regular basis.
However, this study has several limitations. First, this is a retrospective study. In addition, we have included patients only from a single center, and thus, the application of our findings in other populations and institutions needs to be further verified.
Conclusion
The GBDT model exhibited the best performance in terms of PE risk prediction in our study. However, before it is applied in clinical practice to provide support for clinical decision-making, the predictive performance of the model needs to be prospectively verified.
Footnotes
Acknowledgments
The authors acknowledge the staff at the Shanghai Tenth People's Hospital who have contributed to this study. We thank Shanghai Synyi Medical Technology Co., Ltd for assistance with the data analysis and providing the statistical platform.
Declaration of Conflicting Interests
The study was supported by the major project in intelligent healthcare of Shanghai Municipal Health and Family Planning commission (03.02.18.007).
Funding
The authors disclosed receipt of the following financial support for the research, authorship, and/or publication of this article: This work was supported by the major project in intelligent healthcare of Shanghai Municipal Health and Family Planning Commission (grant number 03.02.18.007).